Showing posts with label 8. Show all posts

Wednesday, December 04, 2019

GDP update: spending dips and saving soars as we stash rather than spend our tax cuts

Australians saved rather than spent most of the budget tax cuts, almost doubling the proportion of household income saved, leaving spending languishing.

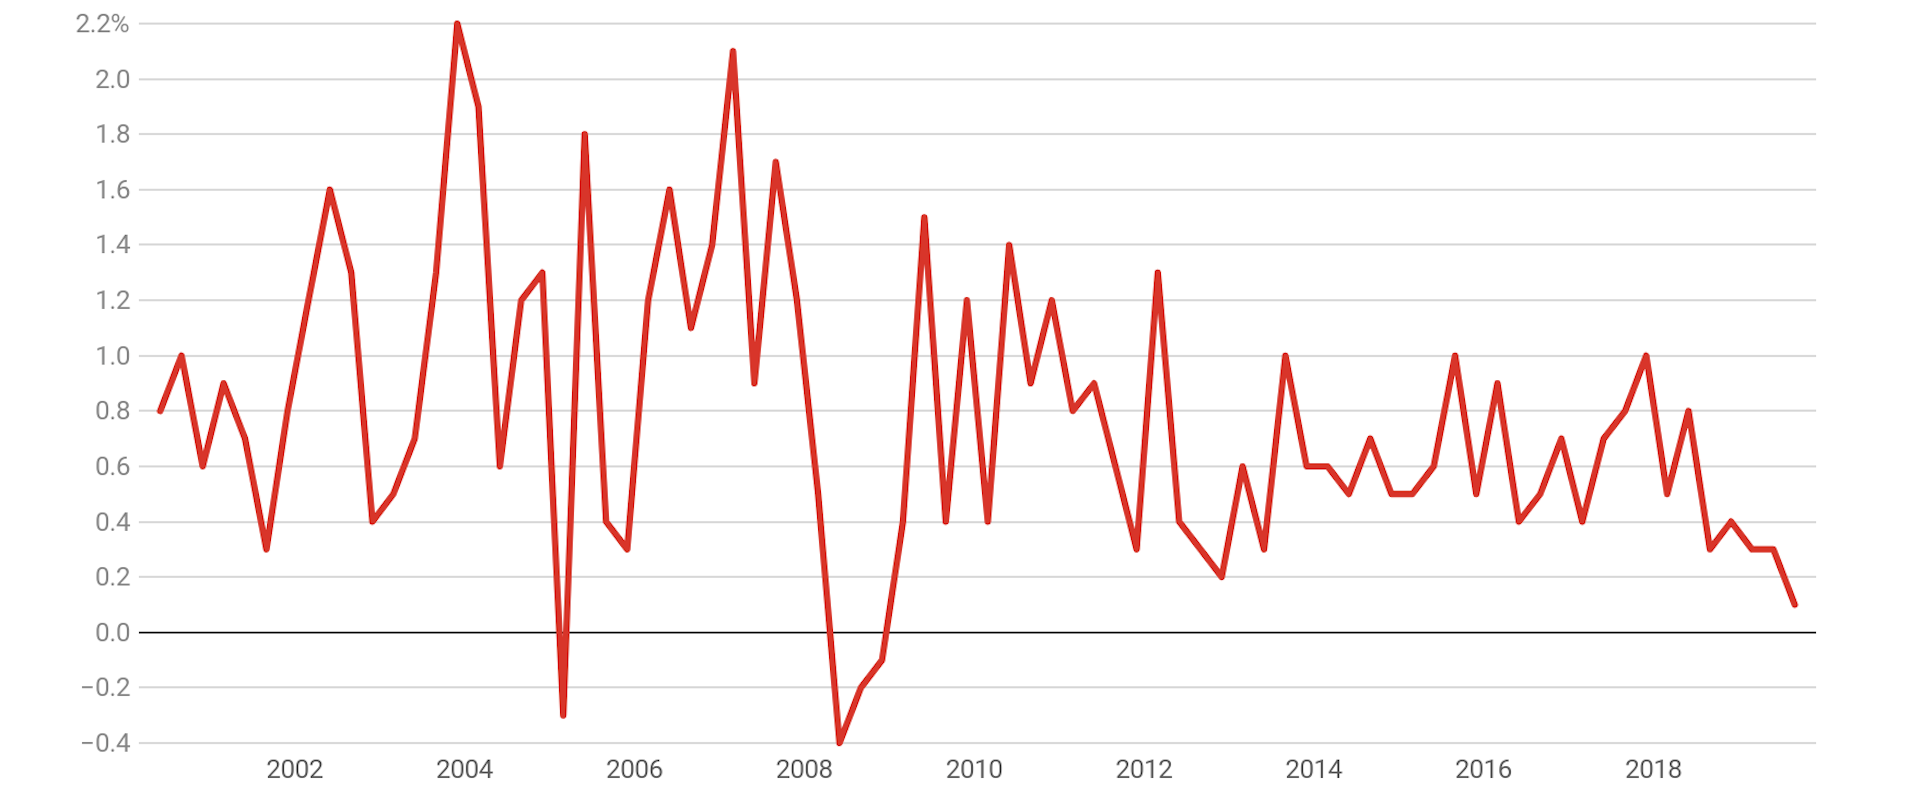
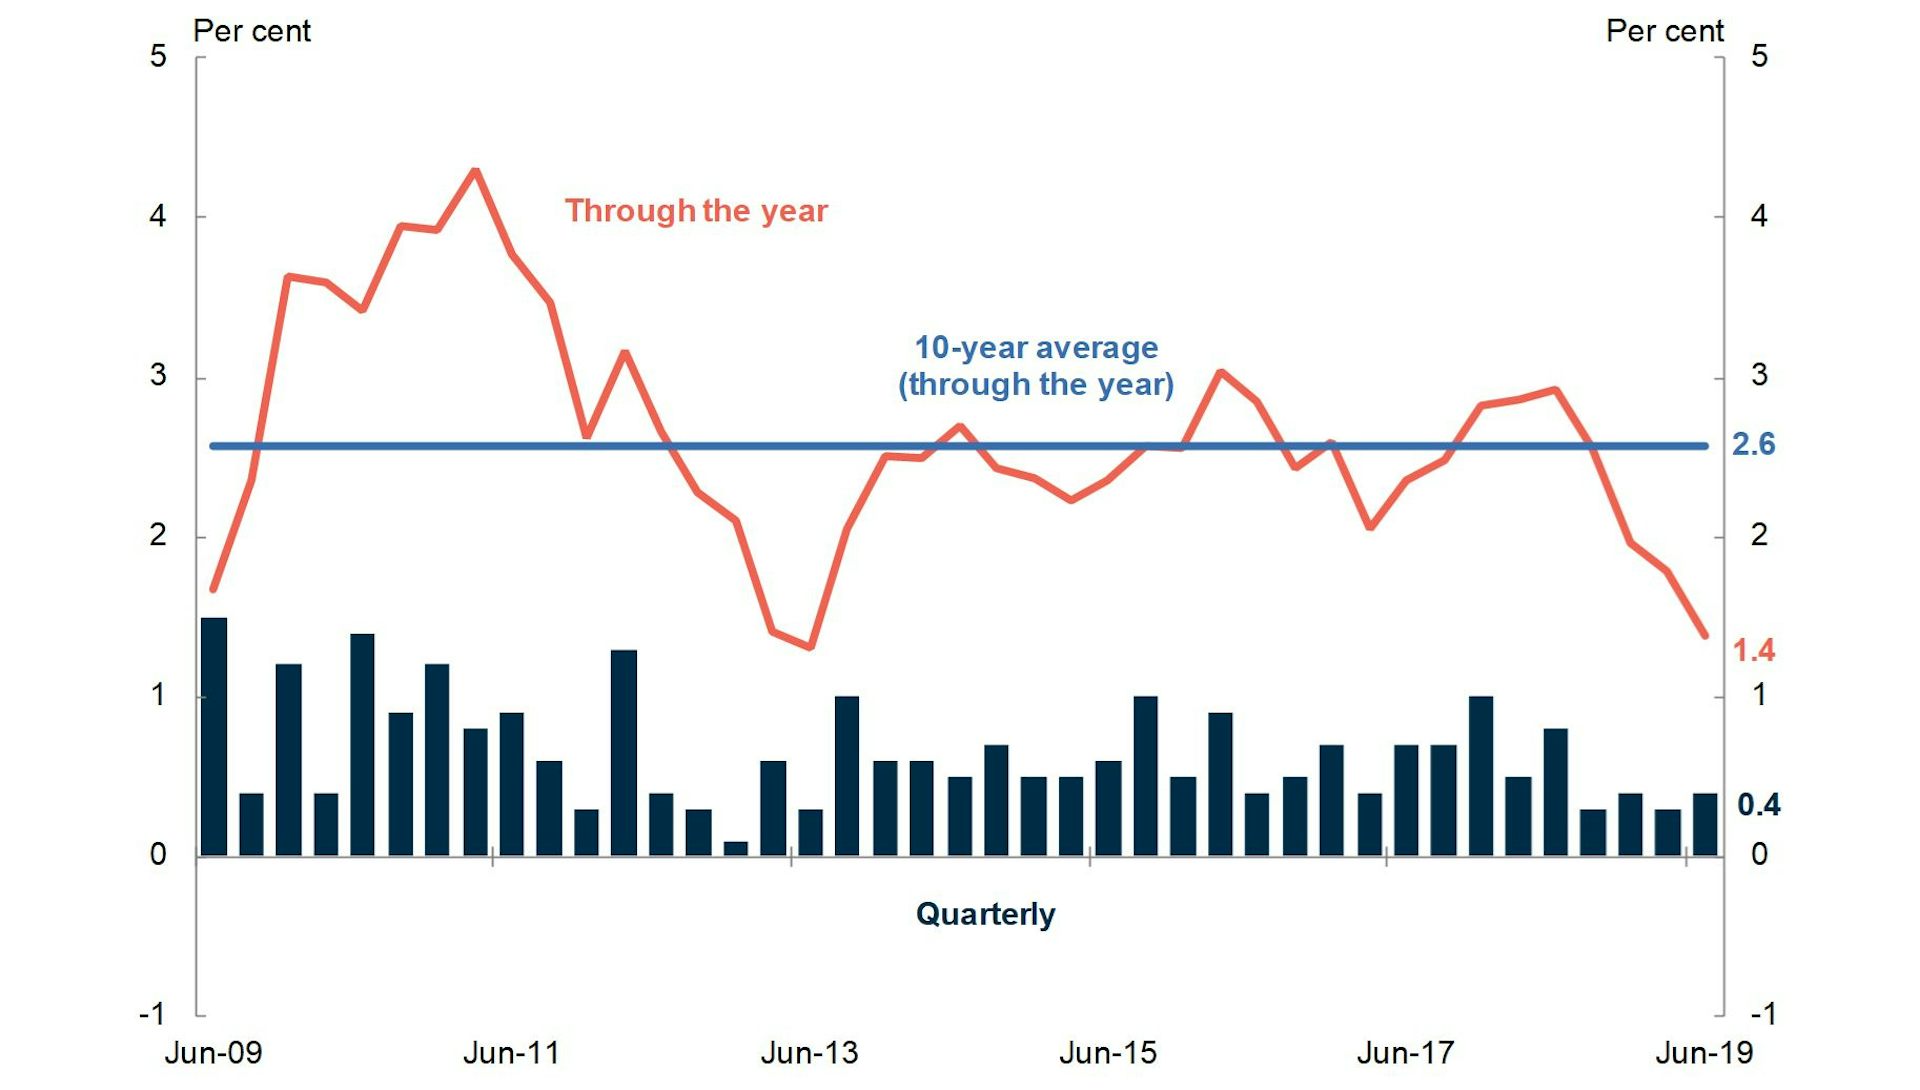
The September quarter national accounts show that in the first three months of the financial year real household spending grew by just 0.1%, the least since the global financial crisis.

Over the year to September, inflation-adjusted spending grew by a mere 1.2%, also the least since the financial crisis. Australia’s population grew by 1.6% in that time, meaning the volume of goods and services bought per person went backwards.


Quarterly growth in household spending

Separate figures released by the Federal Chamber of Automotive Industries on Wednesday show November new car sales were down 9.8% on November 2018.

By the end of November the Tax Office had issued more than 8.8. million tax refunds totalling A$25 billion, 30% more than a year before.

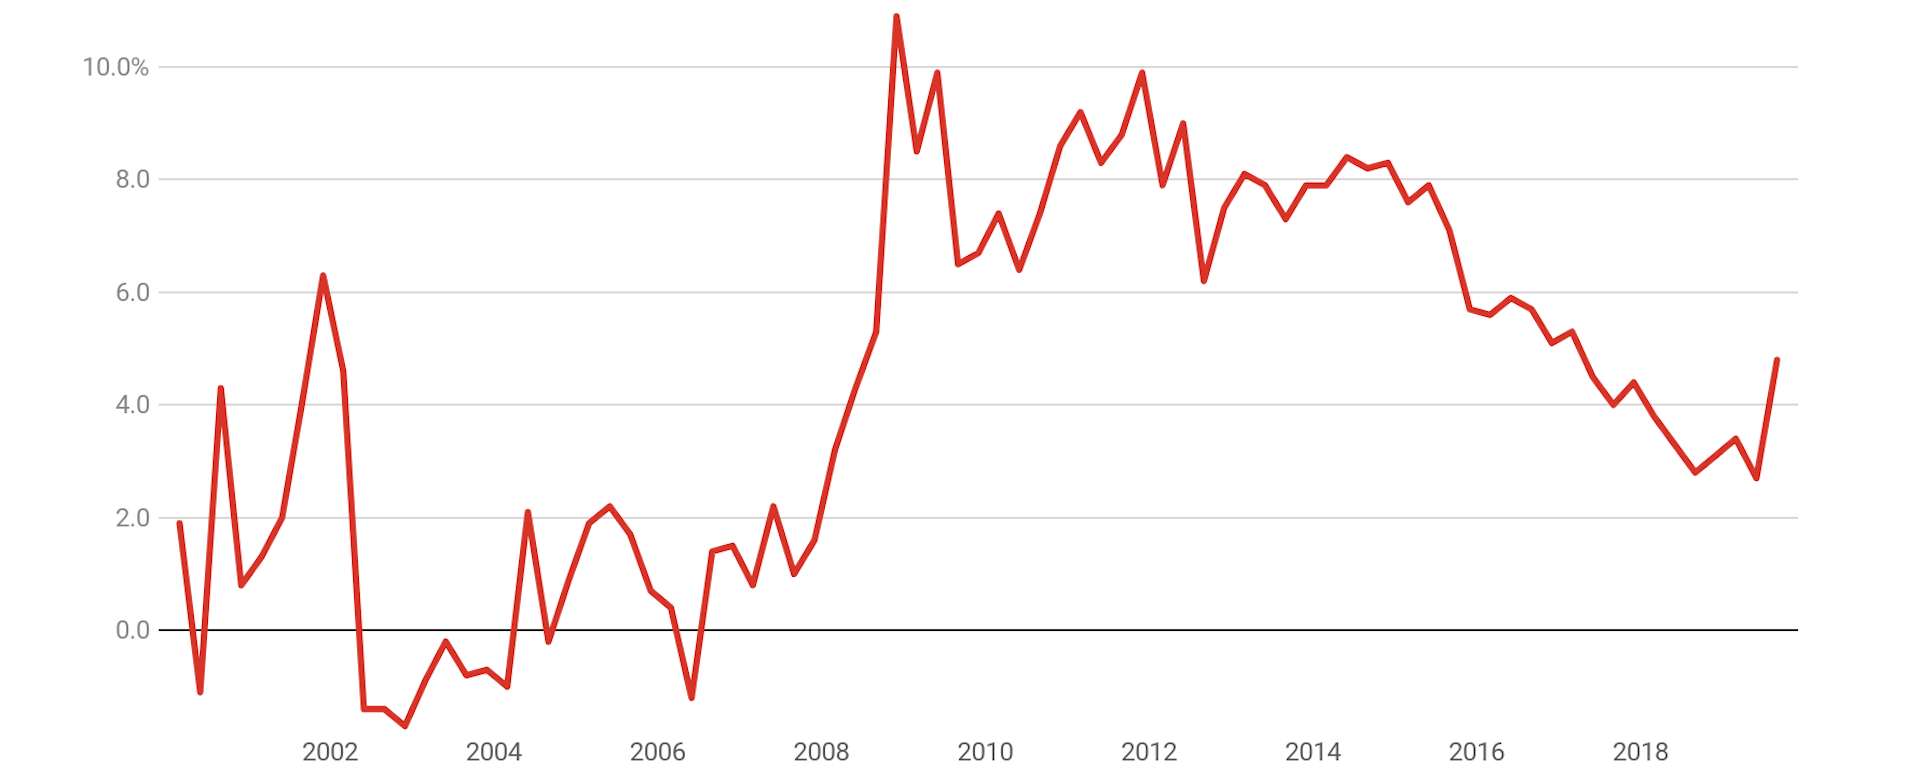
Instead of being largely spent, they were mostly saved, pushing up the household saving ratio from 2.7% to 4.8%, its highest point in more than two years.


Household saving ratio

Treasurer Josh Frydenberg put the best face on the result, saying whether they had been spent or saved, the cuts had put households in a stronger position.

The government’s goal has always been to put more money into the pockets of the Australian people, and it’s their choice as to whether they spend or save that money

Separately calculated retail figures show that in the three months to September the volume of goods and services bought fell 0.1%.

The disposable income households had available to spend grew an outsized 2.5%, driven by what the Bureau of Statistics said were the budget tax cuts.

Growth at GFC lows

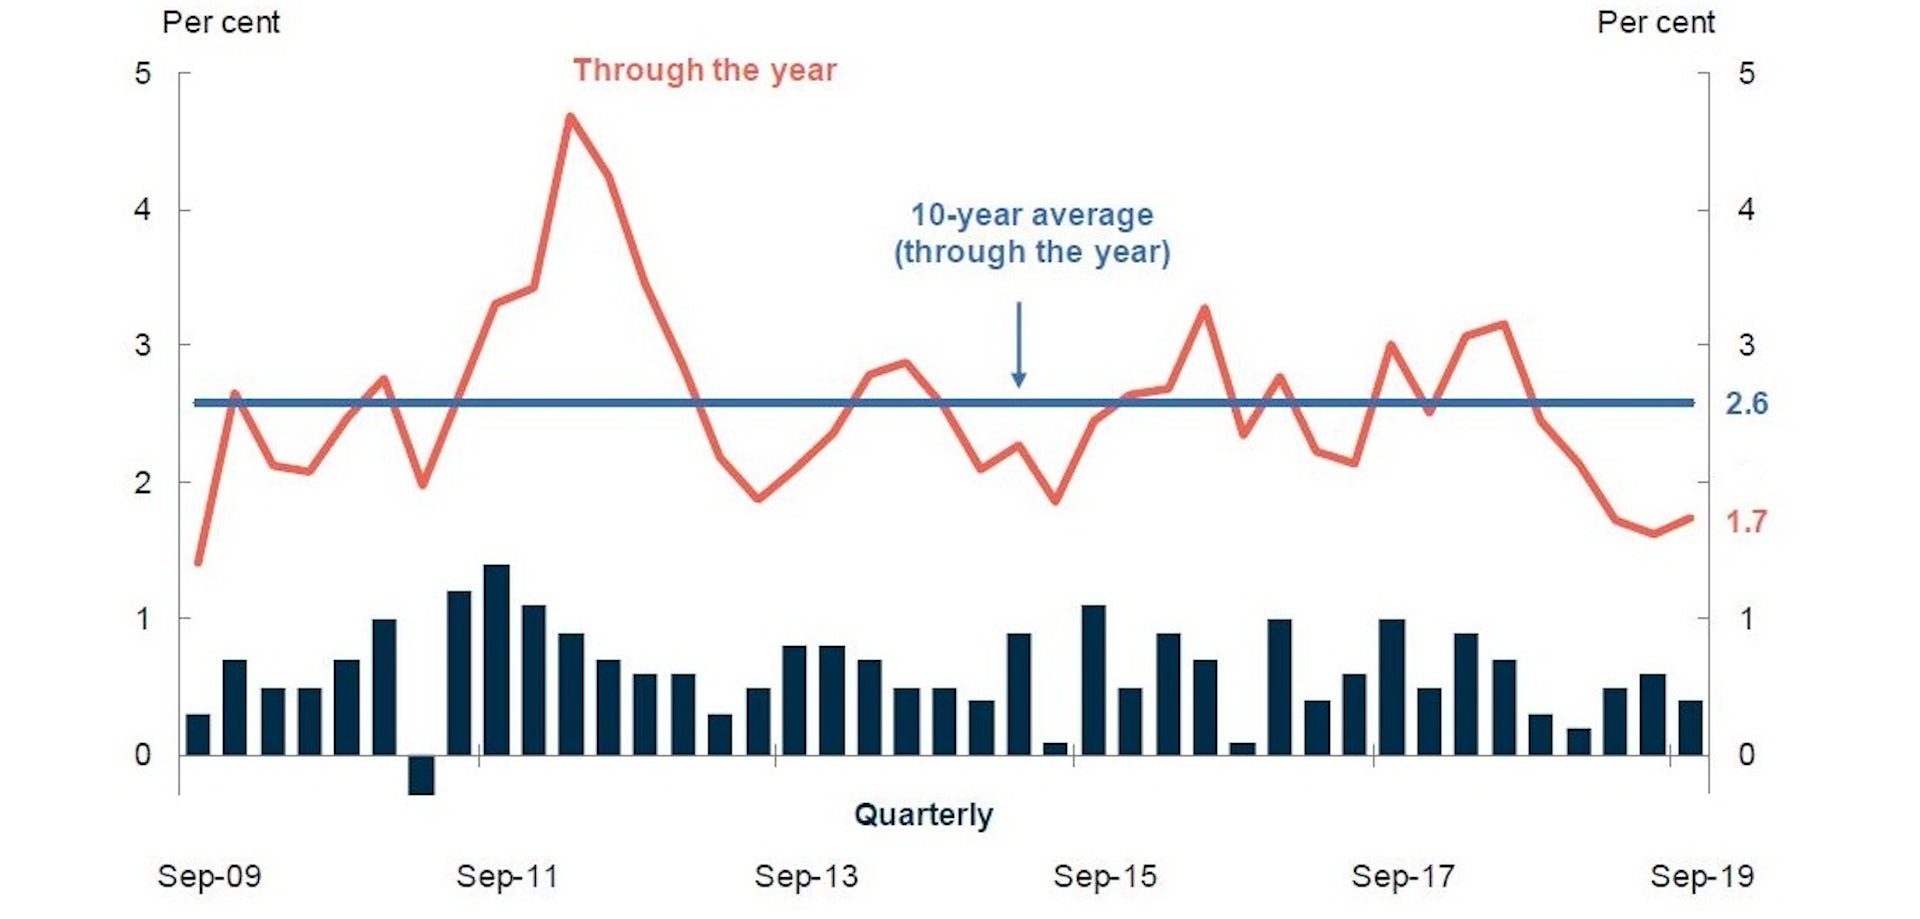
The Australian economy grew just 0.4% in the three months to September, down from 0.6% in the June quarter, and 0.5% in the March quarter.

Over the year to September it grew 1.7%, well short of the budget forecasts, which in year average terms were 2.25% for 2018-19 and 2.75% for 2019-20.


Real GDP growth

After taking account of population growth, GDP per person grew not at all in the September quarter. Over the year to September living standards grew a bare 0.2%.

Gross domestic product per hour worked, which is a measure of productivity, fell 0.2% during the quarter and fell 0.2% over the year.

Company profits were up 2.2% in the quarter and 12.7% over the year. Wage and superannuation payments grew at about half those rates: 1.2% and 5.1%.

Housing investment was down 1.7% over the quarter and 9.6% over the year.

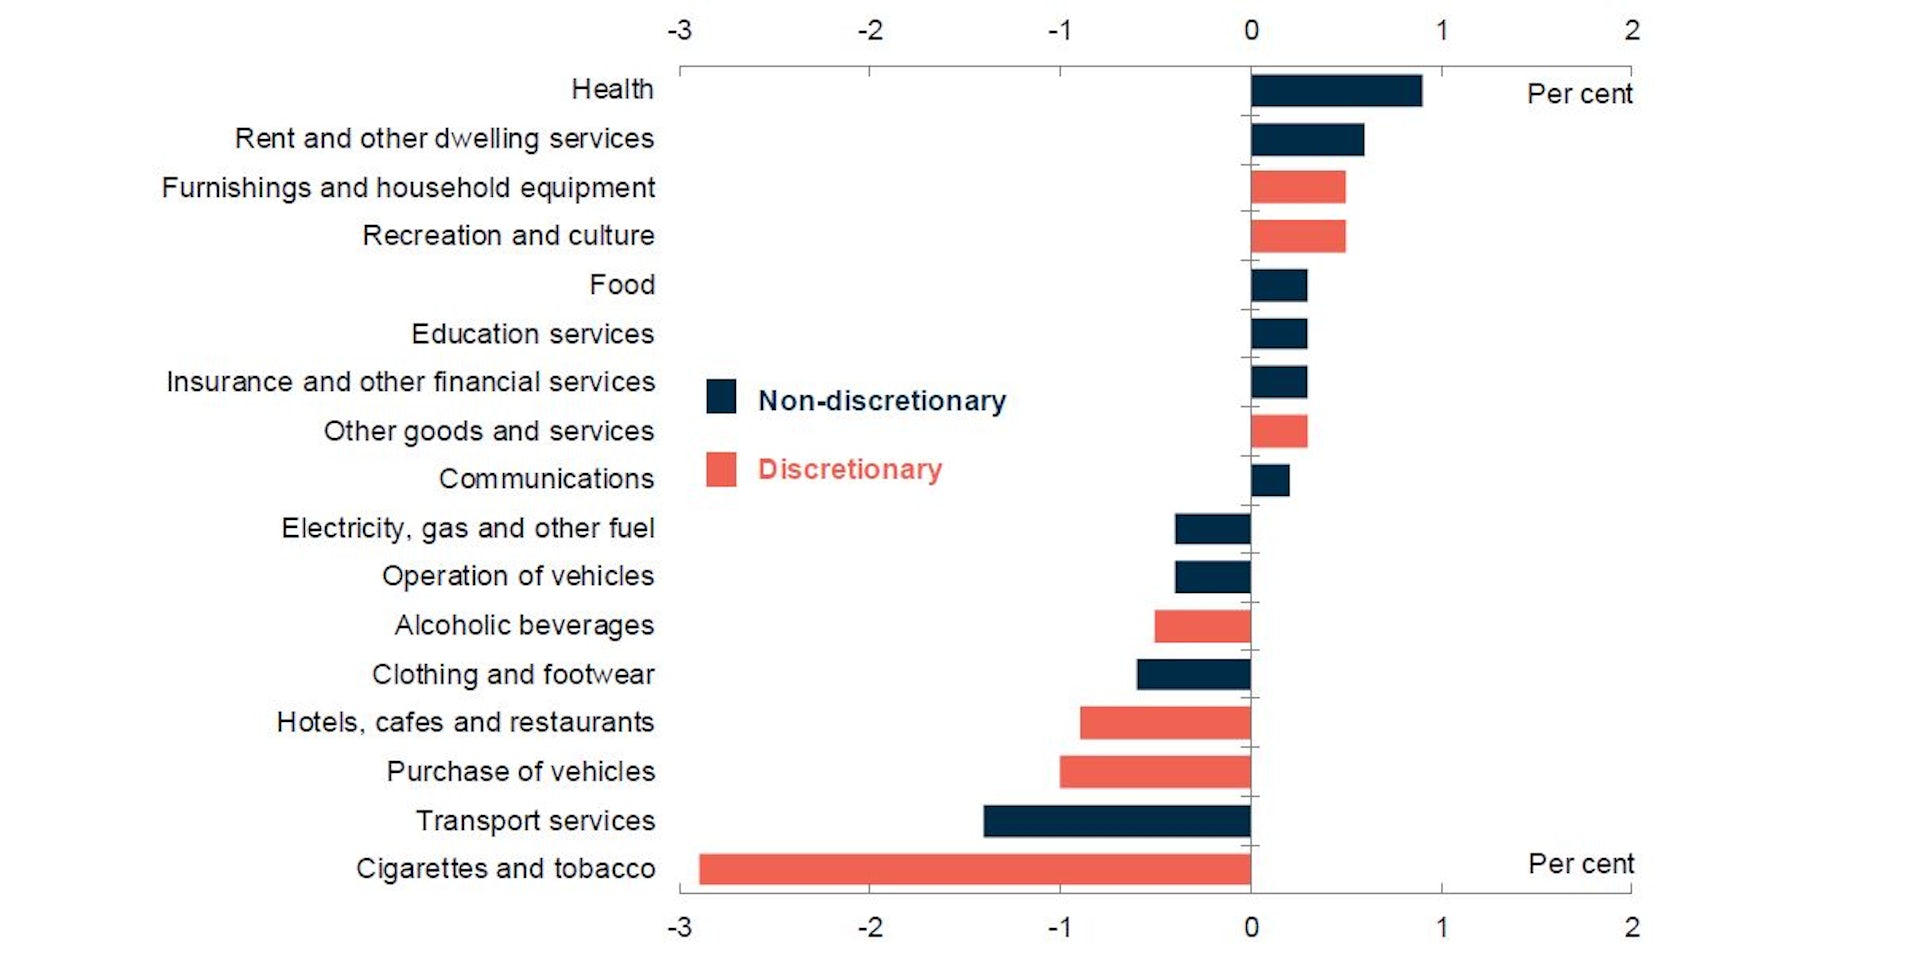
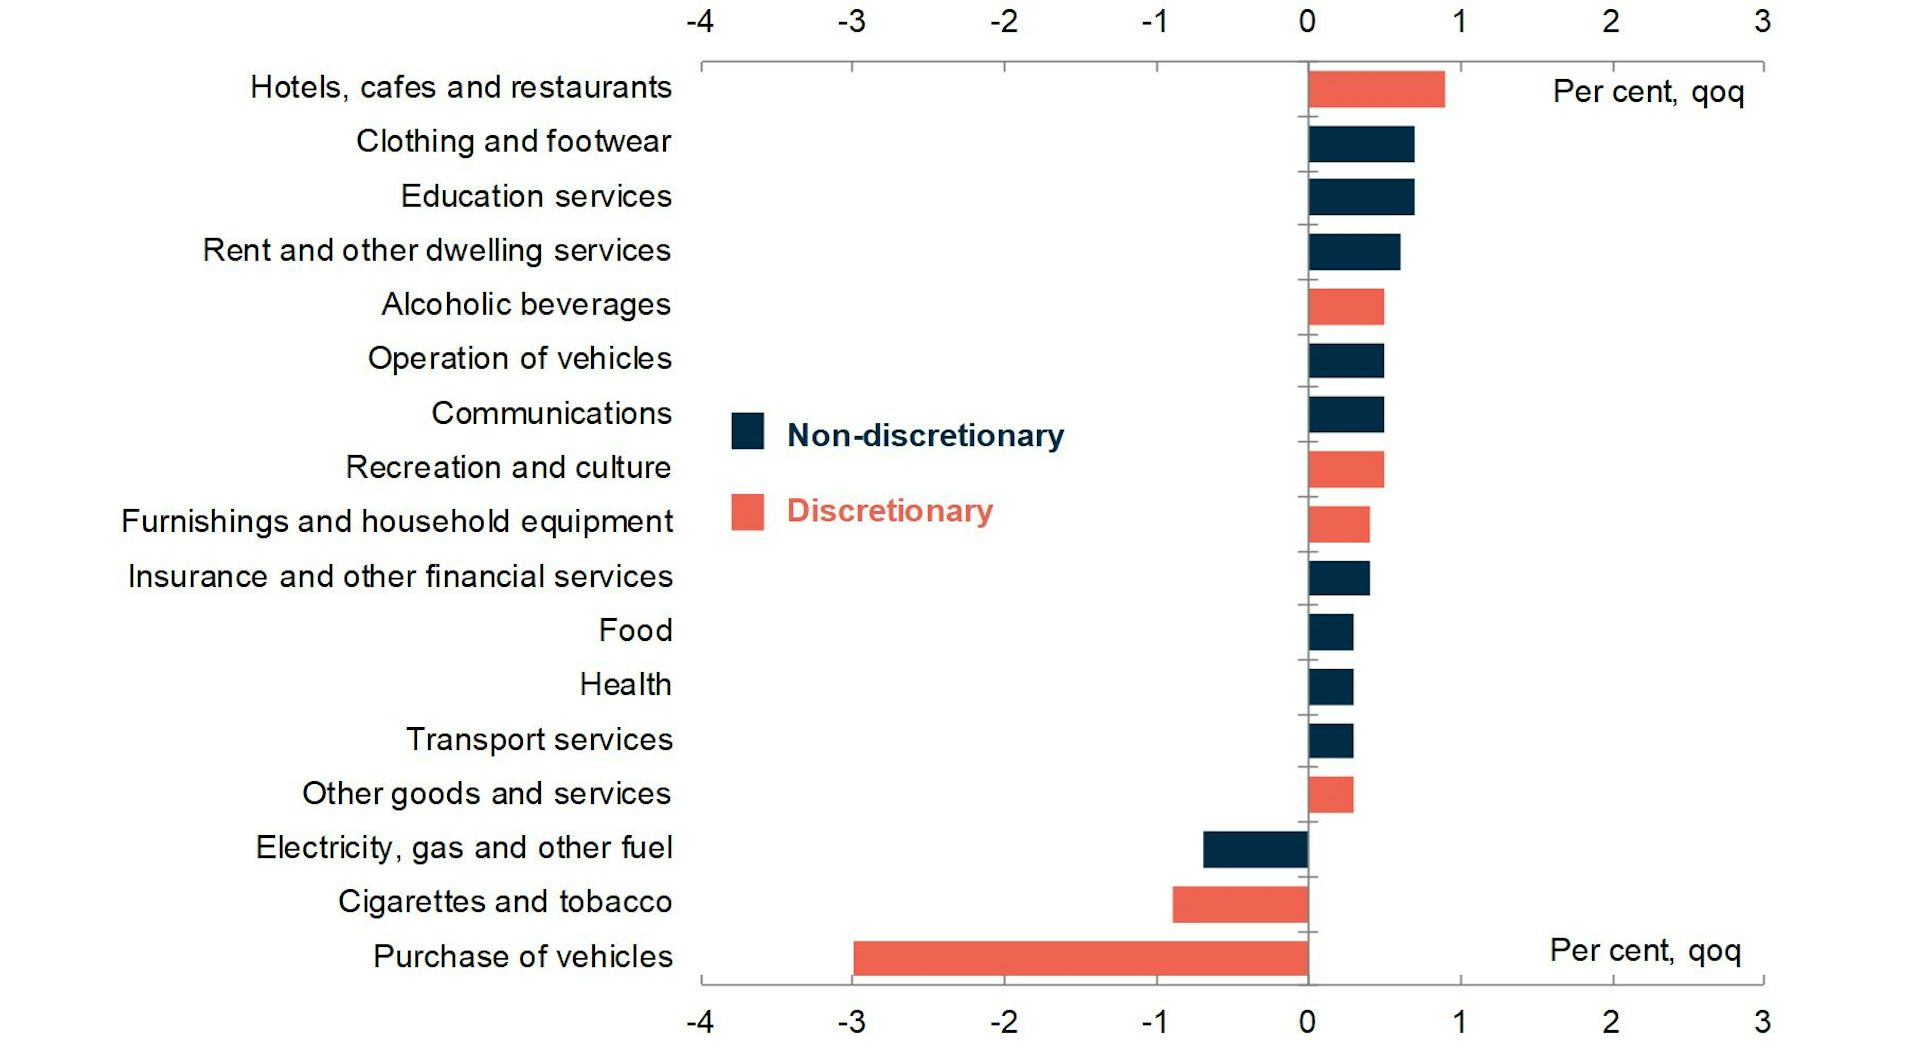
What household spending growth there was was concentrated on essentials, led by health and rent. So-called discretionary or non-essential expenditures fell, led down by spending on cars, dining out and tobacco.


Consumption growth by category, quarterly

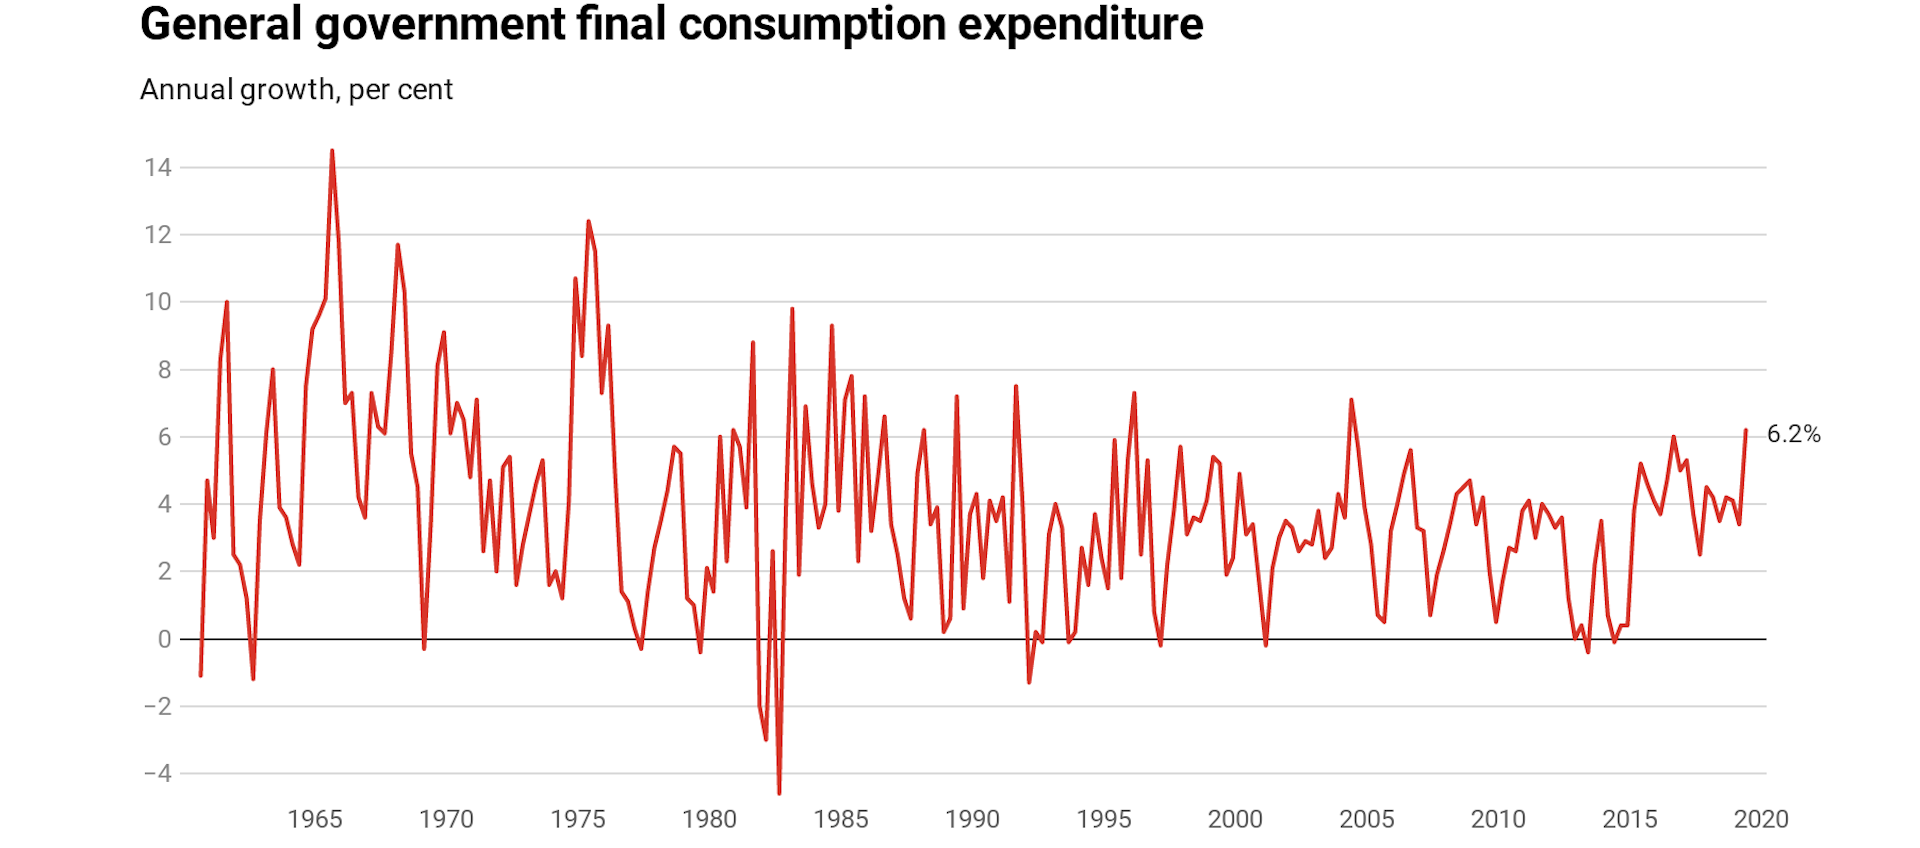
The economy was kept afloat by a surge in government spending. It grew 0.9% in the quarter and 6% over the year. Growth in government spending and investment together accounted for 0.3 of the quarter’s 0.4 points of economic growth.

Government and mining to the rescue

Mining production grew 0.7% over the quarter and 7.4% over the year. A mining-fuelled surge in exports contributed almost as much to economic growth as government spending.

Drought-affected farm production fell 2.1% over the quarter and 6.1% over the year.

Business investment fell 4% in the quarter and 1.7% over the year, led down by a 7.8% fall in mining investment in the quarter and a 11.2% fall over the year, as liquefied natural gas projects came to completion. Non-mining investment fell 0.4%.


Read more: We asked 13 economists how to fix things. All back the RBA governor over the treasurer


Asked whether the December budget update would contain tax measures designed to boost business investment, the treasurer said he was in discussions with business. The update is expected in the week before Christmas.

There’s little evidence in today’s figures of the “gentle turning point” spoken about hopefully by the Reserve Bank governor as recently as Tuesday.

If things don’t pick by the bank’s first board meeting for the year in February, it is a fair bet it will cut its cash rate again. By then it will know what the treasurer did (or didn’t) do in the budget update and whether we decided to spend over Christmas.The Conversation


Peter Martin, Visiting Fellow, Crawford School of Public Policy, Australian National University

This article is republished from The Conversation under a Creative Commons license. Read the original article.

Read more >>

Wednesday, October 23, 2019

If you want to boost the economy, big infrastructure projects won't cut it: new Treasury boss

Treasury secretary Steven Kennedy – in the job for for just weeks after moving across from the department of infrastructure last month – has dismissed talk of spending big on infrastructure in order to escape an economic downturn.

Such calls “sound straightforward, but in practice are difficult to achieve”, he told a Senate hearing on Wednesday.

The timing requirements of fiscal stimulus are hard to give effect to while ensuring large projects are well planned and executed, and cost and capacity pressures are managed. There are some opportunities though, usually related to smaller projects and maintenance expenditure. The Commonwealth and state Governments are currently actively exploring these opportunities.

More broadly he made it plain that it was the role of the Reserve Bank rather than the Treasury to provide economic stimulus.

The bank has already cut its cash rate to a record low of 0.75% and has indicated it is prepared to consider unconventional monetary policy measures that would have the effect of cutting a wider range of rates.


Read more: 0.75% is a record low, but don't think for a second the Reserve Bank has finished cutting the cash rate


However, bank Governor Philip Lowe said last week such tools would be most effective “when used together with a broader set of policies”, including government spending and tax policies.

Without crisis, no need to spend more

Kennedy rejected the idea of extra spending except in an emergency, saying Treasury could best serve Australia’s interests by a “stable and predictable” policy framework that kept the budget near balance over time.

There would be times when a downturn cut revenue and increased spending on support payments, pushing the budget into deficit, but beyond allowing those so-called automatic stabilisers to operate there wasn’t normally a case for doing more.

The exceptions were “periods of crisis”.

“It is important to consider separately broader policy objectives and temporary responses to crisis,” Kennedy said.

“The circumstances or crisis that would warrant temporary fiscal responses are uncommon.”

Although Australia’s economy is not in crisis, Brexit, the US-China trade war and turmoil in Hong Kong have slowed economic and trade growth worldwide, as businesses opt to stay on the sidelines.

No crisis, but weak growth worldwide

In Australia, economic growth had been unusually weak, weighed down by weak household spending which was itself the result of weak income growth, weak house prices, weak housing investment, and weaker than expected non-mining investment.

Mining investment was down sharply, as was to be expected after the completion of several large liquefied natural gas projects.

Given low interest rates, it was “somewhat of a puzzle” that business investment was not growing faster. Partly that might be because the “hurdle rates” businesses use to assess projects have not been adjusted down as they should have been. Partly it might be because of uncertainties surrounding the global economy and technological change.

Structural factors may also be at play — it is not clear what business investment looks like in a world where more than two thirds of our economy is now services based.

The budget tax cuts that flowed into returns from July have not yet led to a “particularly large improvement” in household spending.

Wages, investment “somewhat of a puzzle”

“We will continue to assess the data on consumption as it becomes available, but it is worth noting that even if households initially use the tax cuts to pay down debt faster, this will still bring forward the point at which households could increase their spending,” Dr Kennedy said.

It is possible that spending might have been even weaker without the tax cuts.

Holding back the economy during the year to June has been drought and dry weather which knocked 0.2 percentage points of the economic growth. Holding it up has been larger than normal growth in government spending that contributed 0.2 percentage points more to economic growth than was normal.


Read more: Why we've the weakest economy since the global financial crisis, with few clear ways out


No one had been able come up with a complete explanation for Australia’s unexpectedly low rate of wage growth. One explanation might be that even though the unemployment rate of 5.2% was unusually low, increases in employment were drawing in older workers and women rather than pushing up wages.

Ultimately what was needed to sustain higher wage growth was productivity growth, and that would be difficult to achieve while business investment was weak. The Productivity Commission had come up with a set of recommendations state and federal ministers were working their way through.

Although economic growth has been very low - just 1.4% in the year to June – it grew more strongly in the last half of that year than the first. It might be “strengthening from here”.The Conversation


Peter Martin, Visiting Fellow, Crawford School of Public Policy, Australian National University

This article is republished from The Conversation under a Creative Commons license. Read the original article.

Read more >>

Wednesday, September 04, 2019

GDP. Why we've the weakest economy since the global financial crisis, with few clear ways out

The Australian economy is tepid, with consumer spending the weakest in ten years, business investment shrinking, and economic growth too weak to cover population growth.

Were it not for very strong growth in export income and the biggest surge in government spending in 15 years, the economy would have shrunk.

The Treasury believes the Australian economy is capable of growing at a sustained annual pace of 2.75%. The growth rate in the past financial year of 1.4% reported on Wednesday is only half that.

Not since September 2009 has the gap between what the Australian economy is capable of and what it has been delivering been so wide. 2009 was the year of the global financial crisis.


Real GDP growth


Economic growth has rarely been as low as 1.4% outside of a recession.

When account is taken of population growth, income and production per citizen went backwards. The last time that happened was during the financial crisis. The last time before that was during the early 1990s recession.

Household spending, which accounts for more than half of total spending, also failed to keep pace with population growth. The inflation-adjusted growth rate of 1.4% was also the lowest since the financial crisis.


Growth in household consumption


Other figures released on Tuesday show retail spending dipped a further 0.1% in July.

Hardest hit in the 2018-19 financial year was spending on cars. Updated figures released at the same time as the national accounts show sales of new cars down 10% over the year to August.

Treasurer Josh Frydenberg said he preferred to think that households were delaying rather than abandoning purchases of cars, waiting until the economic outlook was clearer.


Growth in consumption by category


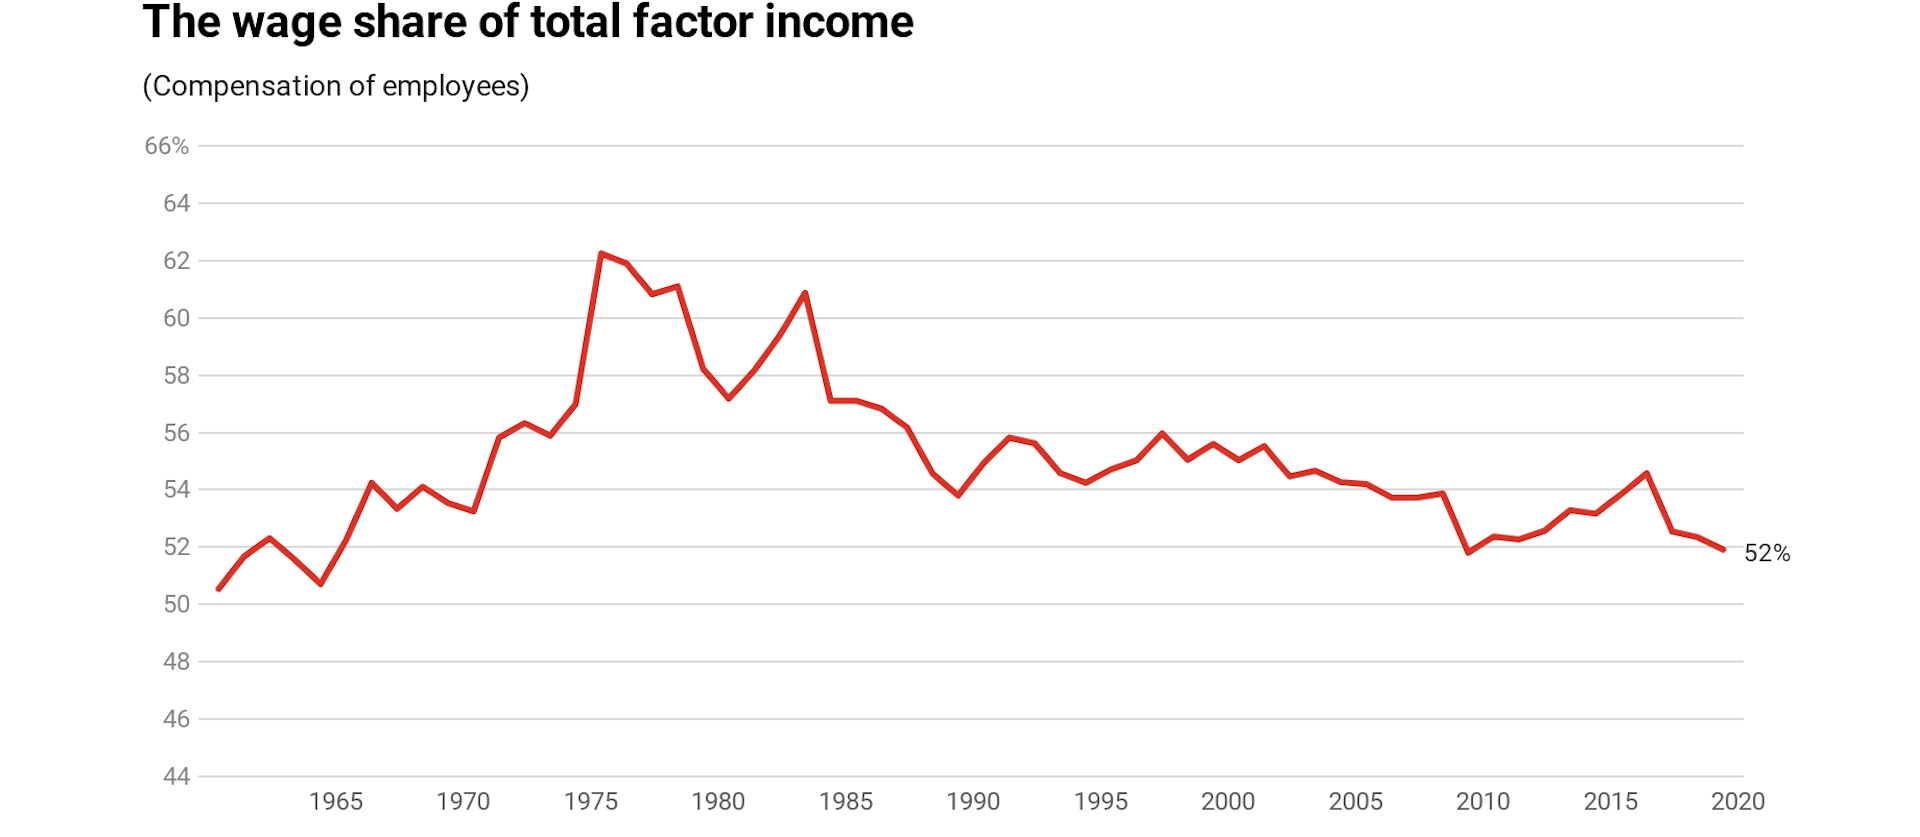
Weighing on consumers is an extended period of unusually low wage growth that the national accounts show has brought the share of national income paid out as wages down to just about its lowest point since 1964.

Although the wage and superannuation bill increased, climbing 5% over the year as employment grew, the share of national income paid out as wages and super fell to 52% – the lowest since the global financial crisis, and before that the lowest since the Beatles toured Australia and Donald Horne published The Lucky Country.


Also weighing on consumers has been housing. Investment in housing (including alterations and additions) was down 9.1% over the year. Business investment fell 10%.

Company profits grew 12.8%, but leaving aside mining companies, whose profits grew strongly on the back of higher prices and export volumes, other profits grew only weakly, climbing 1.8%.

Mining income pushed up nominal GDP (the raw dollars unadjusted for prices that drive nominal incomes) up a healthy 5.4%, probably delivering the government a budget surplus one year earlier than promised, in 2018-19. Frydenberg said he already knew the result and would unveil it in a fortnight. His smiles suggested it’s one he likes.


Nominal GDP growth


Mining income also pushed up what the Reserve Bank regards as the best measure of actual living standards, which (perhaps surprisingly) is not GDP per capita, which is going backwards, but a lesser known and purpose-designed measure known as “real net disposable income per capita”. It grew a healthy 2.65% over the year and a very healthy 1% over the quarter.

It is true that much of it was paid out in mining profits, but it is also true that it isn’t necessarily right to latch on to the cruder measure of GDP per capita and say that living standards are going backwards.

Helping maintain living standards was a very healthy growth in government spending, the highest for some time – not government infrastructure spending, that actually fell over the year as some state projects wound up, but day-to-day spending on things such as the National Disability Insurance Scheme.


Oddly, because of the way the national accounts work, economic growth was also helped by a slump in imports, down 2.8% over the year due largely to a slump in imports of consumer goods.

The economy is in a bad way. Aside from mining and government spending, the only real bright spot is employment growth, and as the Reserve Bank often points out, employment growth doesn’t tell us much about what’s going to happen.

It tends to lag everything else in the economy, by up to nine months. By the time it turns down, other things already have.

Few clear ways out

Frydenberg doesn’t seem too worried. For now he is banking on the tax cuts and the interest rate cuts in June and July to lift investment and spending.

The treasurer has two Plan Bs. One is an aggressive investment allowance for business. He spoke about introducing one last week, but on Wednesday he indicated that he wasn’t planning to do so until next year’s May budget. If needed, he could bring the date forward.

The other is another Reserve Bank rate cut, most likely at the board’s meeting on Melbourne Cup Day, by which time it will have before it an updated set of inflation figures.


Read more: 'Back yourself' Treasurer Frydenberg tells business. But it's not that simple


Frydenberg revealed on Wednesday that he is taking a close look at the government’s contract with the Reserve Bank, a formal written agreement which is renewed after each election.

He has asked the Treasury to look at it to see whether it needs to be tightened to make the bank more responsive to the state of the economy. This would mean more boldly cutting or pushing up rates.

In Britain, if inflation is 1 percentage point above or below the Bank of England’s target, it has to write to the government to explain why.The Conversation


Peter Martin, Visiting Fellow, Crawford School of Public Policy, Australian National University

This article is republished from The Conversation under a Creative Commons license. Read the original article.

Read more >>

Tuesday, September 03, 2019

After 44 years of deficits, we've a current account surplus. What went so right?

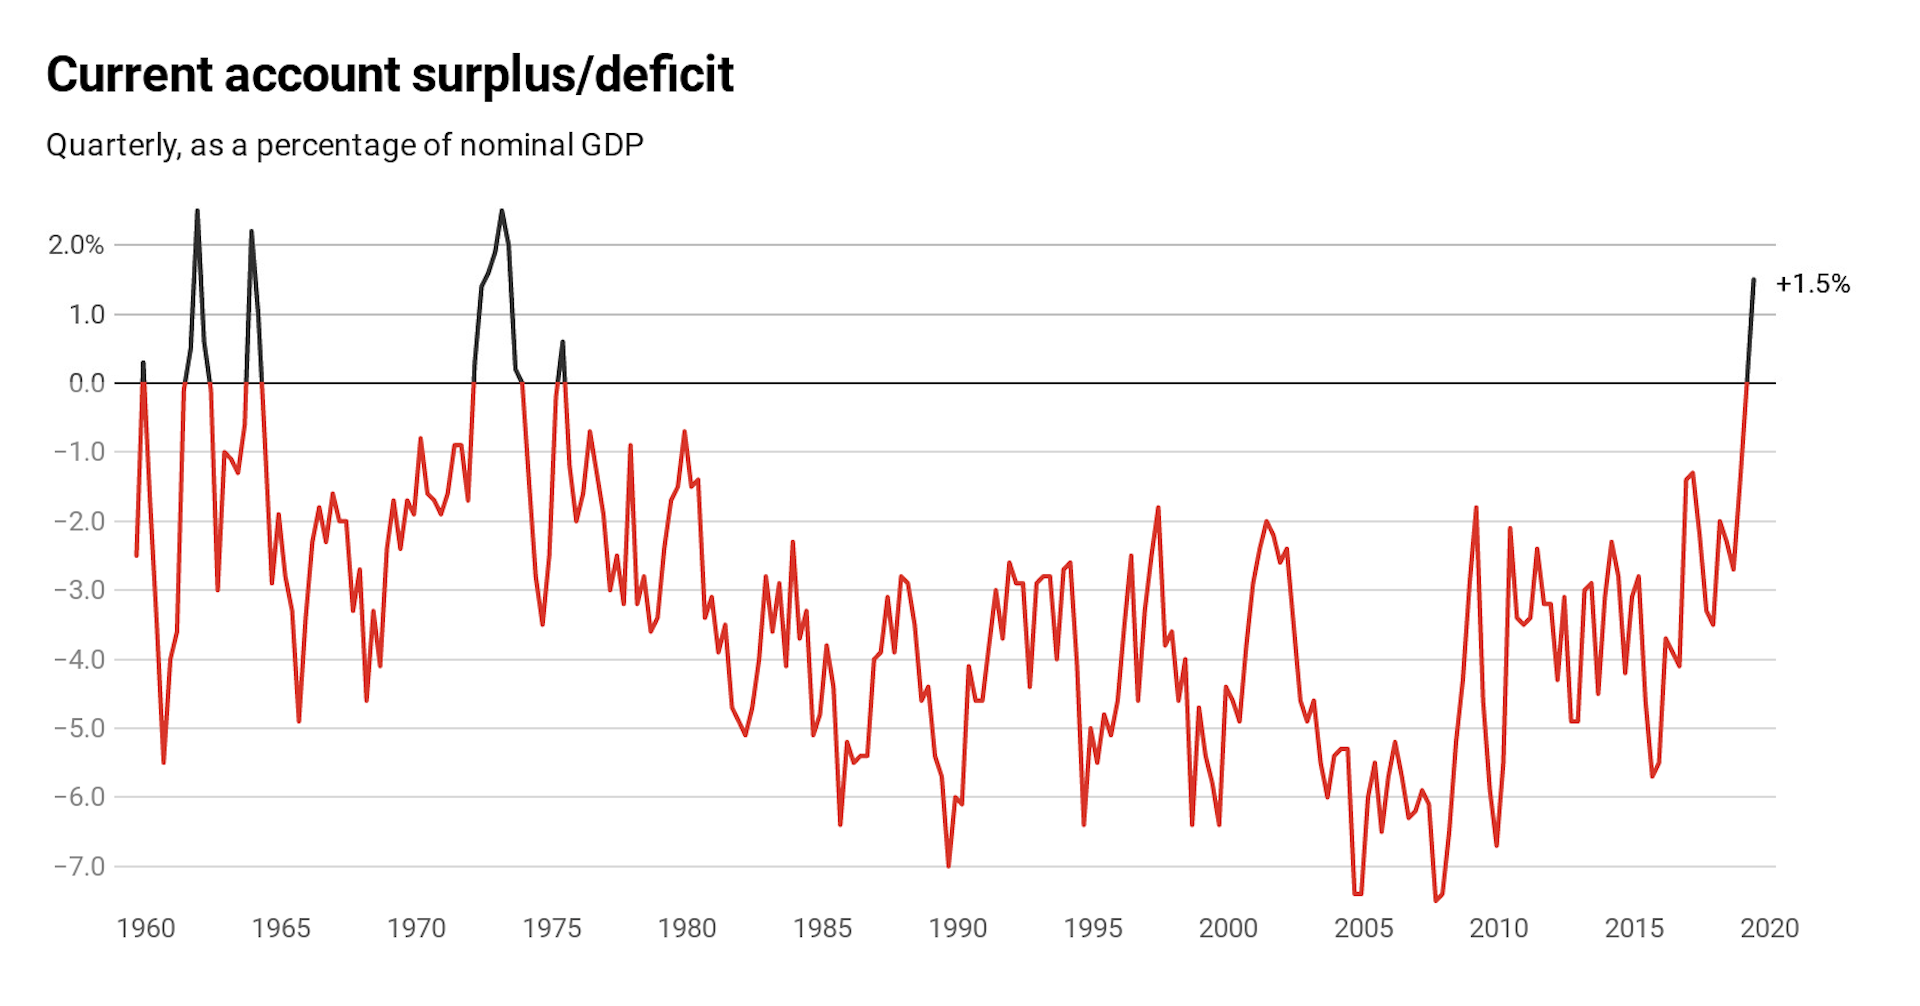
Australia has been in a current account deficit – paying more money out to the rest of the world than it took in – for 44 straight years, since September 1975.

Until today. The update from the Bureau of Statistics released on Tuesday shows that in the three months to June Australia actually took in more from the rest of the world than it paid out: A$5.9 billion more, after what for most Australians (most are under the age of 40) was a lifetime of paying out more.


Why has it happened, and how did we get away with doing the opposite for so long?

First, the long-term story. It couldn’t happen to an individual. No one person can get away with taking more in from the rest of the world than they pay out for long.

It was the idea that a nation is like an individual that allowed the then treasurer Paul Keating to spend a good deal of the 1980s arguing that Australia was living beyond its means.

As the drumbeat of a steadily growing current account deficit grew louder and it approached 5-6% of GDP, on May 14, 1986, he infamously told radio presenter John Laws that Australia was in danger of becoming a banana republic:

I get the very clear feeling that we must let Australians know truthfully, honestly, earnestly, just what sort of international hole Australia is in. It’s the prices of our commodities — they are as bad in real terms (as) since the Depression.

If this government cannot get the adjustment, get manufacturing going again, and keep moderate wage outcomes and a sensible economic policy, then Australia is basically done for. We will just end up being a third-rate economy … a banana republic.

To get spending down, and thus reduce the current account deficit, he tightened the budget and encouraged the Reserve Bank to push interest rates to stratospheric levels. The cash rate hit 18% before helping push Australia into recession .

And for what? The current account deficit continued. It averaged 4% of GDP throughout the 1990s and 2000s. But life went on. The economy recovered, the Bureau of Statistics stopped publishing monthly current account figures (moving to quarterly), the figures became little watched and the pundits and politicians turned their attention elsewhere.


Read more: Cabinet papers 1990-91: lessons from the recession we didn’t have to have


With the benefit of hindsight it is clear that the deficits weren’t because of any deficiency on the part of Australians. Reserve Bank deputy governor Guy Debelle explained last week that Australians weren’t spending an unusual amount compared to what they earned. They were “about on par with many other advanced economies”.

The current account deficits were largely the result of money flowing out as returns on investments in Australia. Australia had “a lot of profitable investment opportunities”. Foreigners either lent to Australian businesses or invested in Australian businesses and returns flowed out each month, as they should have.

It came to be known as the “consenting adults” theory of international finance. It’s practical message was: “nothing to see here, move along”.

So what’s changed?

In 2017 and 2018 the current account deficit shrank to around 2% of GDP. We now know that in the three months to June this year it moved into surplus.

Much of it is because we’ve been earning more from mining exports. We’re both exporting more tonnes and getting paid more for each one.

And just lately mining has helped in another way. The so-called mining investment boom is winding up. We are no longer importing enormously expensive machines to build gas terminals and the like.

And it’s more than mining. Export income from services such as education and tourism now accounts for 21% of all exports, up from 17% in the 1980s. Purists will complain that education and tourism aren’t actually exported, but as far as the national accounts are concerned, they are. Even though the teaching and hospitality takes place in Australia, it is paid for in foreign dollars that bring more money into the country relative to what is going out.

And there’s something else.

We are becoming like the US

As popular as Australia remains as a destination for foreign investment, since 2013 Australians have been investing even more in foreign businesses than foreigners have been investing in Australian businesses.

It is superannuation that’s done it: a record A$2.9 trillion worth.

Debelle put it this way:

This largely reflects the significant allocation to foreign equity by the Australian superannuation industry together with the fact that the superannuation sector is relatively large as a share of the Australian economy.

Australia has become a net foreign investor rather than a net recipient of foreign investment, almost certainly for the first time ever.

Debelle says it has made Australia come to resemble the United States. We receive more in dividends from overseas than we pay out in dividends to overseas share holders.

We’re still a magnet for foreign dollars

We are still a huge destination for foreign lending, increasingly in the form of lending to the Australian government rather than to Australian companies, as safety-conscious foreigners push locals out of the way to buy more and more Australian government bonds.

Foreign ownership of Australian government bonds has climbed from around 40% to 60% since the early 2000s.

The interest rate foreigners are prepared to accept in order to hold Australian 10 year bonds has fallen below 1% (which in its own way assists in keeping the current account deficit low).


Read more: Revisiting the banana republic and other familiar destinations


How long the current account surplus lasts will depend on the investment policies of our super funds (the better the prospects are overseas, the higher the surplus will be), the strength of our economy (the weaker is consumer spending, the higher our current account surplus will be) and export prices and volumes (which are mainly beyond our control).

Yes, we’ve current account surplus. It would have once been a cause for celebration. Now that we’ve got it, it’s not looking that special.The Conversation


Peter Martin, Visiting Fellow, Crawford School of Public Policy, Australian National University

This article is republished from The Conversation under a Creative Commons license. Read the original article.
Read more >>

Friday, August 09, 2019

RBA update: Governor Lowe points to even lower rates

Reserve Bank Governor Philip Lowe has said two things about unemployment in the past few weeks. Together, they lead to an inescapable conclusion.

The first was in a speech in May, expanded on in a speech in June. At both times the published unemployment rate was 5.2%.

Lowe said in May that while the Reserve Bank had long thought an unemployment rate of 5% was the best that could be achieved without generating worrying inflation, that view has now changed:

From today’s perspective, I think we can do better than this. My judgement of the accumulating evidence is that the Australian economy can support an unemployment rate of below 5% without raising inflation concerns.

It was good news. And then it got better.

In June he put a number on how low the unemployment rate could go before inflation became a concern:

While it is not possible to pin the number down exactly, the evidence is consistent with an estimate below 5%, perhaps around 4.5%. Given that the current unemployment rate is 5.2%, this suggests that there is still spare capacity in our labour market.

The Reserve Bank should be able to cut interest rates until unemployment fell below 5% and approached 4.5% without worrying about inflation, Lowe argued.

And in May, in a report back from a board meeting, he made it clear that’s what he would do:

At that meeting, we discussed a scenario in which there was no further improvement in the labour market and the unemployment rate remained around the 5% mark. In this scenario, we judged that inflation was likely to remain low relative to the target and that a decrease in the cash rate would likely be appropriate.

It would likely be appropriate to cut interest rates and keep cutting until the unemployment rate was driven below 5%, continuing to cut until it approached 4.5%.

Today, appearing before the House of Representatives economics committee in Canberra with the unemployment rate still stuck at 5.2% despite two consecutive rate cuts, he delivered what on the face of it was bad news.

He said the bank’s central forecast was that the unemployment rate would stay above 5% again until 2021. That’s right, 2021.

But taking the two statements together, it is reasonable to conclude that the Reserve Bank will keep cutting rates until unemployment does fall below 5%. In other words, it will keep cutting rates until 2021.

Lowe ain’t done cutting…

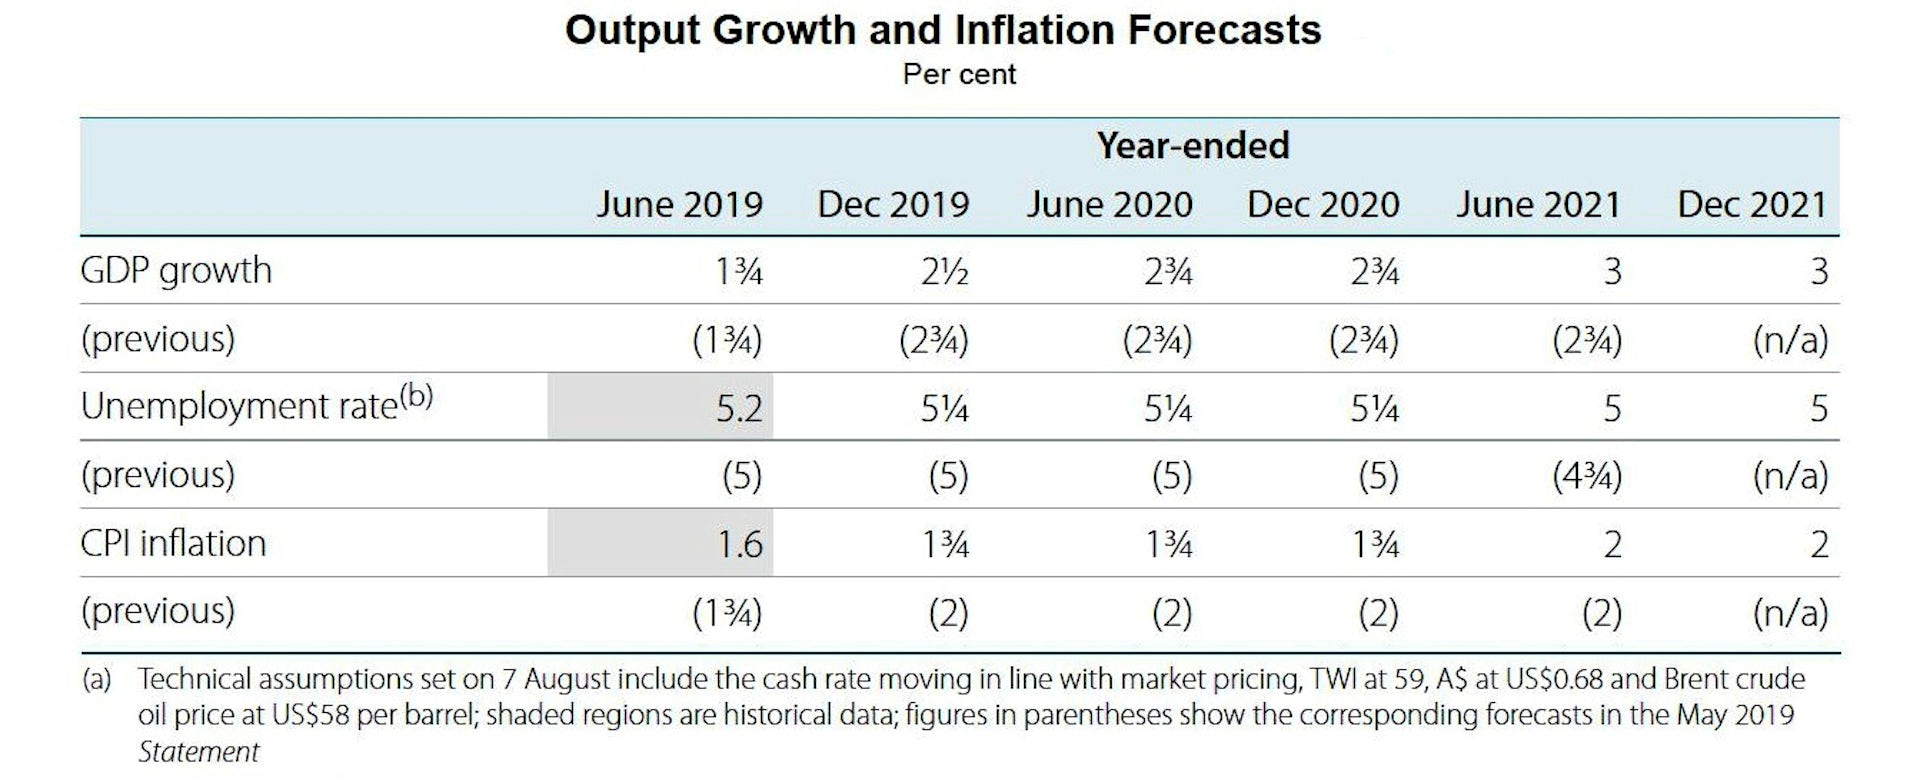
Indeed, the Reserve Bank’s quarterly forecasts update, released as Lowe spoke, countenances that happening. As foreshadowed by the governor, it forecasts that the unemployment rate won’t fall back to 5% until June 2021.

And it contains several other unwelcome forecasts: economic growth of just 2.5% this year, down from a previously forecast 2.75%, and very weak inflation this year of just 1.75%, down from a previously forecast 2%.


But here’s the thing. All of those forecasts were compiled, as is the Reserve Bank’s custom, by taking into account not only the two interest rate cuts that have already happened (and have taken the bank’s cash rate down to an all-time low of 1%), but also two more yet to be delivered.

It is explained in the footnote:

Technical assumptions set on 7 August include the cash rate moving in line with market pricing.

The “market pricing” is the consensus of the bets placed on the futures market for what the Reserve Bank is going to do to its cash rate.

The consensus is for another cut of 0.25% in October and then another cut of 0.25% in February, taking the cash rate down to yet another all-time low of just 0.5%.


The Reserve Bank is normally at pains to point out that this is a mere technical assumption, not a guarantee of how it will move rates. But the awful truth is that its forecasts imply that unless it cut rates two more times in coming months, unemployment won’t fall to 5% by 2021, and inflation will be even weaker than the incredibly weak 1.75% it is forecasting.

…and he might not stop at zero

Two more cuts in its cash rate will take it to 0.5%, close to zero.

Lowe revealed that the Reserve Bank is investigating so-called “unconventional” monetary policy or quantitative easing that would have the same effect as taking the cash rate below zero.

“It is prudent for us to have done the work in advance to see what we would do – it’s really contingency planning,” he said.

Rates might go to zero, or below, worldwide because right now there is a worldwide glut of savings, and not enough investment.

The reality we face is that, if a lot of people want to save and not many people want to use those savings to build new capital, savers are going to get low returns. We can move our interest rates around this new structurally lower level,but we can’t escape the fact that global interest rates are low.

The Reserve Bank’s best case is that its Australian forecasts are wrong - that unemployment actually falls and that inflation, wage growth and economic growth climb.

There’s a respectable view within the bank that this might happen. Its forecasts take into account a range of positive influences, including lower interest rates, the recent tax cuts, the depreciation of the Australian dollar, a brighter outlook for investment in the resources sector, some stabilisation in the housing market, and ongoing high levels of investment in infrastructure.


Read more: Below zero is ‘reverse’. How the Reserve Bank would make quantitative easing work


But they are the result of a mechanical model that takes them into account individually. The governor’s hope is that, taken together, they will achieve more than is forecast.

He would like governments themselves to push things along, starting with the wages they pay their own employees, and he is becoming ever more bold about saying so:

Most public sectors have wage caps of 2.5%, some have 1.5%, I think in Western Australia it’s probably even lower. I can understand why governments are doing that. On the other hand, the wage caps in the public sector are cementing low wage norms across the country. Over time, I hope the whole system, including the public sector, could see wages rising at three point something.

He is as good as powerless to stop what he regards as a worldwide investment strike caused by the trade and technology disputes between the United States and China.

These disputes pose a significant risk to the global economy. Not only are they disrupting trade flows, but they are also generating considerable uncertainty for many businesses around the world. Worryingly, this uncertainty is leading to investment plans being postponed or reconsidered.

Lowe doesn’t believe further interest rate cuts would to do much to encourage businesses to invest, or to encourage home buyers to borrow.

But he is certain they will help in other ways.

They will lower the exchange rate, making Australian goods and services more competitive, and that they will free up the cash of Australians who already have home loans, what he calls the “cash flow” channel:

There is no evidence that has become less effective. It is certainly true that in the current environment, at least in my view, monetary policy is less effective than it used to be. In today’s environment people don’t run off to the bank to borrow more when interest rates fall; they are more likely to pay back their mortgage more quickly. So that dynamic is different than it used to be.

When he last appeared before the parliamentary committee in February he said the probabilities of rates going up and rates going down were evenly balanced. He didn’t say that today.


Read more: Buckle up. 2019-20 survey finds the economy weak and heading down, and that's ahead of surprises The Conversation


Peter Martin, Visiting Fellow, Crawford School of Public Policy, Australian National University

This article is republished from The Conversation under a Creative Commons license. Read the original article.
Read more >>

Tuesday, July 30, 2019

There's a reason you're feeling no better off than 10 years ago. Here's what HILDA says about well-being

During the election campaign then-opposition leader Bill Shorten repeatedly claimed that everything was going up.

“Childcare is up 28%, out of pockets to see the doctor up 20%, specialists … up nearly 40%,” he said. And then the punchline: “everything is going up, except your wages.”

Statistically, it wasn’t true. The official rate of inflation was just 1.3%. The official rate of wage growth was 2.3%.

I haven’t asked him, but I wouldn’t be surprised if he kept saying it because his focus groups told him that’s what people felt.

Today’s release of the 17th wave of Australia’s Household, Income and Labour Dynamics Survey (HILDA) tells us that despite the official statistics, people were right to feel they were going backwards.

Funded by the Australian government and managed by the Melbourne Institute of Applied Economic and Social Research, HILDA is one of the most valuable tools Australian social researchers have.

It examined the lives of 14,000 Australians in 2001 and then kept coming back to them each year to discover what had changed. By surveying their children as well, and in future surveying their children, it will be able to build up a long-term picture of how circumstances change over the course of lives and generations.

It can be thought of as Australia’s Seven Up!, the British TV series that keeps going back for updates on the lives of 14 children it first examined when they were seven. Except that HILDA’s results have statistical significance, and the questions are detailed, asking among other things about depression and anxiety, work-life stress, stress in relationships, and illicit drug use.

We are right to feel no better off…

The Australian Bureau of Statistics does indeed find that wages are climbing faster than prices, as they almost always have, but because it doesn’t examine what happens to a particular household over time it can tell us little about whether an individual’s experience of things is getting better or getting worse.

HILDA gets a handle on each household’s disposable income by asking each member of the household about their gross income from wages, benefits, investments and other sources and then deducting its estimate of taxes. It gets a handle on the real (inflation-adjusted) changes by adjusting its totals for changes in the consumer price index.

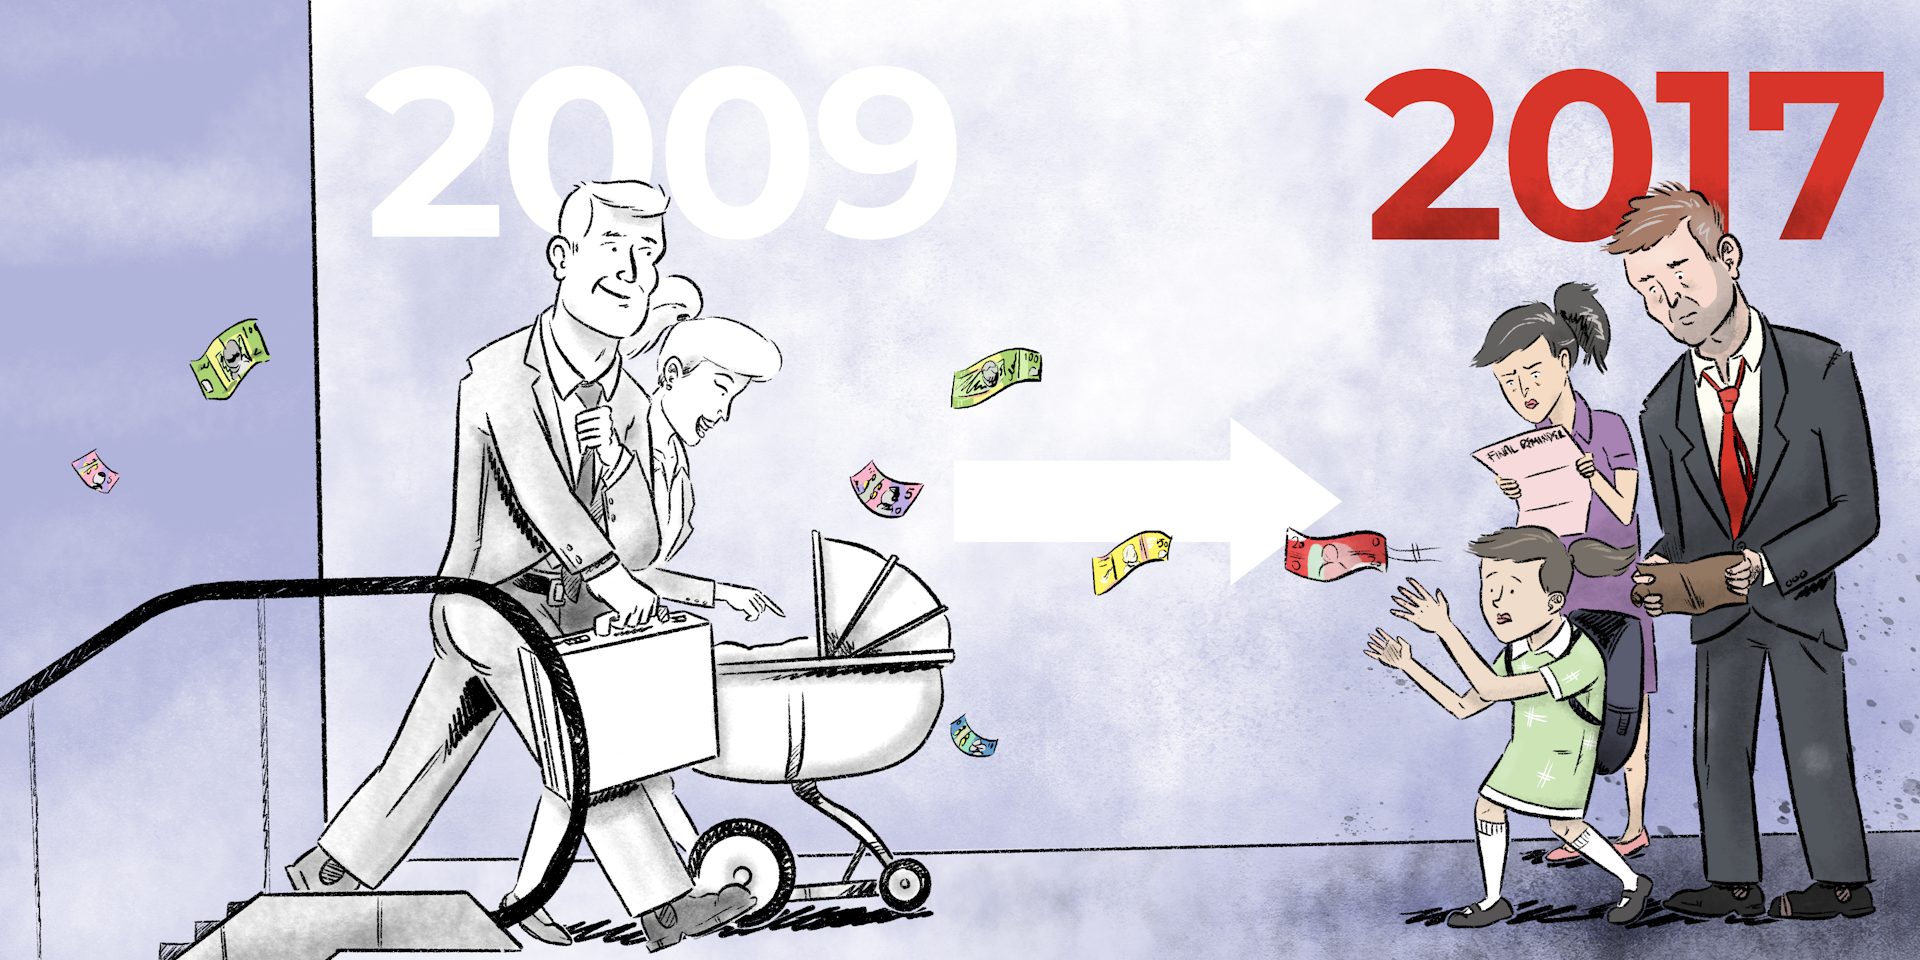
It finds that for the thousands of households it interviewed, real disposable income grew strongly during the first nine years of the survey, between 2001 and 2009. Then, after the global financial crisis, for the eight years between 2009 and the 2017 results released today, that growth stalled.


Expressed in today’s dollars, the average annual real disposable income of those households climbed by A$19,773 between 2001 and 2009, about $2,472 per year.

But most of the growth was during the mining boom that stretched from 2003 to 2009 when the average annual real disposable household income climbed about $3,000 per year, as did the income of the more representative median (or middle) household.

Since 2009 and the global financial crisis, the average and the median have moved in different directions.

The average houshold’s annual real disposable income has climbed a further $3,156. The median (or typical) household’s income has fallen $542, although not steadily. The graph shows it falling between 2009 and 2011, climbing in 2012, and changing little thereafter.

…and as if it’s harder to get ahead…

It has also become harder to “get ahead”, in the phrase used often by the prime minister.

Between 2001 and 2005, 40% of the households in the bottom fifth of earners (the bottom qunitile) moved out of it into a higher one. In more recent years, between 2012 and 2016, a lower 38.5% moved up.

Between 2001 and 2005, 44% of the households in the top qunitile had to move down to let other households take their place. In more recent years, between 2012 and 2016, only 41.5% have moved down.

Getting a long way out of the income circumstances you were born in is a long-shot, according on HILDA’s early attempt at measuring intergenerational mobility.

People who were 32-34 years old in 2015-17 are highly likely to be in the same household income quintiles as those people found themselves in when they were 15-17 back in 2001-03.


There’s only a one in ten chance of moving from the bottom quintile as a teenager to the top quintile in your early thirties. There’s a 37% chance you’ll stay put.

Even among teenagers who grew up in the middle quintile, there’s only a 17% chance of making it to the top, along with a 19% chance of moving one rung up.

Interestingly, women turn out to be more tied to the income their families had when they were children than men, and both men and women tend to stay more closely tied to their mother’s income than their father’s.

…yet we are less reliant on welfare, even pensions…

When HILDA began in 2001, 39% of Australians aged 18 to 64 were living in a household that received government welfare of some kind. By 2017, that proportion had fallen to 31%, but almost all of the drop happened before the global financial crisis in 2009.

Most of us are still in households that have received something from the government over a 10-year period: 58% of working age Australians in 2017, down from 64% in 2010.

Among older Australians aged 65 and over, reliance on the age pension and other benefits for more than half of income needs has dropped from 60% to 51%.

Among new retirees aged 65 and over, the proportion receiving the age pension has fallen from 76% of men and 74% of women to just 60% of men and 55% of women.


Read more: More people are retiring with high mortgage debts. The implications are huge


But while the growth of compulsory superannuation is likely to be part of the story, almost all of the decline happened before the financial crisis in 2009, suggesting that the destruction of wealth in the crisis kept people on the pension who otherwise might not have needed it.

…and gender roles are changing

Before the financial crisis, almost three quarters (73%) of men of traditional working age were employed full-time. After the crisis, the rate slipped to a much lower 67% and stayed there.

Female full-time employment was also hit by the crisis but has since almost totally recovered to be just a fraction below its pre-crisis peak of 39.6%.

Women’s hourly earnings are also climbing faster than men’s, up 24% between 2001 and 2017, compared to 21% for men’s.

While women have always been more likely than men to be employed casually, since the crisis male casual employment has climbed while female casual employment has declined.

The two are now as close as they have ever been, with women now only six percentage points more likely than men to be employed causally.


Read more: HILDA findings on Australian families' experience of childcare should be a call-to-arms for government


In dual-earner male-female couples, the proportion in which the woman earns more than the man has climbed from 22% to 25%.

The woman being the main breadwinner is more common in couples that aren’t legally married and don’t have children. It is also far more common in the regions than in cities and among couples in which the man doesn’t have a university degree.

Men in predominantly female breadwinner households are somewhat less happy with their lives and with their relationships, as (perhaps surprisingly) are women.

Fathers tend to agonise more about work-family conflict than mothers, notwithstanding the much greater amount of housework and childcare work performed by mothers. The men who worry the most work long hours, have irregular shifts and very young children. A mother working the same hours as a father will typically be more conflicted.


Read more: Language of love: a quarter of Australians are in inter-ethnic relationships


Most parents suffering high work-family conflict get out of it within a year or two, often by managing things better and sometimes by changing jobs. Those suffering high work-family conflict are 50% more likely than others to separate the next year.

HILDA’s great strength is that it will be able to follow those parents and their children and all the other families it surveys and tell us what happens next. Rather than being an Australian version of Seven Up!, it might be better described as Australia’s never ending story. Its co-director Roger Wilkins says its design allows it to be “infinitely lived”.


Read more: Australian city workers' average commute has blown out to 66 minutes a day. How does yours compare? The Conversation


Peter Martin, Visiting Fellow, Crawford School of Public Policy, Australian National University

Wes Mountain/The Conversation, CC BY-ND

This article is republished from The Conversation under a Creative Commons license. Read the original article.
Read more >>

Sunday, July 14, 2019

They've cut deeming rates, but what are they?

Treasurer Josh Frydenberg has cut the deeming rate for large investments from 3.25% to 3%, and for smaller ones from 1.75% all the way down to 1%.

The cuts are backdated, to the start of July.

But what exactly is a deeming rate, and why does it matter so much to about one million Australians on benefits, among them around about 630,000 age pensioners?

It’s a topic I covered in The Conversation mid last week in an explainer that went all the way back to the beginning, or at least the most recent beginning, when treasurer Paul Keating brought deeming rates back to Australia’s benefits system in 1991.


Read more: Deeming rates explained. What is deeming, how does it cut pensions, and why do we have it?


Before that, applicants for the pension were able to pass income tests by ensuring that their assets didn’t earn much income, a service banks and other institutions were happy to provide for them.

From 1991, on applicants for the age pension (and later other benefits) were “deemed” to have earned from their financial assets amounts set by the government, whatever they actually earned.

Of late, deeming rates haven’t kept up

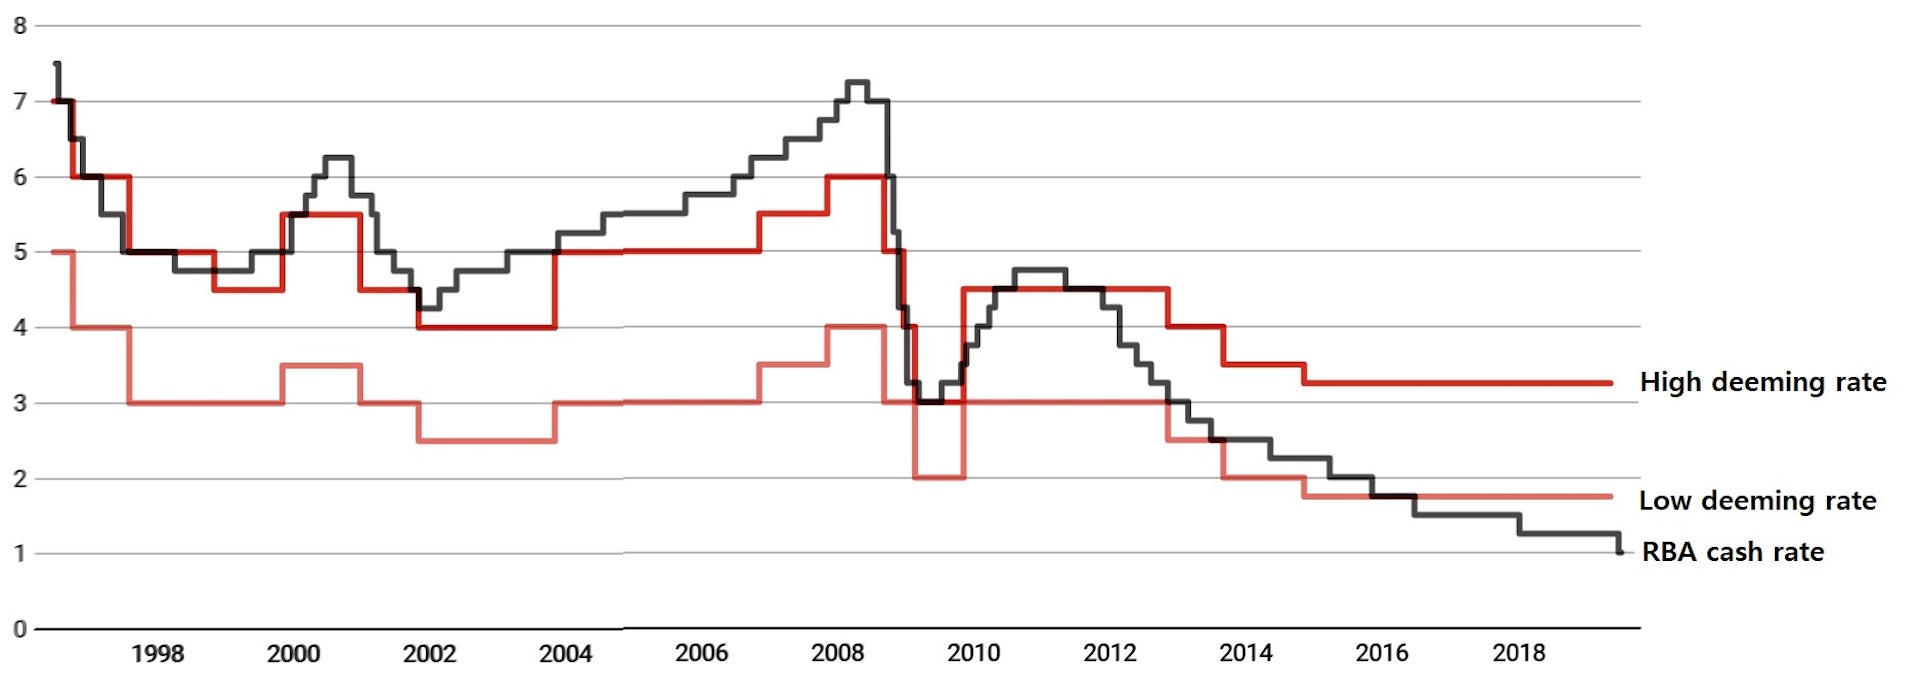
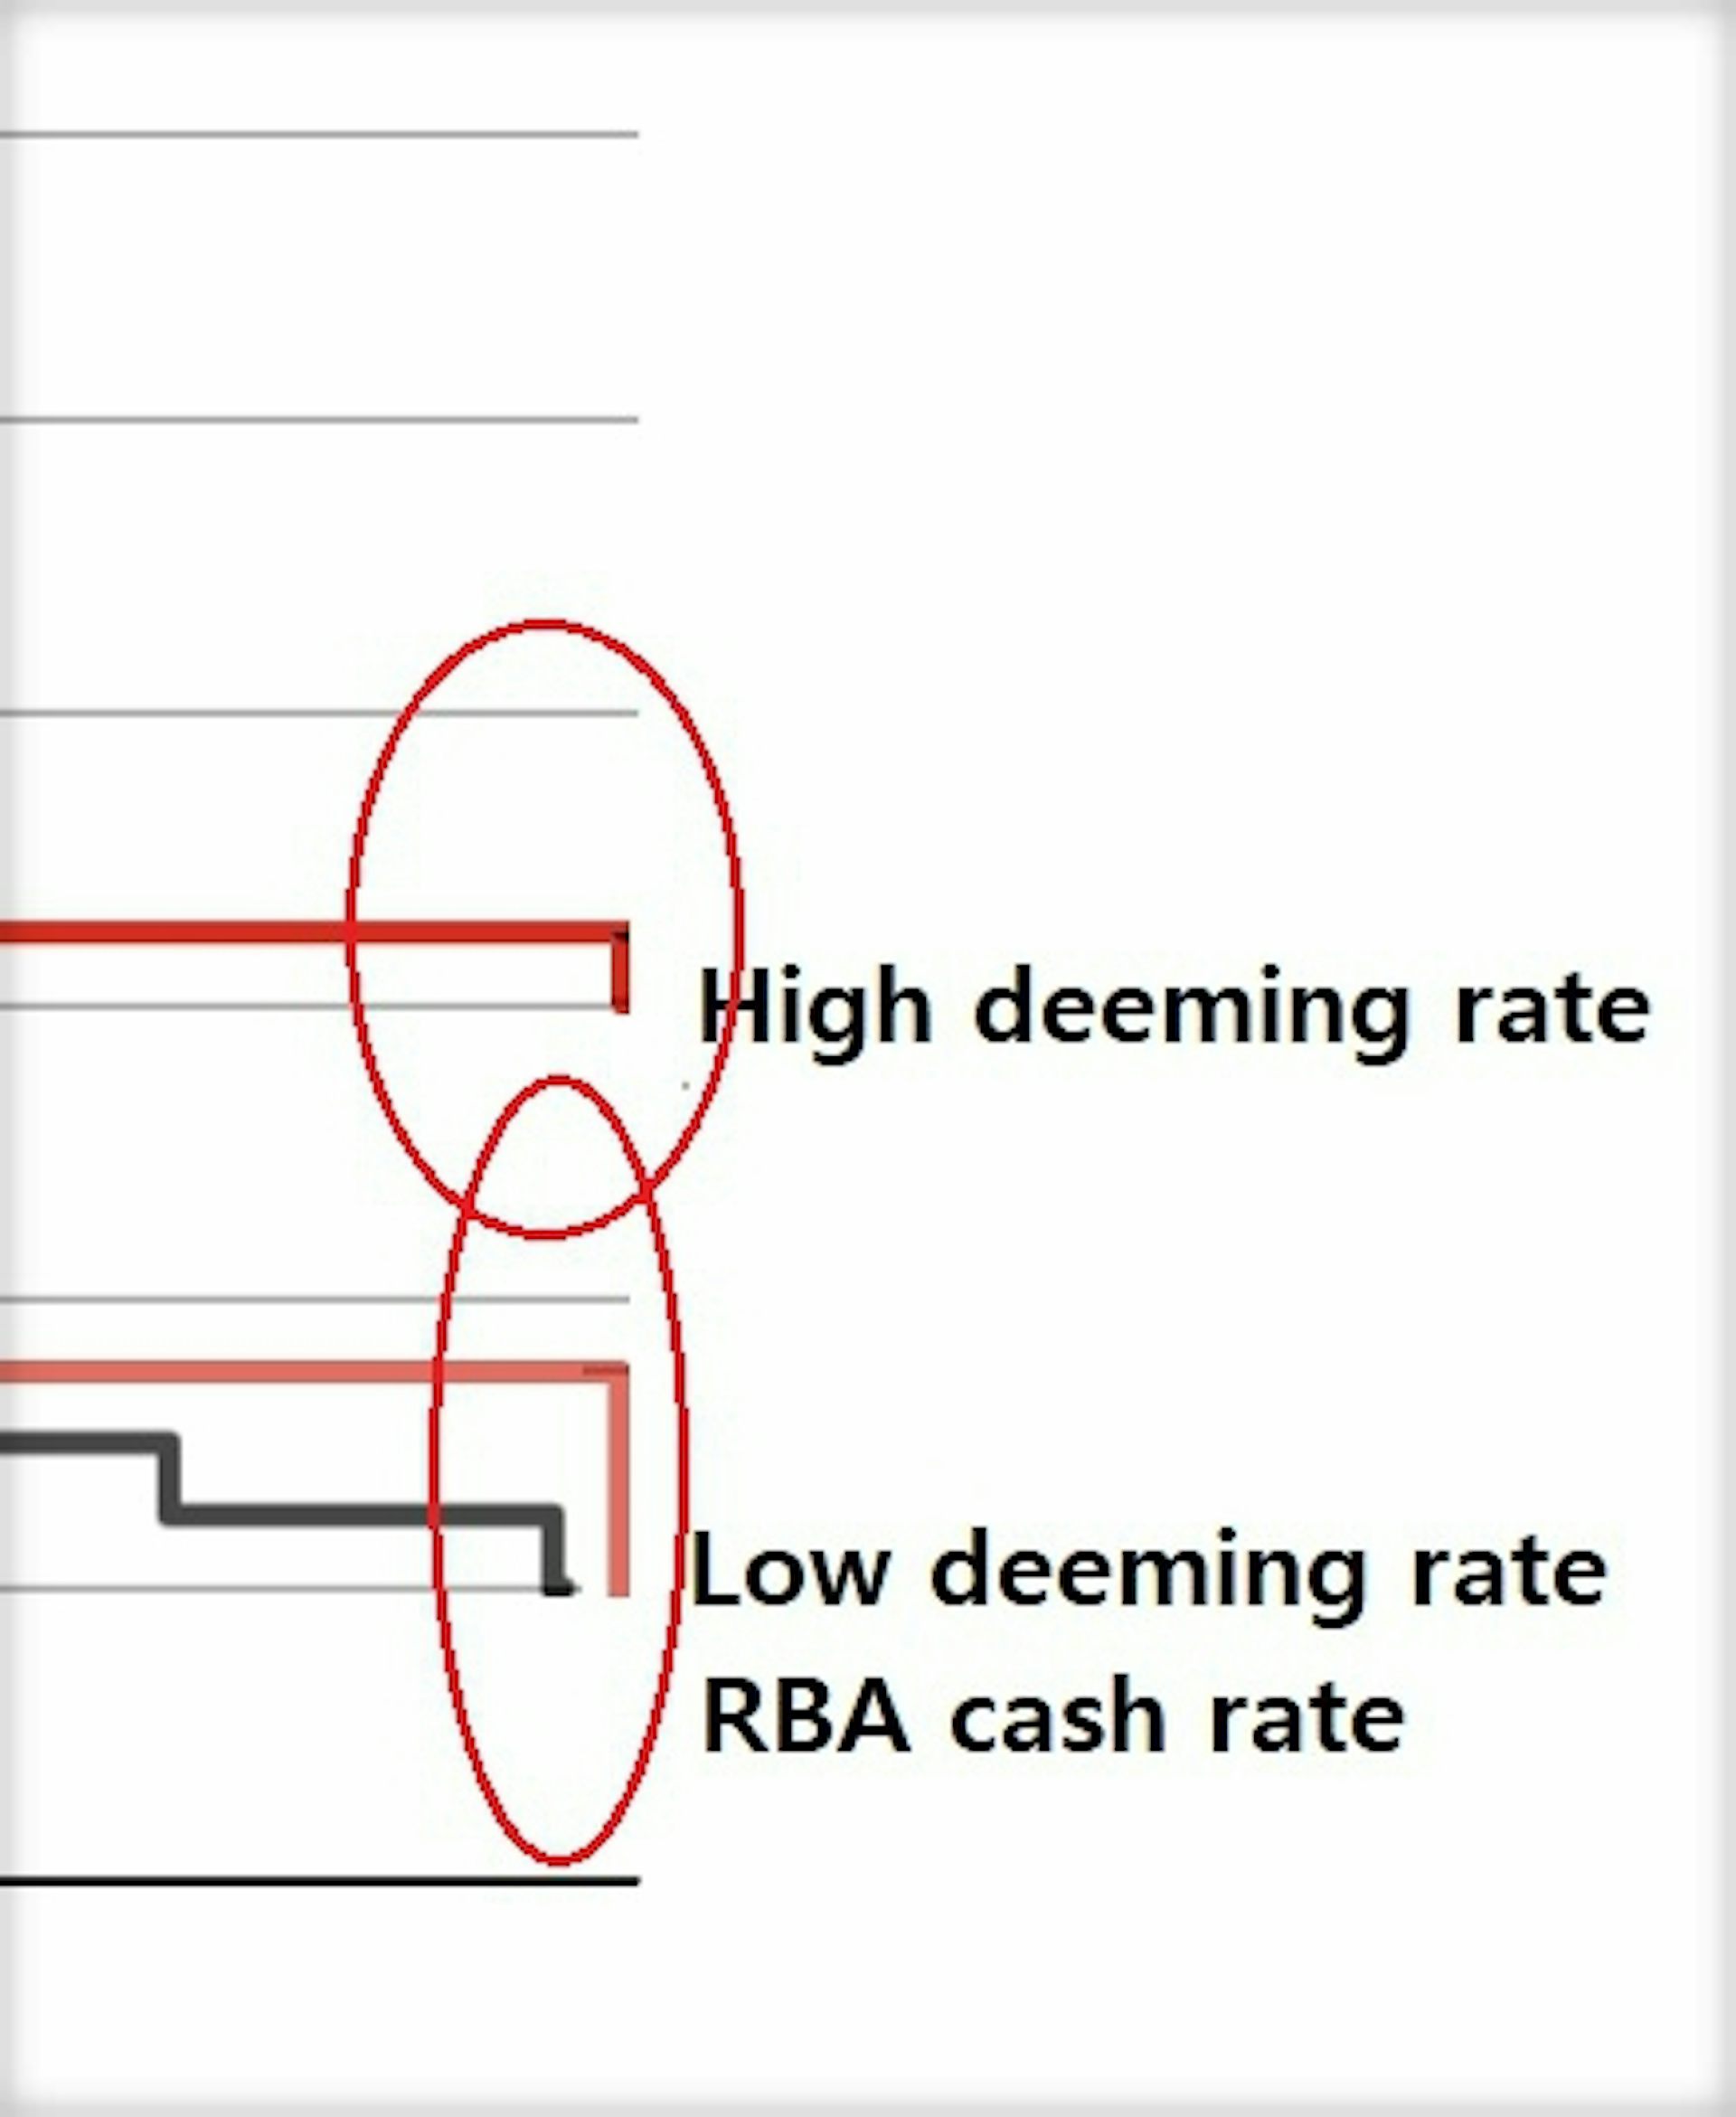
For most of the past two decades both the high deeming rate (which at the moment applies to financial assets in excess of A$51,800 for singles and $86,200 for couples) and also the low deeming rate (for lesser assets) have been below the Reserve Bank’s cash rate, benefiting applicants who could earn more than those low rates while continuing to get benefits.


Deeming rates versus RBA cash rate, July 1996 - July 2019, per cent


Then, beginning with prime minister Kevin Rudd (who, to be fair to him, in 2009 delivered the biggest ever increase in the pension – $100 a fortnight for singles and $76 for couples) and continuing under his successors Gillard, Abbott, Turnbull and Morrision, the government adjusted the deeming rate more slowly, meaning that as the Reserve Bank’s cash rate fell, both the high and low deeming rates ended up above it.

The decisions announced by Frydenberg on Sunday go a long way to putting things right.

The lower deeming rate will once more be close to the cash rate (exactly at the cash rate, for as long as the cash rate stays at 1%). The higher deeming rate will not be, but then it probably shouldn’t be.

The higher rate applies to the return on financial assets (including shares) worth more than $51,800.

As Frydenberg pointed out on Sunday, many of those assets return much more, not much less, than the deeming rate:

It could apply to superannuation returns, and that’s averaging around 5.5%. Or to yields on ASX 200 stocks, which are averaging about 4.5%

The low deeming rate is on the face of it unfair, because few bank deposits pay 1%. The special retirees accounts offered by ANZ and the Commonwealth pay 0.25%. Many deposit accounts pay nothing.

But the low rate applies to financial assets all the way up to $51,800 ($86,200 for couples), and to all types of assets. Many pension applicants are likely to earn a total return on those assets well above 1%.

Deeming is by design, rough and ready. There will always be complaints, and of late those complaints had force. They are now back broadly where they should be.


The Conversation

Peter Martin, Visiting Fellow, Crawford School of Public Policy, Australian National University

This article is republished from The Conversation under a Creative Commons license. Read the original article.

Read more >>

Thursday, July 11, 2019

Deeming rates explained. What is deeming, how does it cut pensions, and why do we have it?

Now it’s the Coalition that’s being accused of a “retiree tax”.

As interest rates have come down over the past four years, the rate that retirees are “deemed” to have earned for the purpose of the pension income test hasn’t budged, meaning that although retirees have been earning less (in some cases a good deal less), they haven’t been getting more access to the pension.

Depending on how you look at it, it’s either been making a mockery of the idea of an income test, or making the test more restrictive.

So how did it happen? Why is income “deemed” rather than actually measured when determining eligibility for government benefits, and is the system hopelessly compromised?

It’s important to understand what deeming is and where it came from if we are to understand the debate that will ensue when the government completes its review of the deeming rate in the next few weeks.

Where did deeming come from?

Modern day deeming was introduced by former prime minister Paul Keating in his final budget as treasurer in 1990.

As he explained in that budget speech:

many pensioners still disadvantage themselves by holding their savings in accounts that pay little or no interest

He was being diplomatic. It was widely believed that many retirees deliberately earned low rates on their savings in order to qualify for the pension or get a bigger pension. It cost the government money (while making the banks money) and it cost many of the pensioners money, because they lost more in interest than they gained in pension – although for those that used low earnings to ensure they at least got some pension, the associated benefits cards made it worth it.

From March 1991 cash and deposits were to assumed to be earning at least 10%, whatever they actually earned. If they earned more than 10% they were treated as earning more.

Except for the first A$2000. That was treated as earning only what it did, because many pensioners held small savings in low interest accounts for day to day purchases.

How has it changed?

Deeming is different today. It applies to more assets, including gold,
managed investments, superannuation account-based income streams and listed shares; and it is used to assess eligibility for more benefits, including veterans and disability pensions.

And it’s no longer a win-win for the government. If someone earns more than the deeming rate, their income is assessed at only the deeming rate.

In the words of the department of human services:

if your investment return is higher than the deemed rates, the extra amount doesn’t count as your income

There are two rates: one for the first $51,800 of financial assets (for a couple, the first $86,200) which is currently 1.75%, and the other for those assets in excess of that amount, which is currently 3.25%.

The threshold climbs in line with the consumer price index each July.

(In its first budget in 2014 the Abbott government tried to cut the threshold to $30,000 for singles and $50,000 for couples but was thwarted by the Senate.)

We deem by whim…

But there’s nothing automatic about setting the rates. It’s up to the government (specifically the minister for families and social services) to adjust them, or not, as it sees fit.

Both the high and low deeming rate used to be below the Reserve Bank’s cash rate (with the low rate typically 1.5 to 2 percentage points below the high rate), but after the cash rate dived in 2016 they have been left above it, in the case of the low rate, for the first time ever.

The high deeming rates mean many applicants are being means tested on income they haven’t received.


Deeming rates versus RBA cash rate, 1996 - 2019, per cent


…leaving rates curiously out of whack

Back when the deeming rates were lower relative to deposit rates, each of the big four banks offered “deeming accounts” that paid the deeming rates.

Today none of them do. They are not allowed to call accounts deeming accounts unless they pay the deeming rate, so instead they have retitled them “retirement accounts”.

The National Australia Bank’s retirement account (closed to new customers) pays just 0.20% for the first $10,000, well below the lowest deeming rate of 1.75%. The ANZ and the Commonwealth pay 0.25%. Westpac pays 0.3%. If you have more than $250,000 on deposit it pays 1.5% on the part above $250,000, which is still lower than the lowest of the two deeming rates.


Read more: Why pensioners are cruising their way around budget changes


Labor believes that not cutting deeming rates since 2015 has saved the government more than $1 billion per year in pension payments. It’s a significant portion of the $7.1 billion surplus it has forecast for 2019-20.

That is probably why the government has said it will take its decision about rates to its expenditure review committee, in what amounts to an admission that those decisions have as much to do with government finances as they do with treating applicants for pensions fairly.

There’s actually a case for extending deeming

As unrealistic as deeming rates have become, there’s a case for extending their use.

At the moment applicants for the pension face two means tests: one for assets and one for income.

Both the Henry Tax Review and the Abbott government’s National Commission of Audit recommended replacing them with a “merged means test” of the kind Australia had up until the 1970s.

Instead of an assets test, all assets would be deemed to earn a prudent rate of return; among them cars, holiday homes, investment properties, and high-value family homes.

The Commission put the case this way:

Exempting the principal residence from the means test is inequitable as it allows for high levels of wealth to be sheltered from means testing. For example, under current rules a single person who owns a $400,000 house and has $750,000 in shares ($1.15 million in total assets) would not be eligible for the pension, while a similar person with a principal residence worth $2 million and $100,000 in shares ($2.1 million in total assets) would be able to claim a pension at the full rate.

It’s a worthwhile idea whose time might come, but it is unlikely to come while deeming rates are seen to be unfair and capriciously set.

The government has an opportunity to restore confidence in deeming and pensions. The decisions it is about to make will show how important it thinks that is.


Read more: Words that matter. What’s a franking credit? What’s dividend imputation? And what's 'retiree tax'? The Conversation


Peter Martin, Visiting Fellow, Crawford School of Public Policy, Australian National University

This article is republished from The Conversation under a Creative Commons license. Read the original article.
Read more >>

Wednesday, July 03, 2019

Ultra-low unemployment is in our grasp. How Philip Lowe became the governor who lifted our ambition

Rarely does a Reserve Bank governor get to remake Australia.

HC “Nugget” Coombs, the first Reserve Bank governor, did.

As director general of the Department of Post-War Reconstruction from 1943, he was instrumental in creating the White Paper on Full Employment in Australia that was adopted as a guide by prime ministers from Chifley to Menzies to Whitlam.

He ensured the objective of full employment became part of the charter of the Reserve Bank when he became its first governor in 1960, moving over from the then government-owned Commonwealth Bank, which had performed the Reserve Bank’s functions up to then.

After once again cutting interest rates to a new record low at a special Reserve Bank board meeting in Darwin on Tuesday, his latest successor Philip Lowe will travel to Yirrkala in Arnhem Land to visit the site where some of the Coombs ashes were buried.

HC Coombs gave us full employment

On Tuesday night in Darwin, he paid tribute to Coombs. He said that in his dual roles as governor of the Reserve Bank and chair of the Council for Aboriginal Affairs, he was a strong advocate for land rights and the preservation of cultural values and traditions.

Another governor who remade Australia was Bernie Fraser, head of the treasury when Prime Minister Paul Keating made him governor of the Reserve Bank in 1989 – shortly before Australia plunged into recession.

He cut rates dramatically from early 1990, as might have been expected in order to bring about a recovery. But then, well before the recovery was complete (and the unemployment rate was still about 10%), he stopped cutting and started pushing rates back up – much to Keating’s displeasure.

Bernie Fraser gave us low inflation

His rationale appears to have been to salvage something out of the unusual circumstances in which Australia found itself. With inflation on the ropes because of the recession, he decided to keep it there – to squeeze out high inflation forever. With one temporary exception during the introduction of the goods and services tax in 2000 it never again returned to the rates of 5% or more that had been common.

He did it not because of an unusual opportunity, and changed Australia forever.

And so to Philip Lowe, who on Tuesday night in Darwin indicated that he too was taking advantage of an unusual opportunity and would probably change Australia forever.

Until a few years ago, it was thought that Australia’s rate of “full unemployment” – the rate below which unemployment couldn’t stay without stoking inflation – was touch over 5%. As it has fallen to 5% in the past year without stoking either inflation or much-wanted wage growth, the bank has come to revise its view.

It now thinks something has changed and the “full employment” is probably 4.5% or lower, a low that was reached during the peak of the mining boom but hasn’t been sustained since the early 1970s. Aiming for an unemployment rate of 4.5% instead of 5% would get 69,000 more people into work.

Lowe wants unemployment lower

Lowe could have ignored the opportunity to push unemployment down that far, to a low that hasn’t been sustained since the 1970s. Instead, in Darwin on Tuesday night, he embraced the opportunity, saying his board was:

prepared to adjust interest rates again if needed to get us closer to full employment and achieve the inflation target in a way that supports the collective welfare of all Australians

Governor Lowe plans to usher in the lowest unemployment target in half a century. He believes the economy can sustain it. He said several times on Tuesday that he would prefer the government to help out with infrastructure projects and the like, but if it won’t, he is “prepared to adjust interest rates again if needed to get us closer to full employment”.

He is doing it because the opportunity is there, as did Coombs and Fraser before him.

There’s no telling (yet) how far rates will have to fall to achieve it. Without setting out to, Lowe is remaking Australia.


Read more: Buckle up. 2019-20 survey finds the economy weak and heading down, and that's ahead of surprises The Conversation


Peter Martin, Visiting Fellow, Crawford School of Public Policy, Australian National University

This article is republished from The Conversation under a Creative Commons license. Read the original article.

Read more >>

Friday, May 10, 2019

Mine are bigger than yours. Labor's surpluses are the Coalition's worst nightmare

On Friday morning the Coalition’s worst dream will come true.

All throughout the campaign, and all through the two terms in office and three prime ministers and three treasurers who preceded it, they’ve argued they are better than Labor at managing money. They had budget surpluses under Howard that Labor didn’t have under Rudd and Gillard.

In the last election, Labor allowed them to get away with it. Its costings document actually forecast a better budget position than the Coalition’s over ten years (because it rejected the Coalition’s expensive company tax cuts) but a worse position over the immediate four-year “forward estimates”, because of its more generous programs.

The Coalition focused on the four years, not the ten, and painted Labor as irresponsible.

Bigger, sooner surpluses

On Friday morning, Labor won’t make the mistake again. Yes, it’ll detail (and have year-by-year costs for) programs that are more generous than the Coalition’s, among them cheaper childcare, its Medicare cancer plan and its pensioner dental plan.

But it’ll be able to more than pay for them in every one of the next ten years because of a number of courageous decisions that’ll save money, the most financially important of which is the decision to stop sending company tax refund cheques to people who don’t pay tax. It’ll save A$5 billion in the first year and more in future years because the cost of the refunds has been ballooning.

The result will be a larger budget surplus in every one of the next ten years, including each year of the forward estimates and including the financial year about to start, which is when the budget is scheduled to return to surplus.


Read more: Words that matter. What’s a franking credit? What’s dividend imputation? And what's 'retiree tax'?


So big will be these bigger surpluses that Labor has its budget on track to hit the Coalition’s target of 1% of gross domestic product four years earlier than the Coalition in 2022-23 rather than 2026-27.

That means that in Labor’s first budget, which it will deliver in August this year if elected as a means of resetting forecasts, its projections will show the long-awaited surplus of 1% of GDP within the forward estimates, rather than beyond them as in the Coalition’s budget.

Labor’s 1% of GDP will be A$22 billion, twice the surplus of $9.2 billion the Coalition plans to deliver in that year.

All Labor needed was courage, and the ability to withstand complaints from people who own shares but don’t pay tax and are naturally upset about losing government cheques they’ve become used to.

And lower government debt

Bigger surpluses and the much more rapid delivery of a substantial surplus will mean much quicker reductions in government debt. The budget had the government on track to eliminate net debt by 2030. Labor’s costings will have it on track to eliminate it much sooner.

Despite what the Coalition would like to claim, the key reason Labor’s surpluses will be bigger isn’t that Labor won’t be matching its longer-term tax cuts. Bracket creep means tax rates need to be cut or thresholds adjusted from time to time to ensure the personal tax take doesn’t climb too high. Labor’s costings recognise this, including a built-in assumption of tax cuts after the tax take hits 24.3% of GDP, a figure cunningly selected because it was the tax take when Howard left office.

If delivered as income tax cuts, at about the time the Coaltion’s high-end tax cuts are due, it’ll cost A$200 billion, but the method of delivery will depend on circumstances at the time.

With future tax cuts baked in

Labor’s “technical assumption” that the tax take won’t climb beyond 24.3% of GDP is different to the Coaltion’s “guarantee” that it won’t climb beyond 23.9% of GDP. It is a technical assumption rather than a promise, of the kind usually included in budget documents as a way of allowing for inevitable future tax cuts.

Without it, Labor’s surplus projections would have been much bigger and would have been hard to believe. With it, the projections should be credible.


Read more: Election tip: 23.9% is a meaningless figure, ignore the tax-to-GDP ratio


The secret sauce in Labor’s better budget projections isn’t that it isn’t adopting the Coalition’s tax cuts. It is that it’s tackling the handing out of billions of dollars in dividend imputation cheques to people who don’t pay tax in a way the Coalition wasn’t prepared to.

Not that it didn’t think about it. A file list seen by Fairfax Media shows Treasury created a file entitled “Tax Policy - Dividend Imputation” in the lead-up to then Treasurer Scott Morrison’s 2017 budget.

The tax reform discussion paper commissioned by his predecessor, Joe Hockey, found “revenue concerns with the refundability of imputation credits”.


Read more: Vital Signs: When it came to the surplus, both Bill and Scott were having a lend The Conversation


Peter Martin, Visiting Fellow, Crawford School of Public Policy, Australian National University

This article is republished from The Conversation under a Creative Commons license. Read the original article.
Read more >>

Thursday, June 21, 2018

Never mind the tax, it's wages that are making us glum

Why do they keep going on and on about tax when they must know it’s not our real concern? Because the sudden dive in wage growth – the thing that is really worrying us – is beyond their control.

As recently as 2012, just six years ago, wages were growing like they usually had, at a touch under 4 per cent per year. The rapid dive meant that by June 2014, two years later, they were growing at 2.4 per cent, the lowest rate since the last recession, and a good deal less than the lows plumbed during the global financial crisis.

Another two years later they were growing at just 2 per cent; even less than in the early 1990s recession, and on the face of it, the least since the Great Depression in the 1930s.

Yet we weren’t in a depression, or even in recession. And we kept buying houses and other things as if wage growth would recover. It needs to recover to make those home loans and car loans manageable.

Banks and finance companies have formulas they use to decide how much to lend. Unchanged since the days when workers could expect solid wage rises, they are based on income and the size of a deposit. Difficult to manage at first, home loans became easier to repay as the borrower’s income climbed, meaning many were paid off early. But not now, not unless wage growth picks up.

Banks are advancing 30-year mortgages to 50-year-olds. Without faster wage growth, a lot of those borrowers will remain mortgaged into retirement, and have much of their pension eaten up in payments, a fate their parents escaped.

Reserve Bank governor Philip Lowe touched on the phenomenon in a speech last week. His bank has even coined a name for it: mortgage tilt. Whereas required payments as a proportion of income used to tilt down over time, now they are more horizontal, meaning a long horizon of fairly constant payments. Unless interest rates climb, in which case payments will climb, which would be even worse.

And he pointed to something else. He said low wage growth was “diminishing our sense of shared prosperity”. When I first visited Japan in the late 1980s the locals seemed optimistic and proud to be part of something big. When I next visited in the late 1990s after a decade of near zero wage growth, their faces and stories were glum, even though by international standards they were prosperous and had jobs. Glum Australians feeling they are not part of the Australian project can derail the project, as we have seen in Britain and the United States.

Why should wage growth have dropped so suddenly, when the unemployment rate is little different to what it was back when it was high?

The first thing to note is that we are not alone. It’s been a shift throughout the developed world, with Japan getting in early. Improved communications have made competition from cheaper workers overseas a potent threat. Also, unions no longer have the bargaining power that they used to.

In the words of Andy Haldane, chief economist at the Bank of England: “There is power in numbers. A workforce that is more easily divided than in the past may find itself more easily conquered.” As recently as 1990, 40 per cent of the Australian workforce was in a union. Now it’s 14.5 per cent.

Unions no longer have the unfettered right to enter workplaces, or the right to demand special clauses in awards that benefit only their members. Strikes are illegal in most circumstances, and require notice and hard-to-organise ballots in others. The Fair Work Commission can no longer intervene to resolve disputes without the consent of the employer.

And although employment is strong, people are losing their jobs. Telstra is letting go of 8000, many in its Melbourne headquarters. The National Australia Bank is shedding 2000 each year for the next three years. The NSW public service will lose as many as 11,800 jobs as a result of efficiency measures in this week’s state budget. Few workers, in any of those organisations, are going to feel game to make themselves expensive.

The way Dr Lowe sees it, a small number of Australian firms are investing massively in the technology needed to do things more cheaply. A much greater number are not, and are having to fight off brutal price competition. The only way they can do it is to hold the line against wage increases, even at the cost of missing out on good staff.

Added to this might be what US economist Paul Krugman calls the scarring effect of the global financial crisis. He says employers discovered during the crisis that they couldn’t cut wages, even though they needed to. It wasn’t socially acceptable. It taught them that “extended periods in which you would cut wages if you could are a lot more likely than they used to believe”.

So they’re keeping wage costs low, in preparation for the next crisis. It’s an awful response, with political as well as economic implications.

Government forecasts notwithstanding, it is hard to see anything changing for quite some time. Glum is starting to look like the new normal.

In The Age and Sydney Morning Herald
Read more >>