Monday, December 27, 2021

The best graphs tell stories. Here are my 10 favourites from 2021

“One of the first things you have to decide on with a musical is why should there be songs.”

The person speaking is Stephen Sondheim, the writer of some of the best songs for musicals in the 20th century, who died in November aged 91.

You can put songs in any story, but what I think you have to look for is, why are songs necessary to this story? If it’s unnecessary, then the show generally turns out to be not very good.

I’m no Sondheim, but as an editor I won’t put a graph into any story unless it is absolutely necessary to tell the story.

When I do, the picture can be worth at least the 800 words that accompany it.

So here are my 10 favourites from the business and economy stories I edited for The Conversation in 2021.

Some of the best graphs remove doubt

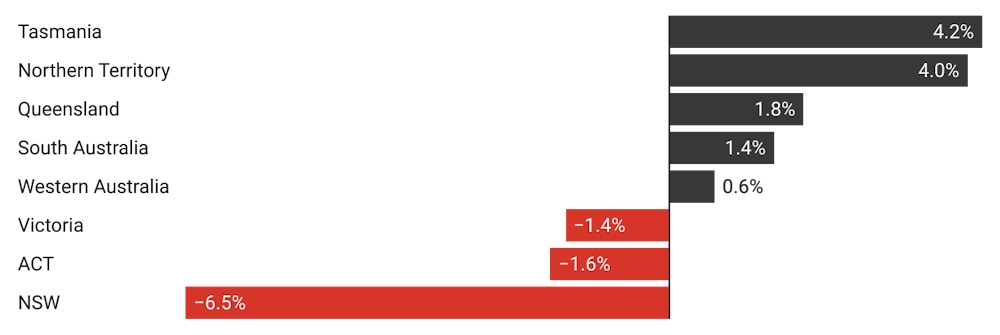
This graph, from the Bureau of Statistics, leaves no doubt about what happens to consumer spending when lockdowns end.

Released in November, with the national accounts, it uses bank account data to show what happened to spending on clothes, furnishings, recreation, transport and restaurants and hotels.


Selected Victorian spending data

Aggregated bank data. Index for May 2020 = 100. ABS

While the effect is clear, and beautifully illustrated, it can be interpreted in two ways. One is that lockdowns are to be avoided because they suppress ordinary life.

The other is that Victoria’s long lockdown was caused by the failure of the NSW government to lockdown quickly enough and hard enough as the Delta variant spread, meaning lockdowns are to be embraced, and quickly.

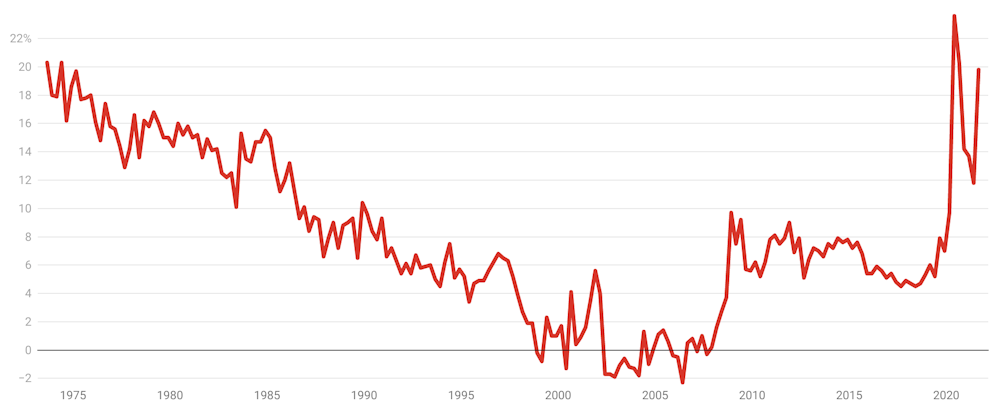
Another graph that removed doubt is this one showing what Australia’s July 2012 to July 2014 carbon price did to greenhouse gas emissions, excluding those related to land use and forestry that are subject to government directives.


Australian emissions excluding land use, land-use change and forestry

Million tonnes of carbon dioxide equivalent per annum, updated quarterly. Climate Council, Department of Industry

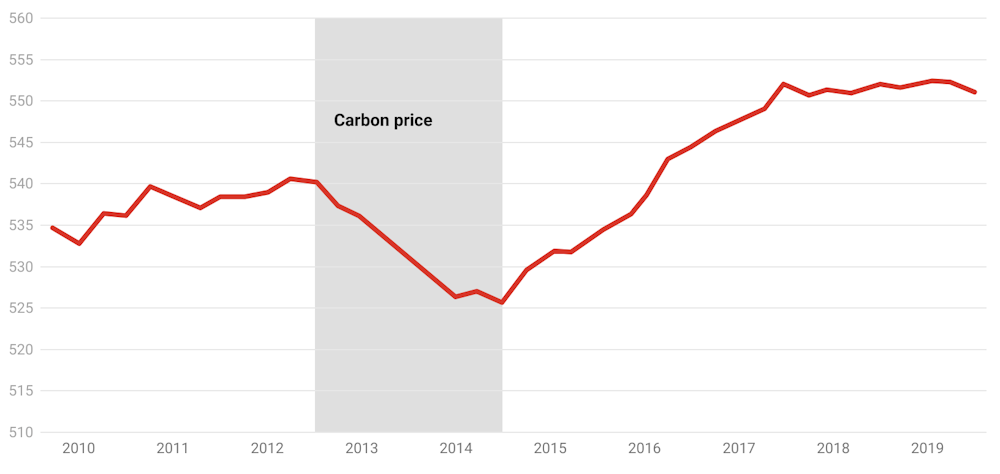
Whatever else is said about the carbon price, its effect on emissions is clear.

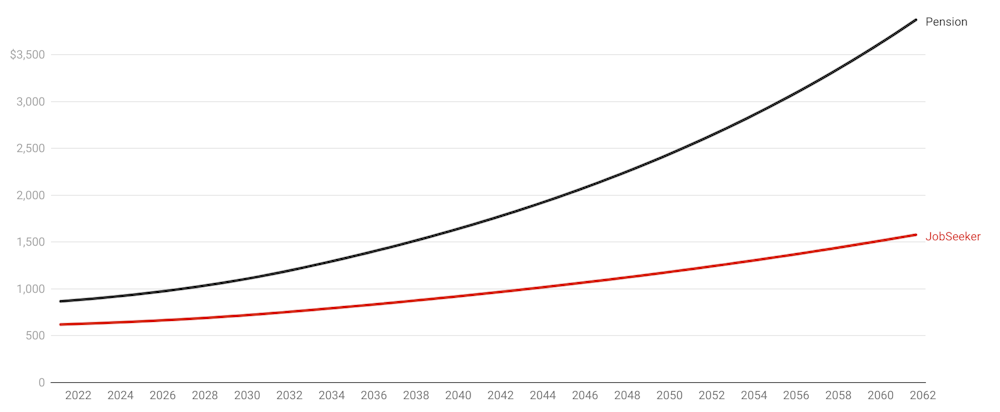
Also clear, and enormous when you look at it, is what our current system of adjusting JobSeeker only in line with the consumer price index will do to it compared to the age pension, which is adjusted in line with wages.

The projections in this graph derive from the mid-year intergenerational report which looks forward 40 years.

After 40 years – unless there’s an extra increase, and one wasn’t allowed for in the intergenerational report – JobSeeker will be a mere fraction of the pension.


JobSeeker and age pension as projected in intergenerational report

Payment for a single person, dollars per fortnight. JobSeeker, pension indexed to intergenerational report inflation projections.

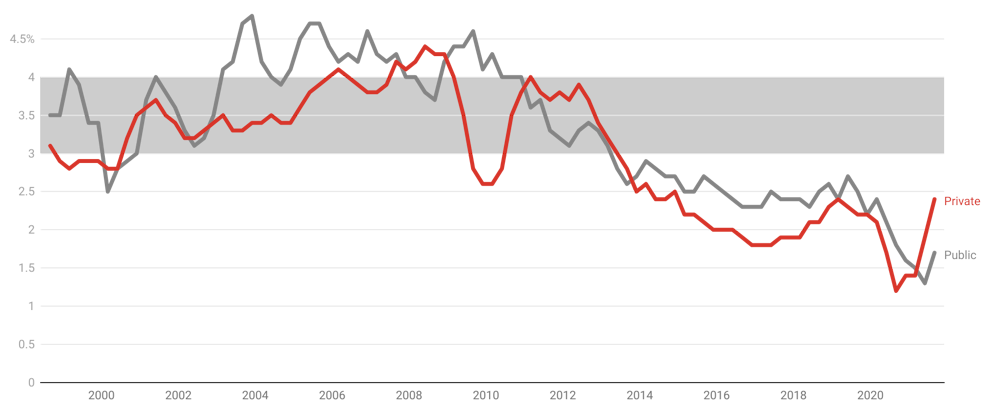
Also shrinking, with unfortunate consequences for Australians with mortgages and Australians trying to get them, has been wage growth.

The government has been forecasting a return to the 3-4% wage growth we once had in every budget since 2012, save for the last two.

Right now public sector wages growth, which used to lead private sector growth, is well below 2%. Private sector growth has started to climb, but it is well short of where it was.


Wage price index

Annual seasonally adjusted growth in total hourly rates of pay excluding bonuses. ABS

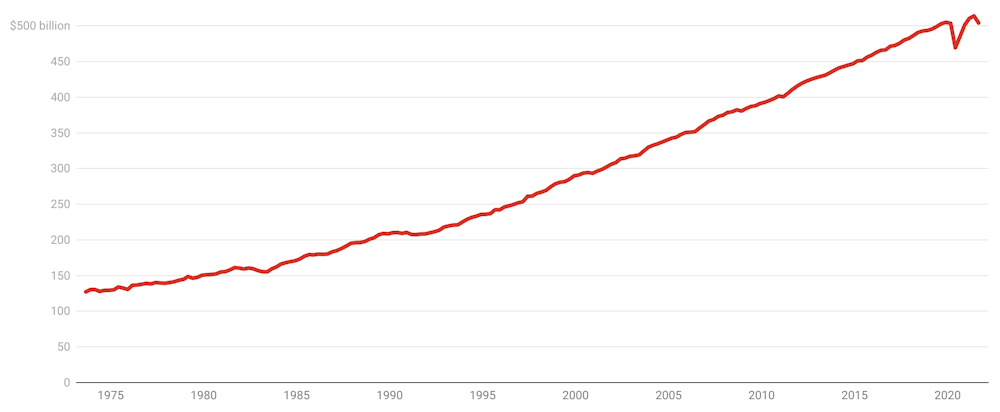
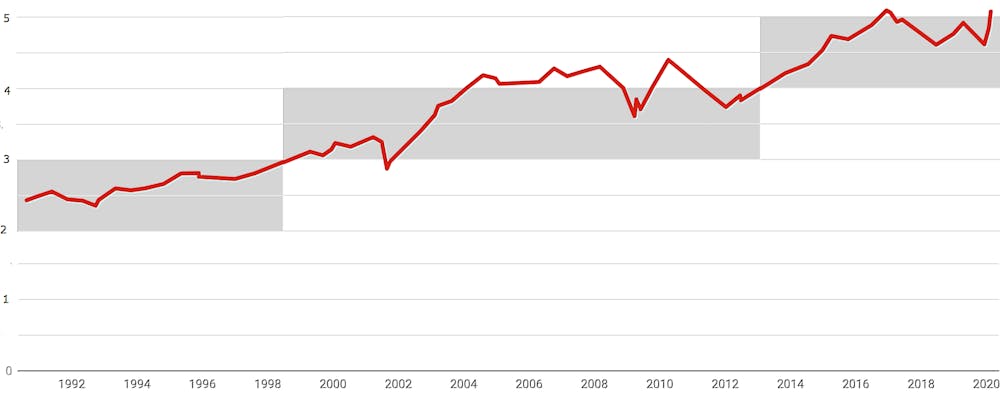
Up until the year 2000, buying a home cost between two and three times household after tax-income.

Then, after the headline rate of capital gains tax was halved and investors dived into the market, prices climbed to between three and four times income.

Six years ago they jumped again to between four and five times income, and in 2021 they climbed once again to more than six times disposable income.


Home prices as proportion of household disposable income

Household disposable income after tax, before the deduction of interest payments, including income of unincorporated enterprises. Core Logic, ABS, RBA

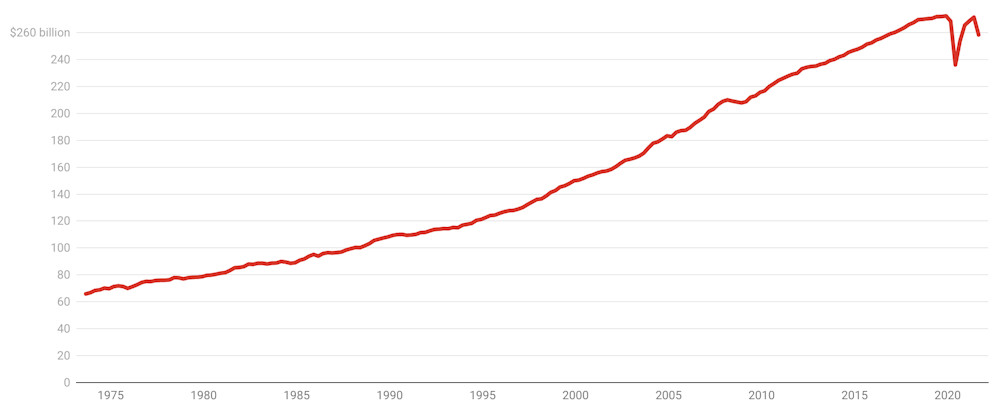
While low wage growth should make it harder to pay off a loan than it used to be, just at the moment ultra-low interest rates are making it easier to service mortgages than it has been in decades.

But what the Reserve Bank calls housing accessibility (to distinguish it from housing affordability) is much worse.

Astounding price growth and a decade of weak wages growth have pushed up the cost of an average first home deposit from 70% of income to more than 80%.


Average first home buyer deposit

Owner-occupier; estimated as a share of average annual household disposable income using average first home buyer commitment size and assuming 20 per cent deposit. Seasonally adjusted and break-adjusted. RBA, ABS

Other graphs surprise

If we start building more houses, it stands to reason that we will get more houses.

That’ll doubtless be the case eventually, but if you are expecting it to happen any time soon, you will be disappointed.

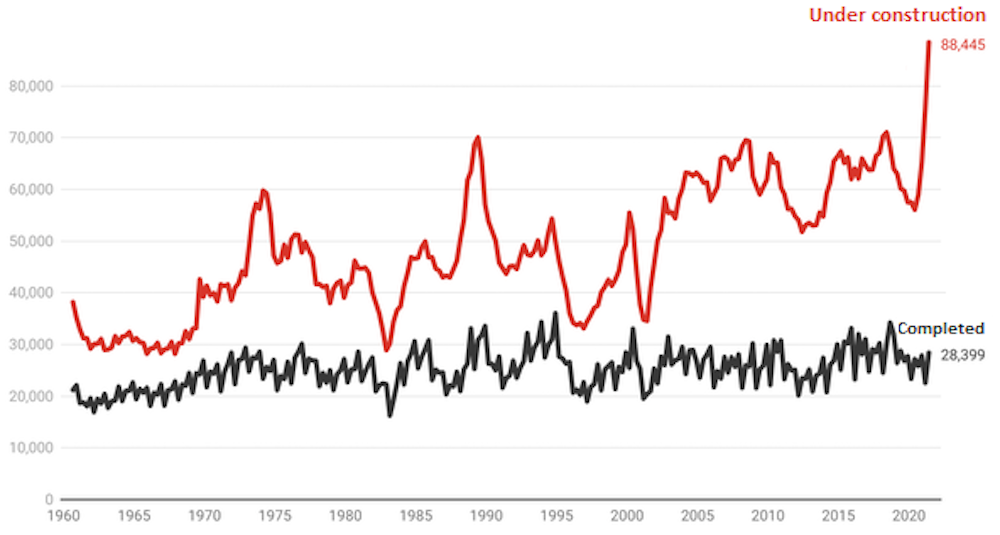
In the space of a year, the number of Australian houses (not apartments) under construction has jumped from 56,060 to 88,445 — the most ever.

But bizarrely, as has been the case for half a century, the number of houses completed each quarter has barely moved.

It’s as if homebuilding can’t scale up.


Houses under construction, houses completed, quarterly

Australian Bureau of Statistics

Another surprising graph shows the disconnect between crime and our desire to lock people up.

Nonviolent crime has plummeted. Between 2000 and 2020, armed robberies fell from 9,480 to 4,746, unarmed robberies fell from 13,850 to 4,666, and motor vehicle vehicle theft fell from 138,915 to 48,056.

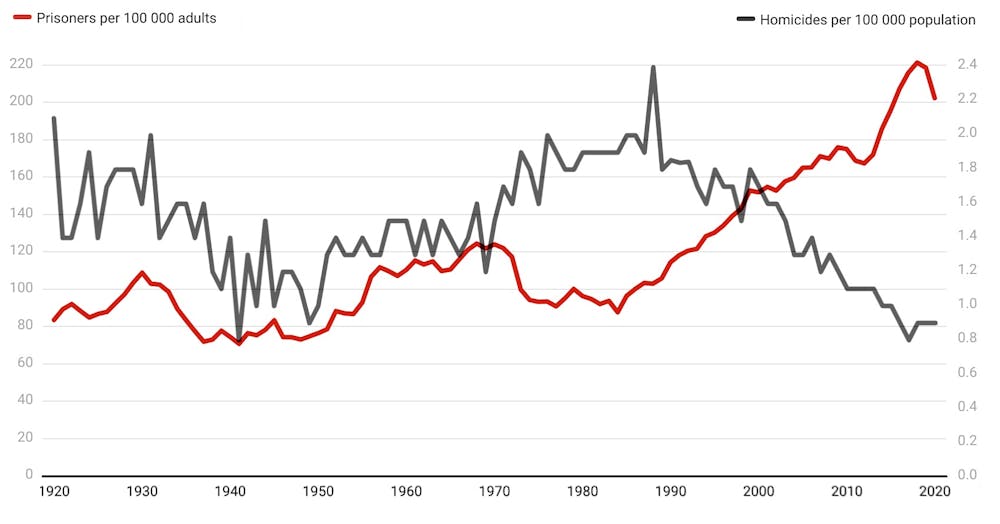
Violent crime is falling too. The Productivity Commission believes homicide gives the best read on crime because almost all homicides are reported.

It found that while homicide has plummeted, imprisonment has doubled.


Homicides and imprisonment per 100,000 Australians

Number of prisoners per 100,000 population aged 18 years and over, number of homicides per 100,000 persons. Productivity Commission

Another surprise is that the “great resignation” – the jump in the proportion of workers quitting their jobs in the United States – hasn’t been seen here.

It seems to be a real phenomenon in the US, where low vaccination rates have made public-facing jobs dangerous, but not here where resignations have been falling for decades.

Australians seem increasingly resigned to staying in the jobs they are in.


Proportion of Australians who changed jobs in the past year

Australian Bureau of Statistics

The very best graphs tell an entire story

When COVID took off in the first half of 2020 there was concern that many more people would die as a result of COVID than were recorded as COVID deaths.

Some of these “excess deaths” would be COVID deaths that were not classified as COVID; some would be extra deaths caused by measures such as lockdowns; and some would be caused by crowded medical facilities turning away patients.

Worldwide, there have been millions of excess deaths.

But not in Australia. In several months Australia’s excess deaths have been negative, with more deaths avoided than usual, in part because better health practices prevented deaths from the flu.

To track excess deaths the Bureau of Statistics has graphed the number of doctor certified deaths actually recorded each week against the number that would be expected for that week given the average over the past five years.


Weekly deaths vs 2015-2019 average

Doctor certified deaths. ABS Provisional Mortality Statistics

What is apparent is that in most weeks Australian deaths have been little more than would be expected given five-year averages, and in many weeks less.

If COVID has been killing people in ways we can’t see, the effect has been offset by the measures we have taken to combat COVID – saving lives in other ways we can’t see.

It’s an important finding, not at all foreseeable, and illustrated beautifully.

Peter Martin, Visiting Fellow, Crawford School of Public Policy, Australian National University

This article is republished from The Conversation under a Creative Commons license. Read the original article.

Read more >>

Wednesday, December 08, 2021

Greg Hunt is the unsung architect behind Labor’s climate plans

The architect of the ingenious mechanism at the heart of Labor’s plan to sharply cut carbon emissions is about to leave the parliament.

Throughout the pandemic, Greg Hunt has been best known as Australia’s health minister. But before that, when the Coalition was swept to office in 2013, he became Tony Abbott’s environment minister, charged with destroying Labor’s carbon tax.

(I’m calling it a “carbon tax” here to distinguish it from the mechanism Greg Hunt quietly slipped in to replace it, and also because the Bureau of Statistics decided it was a tax when it recorded it as a tax in the national accounts.)

Labor’s scheme taxed (or “charged” if you must) each big emitter in the industries covered A$23 for each tonne of carbon dioxide or equivalent they pumped into the atmosphere.

There were all sorts of problems with Labor’s scheme, problems Hunt was keenly aware of, having co-authored a prize-winning research paper on carbon taxes at university and having been immersed in the topic when Labor was last in power, as the Coalition’s environment spokesman under leaders Nelson, Turnbull and Abbott.

One big problem was that Australian exporters (of products such as steel and aluminum) would be placed at a disadvantage by having to pay the tax, while their overseas competitors did not.

Steel and aluminium would still be sold to the eventual customers but from a country other than Australia that didn’t charge the tax, a phenomenon known as carbon leakage.

Labor’s carbon tax had problems

And not only exporters. Australian producers of products for local consumption stood to suffer in the same way, losing sales to foreign suppliers who weren’t charged the tax, a problem the European Union is trying to fix at the moment by imposing a so-called Carbon Border Adjustment Mechanism, or “carbon tariff”.

Labor’s solution was to grant firms in “emissions-intensive trade-exposed” sectors free permits to the tune of 94.5% of industry average carbon costs in the first year (and less exposed firms free permits to cover 66% of costs), a gift that would be wound back 1.3% each year.

Another solution, being pursued by Hunt as he took soundings while in opposition, was to limit Australian facilities to emitting no more than they are now.

Over time the entitlement could be wound back.

But the problem was it would stop firms expanding.

BHP, for instance, might get a big contract that required it to double its output of steel but be unable to fulfil it without halving its emissions intensity – the amount it emitted per unit of steel produced.

Hitting on a baseline winner

Hunt’s solution, the one he and independent senator Nick Xenophon slipped into legislation being drawn up to replace the carbon tax with direct grants, was to set up “baselines” for each large emitter.

To be determined by the Clean Energy Regulator in accordance with rules set by the minister and disallowable by parliament, the baselines set the maximum amount each big plant can emit without being in breach and paying penalties.

Importantly, the baselines were to be calculated on the basis of previous emissions. Facilities were to be allowed to emit what they had, but no more.

More importantly, plants could have their baselines calculated on the basis of emissions intensity – the amount emitted per unit of production, which would mean they would be able to expand so long as they didn’t emit more per unit.

More importantly still, the Clean Energy Regulator is in the process of converting almost all baselines to emissions intensity baselines.

All Labor has to do, and what intends to do, is to make use of the mechanism Hunt and Xenophon put in place.

Business is backing baselines

Each facility that emits more than 100,000 tonnes of carbon dioxide equivalent per year – 215 of them – is subject to a baseline.

What Labor has pledged to do, and it is backed by the Business Council, is to get the Clean Energy Regulator to wind down those baselines “predictably and gradually over time” to support the transition to net zero.

Businesses that are already reducing their emissions want this, because they want other firms to be made to do the same.

The beauty of the mechanism set up on Abbott’s watch is that each facility, each “gas well, aluminium smelter and coal line” as Labor’s Chris Bowen puts it, will have its tightened baseline calculated individually.

Each will be asked to do no more than what is needed after considering what it can cope with.

Within minutes of Friday’s announcement, Energy Minister Angus Taylor labelled it “a sneaky new carbon tax on agriculture, mining and transport”, but it is better described as a system of guidelines and penalties, one legislated by Taylor’s side of politics.

Quite a lot will be needed. Labor’s modelling, released on Friday, didn’t spell out what would be needed to get emissions to net-zero by 2050, but the Coalition’s modelling, released in November, did.

No matter what reasonable assumptions the model included, including “global technology trends”, it couldn’t get all the way to net-zero by 2050.

So the Coalition’s modellers added in something fanciful which they named “further technology breakthroughs” to get the remaining 15%.

Greg Hunt retires as health minister and retires from parliament at the next election. He has set us on the path to getting where we will need to be.

Peter Martin, Visiting Fellow, Crawford School of Public Policy, Australian National University

This article is republished from The Conversation under a Creative Commons license. Read the original article.

Read more >>

Wednesday, December 01, 2021

GDP went backwards, but look at what’s to come

The most revealing graph presented in Wednesday’s September quarter national accounts is one showing what has happened just beyond the end of the September quarter, in the one we are in now.

Melbourne’s lockdown ended on October 27.

The graph uses anonymised bank account data to show what happened to spending in Victoria as soon as the lockdown was lifted.


Selected Victorian spending data

Aggregated bank data. Index for May 2020 = 100. ABS

Spending on clothing, furnishings, recreation, transport and restaurants and hotels surged.

As happened after last year’s lockdowns, Victorians returned to spending pretty much what they had before.

The September quarter national accounts released on Wednesday are a statement of their time – they show what things were like when NSW, Victoria and the ACT were locked down.

Australia’s gross domestic product shrank 1.9% in the three months to September, after climbing for four consecutive quarters following the record hit of 6.8% from the first wave of COVID and last year’s lockdowns.


Australian quarterly gross domestic product

Chain volume measures, seasonally adjusted. ABS

The biggest hit to GDP came from household spending, down 4.8% in the quarter.

National spending on hotels, cafes and restaurants fell 21.2%, spending on recreation and culture fell 11.8%, and spending on transport fell 40.8%.


Household final consumption expenditure

Chain volume measures, seasonally adjusted. ABS

But the decline was anything but national.

Whereas spending in hotels, cafes and restaurants collapsed 33% (or more) in each of the states that were locked down, in the states that weren’t, it barely suffered.

Aggregate spending shrank 6.5% in NSW, 1.4% in Victoria and 1.6% in the ACT, while climbing strongly in the states that weren’t locked down, surging an impressive 4% in the Northern Territory and 4.2% Tasmania.


State final demand, September quarter

Seasonally adjusted. ABS

Nationally, personal saving soared, with the jump centred in the lockdown states as those households whose income hadn’t taken a hit saved more because of concern about the future and fewer opportunities to spend.

The national household saving rate bounded back up to an extraordinary 19.8% of household income from the 11.8% it fell to in March, after hitting an all-time high of 23.3% in the first wave of lockdowns.


Household saving ratio

Ratio of saving to net-of-tax income, seasonally adjusted. ABS

The bank-sourced data on post-lockdown spending in the lockdown states suggests household saving is already on the way down.

At his parliament house press conference, Treasurer Josh Frydenberg spoke of the unusually high saving rate as a source of future spending.

“Not all of it is going to be spent,” he said. “But it’s a lot of damn money that’s been accumulated”.

If household spending had been the only thing driving changes in gross domestic product, it would have been down 2.5%. Working in the other direction this quarter was a jump in net exports and a jump in government spending. Neither business investment nor housing construction changed much.

Organisation for Economic Co-operation and Development forecasts released late Wednesday have the Australian economy growing 4.1% in 2022, up from 3.8% this year, slipping back to 3% in 2023.

Sustained low unemployment forecast

The OECD Economic Outlook has Australia’s unemployment rate falling to 4.7% in 2022 and 4.3% in 2023. It says as inroads are made into unemployment, wage and price pressures will build, but are expected to “remain contained”.

The organisation welcomes Australia’s commitment to net zero emissions by 2050, but says the strategy should be “comprehensive, effective and inclusive”. Its report backs a call for an independent review of the Reserve Bank.

It forecasts global growth of 4.5% and 3.2% in 2022 and 2023.

Peter Martin, Visiting Fellow, Crawford School of Public Policy, Australian National University

This article is republished from The Conversation under a Creative Commons license. Read the original article.

Read more >>

GDP is like a heart rate monitor: it tells us about life, but not our lives

How much cash would you need to be paid to agree to live without a smartphone for a year?

If you are like the typical American, the answer is US$10,000 – which is far, far more than what we are actually charged for having and using smartphones.

How much would you need to be paid to live without a computer?

According to the same research, just published by Stanford University’s Hoover Institution, a typical American would want US$25,000 to live computer-free for a year.

For the GPS system that lets us map where we are on all our devices, the answer is US$3,000; for streaming services such as Netflix the answer is another US$3,000.

For refrigeration the answer is US$10,000; for air conditioning, another US$10,000; and for running water US$50,000.

The point of this study, by economist Tim Kane, is that if we add up the worth to us of everything the economy produces each year, we get much, much more than the gross domestic product – even though GDP is meant to be a summation of the prices paid each year.

Not a day goes by when we don’t get astounding value for money: on Kane’s estimate, about 20 times what we pay.

GDP monitors changes, not our lives

It’s a useful perspective to bear in mind ahead of the latest Australian gross domestic product figures, being released on Wednesday.

Those figures will show Australia spent less, earned less and produced less in the lockdown-affected September quarter months of July, August and September than in the three months before – about 3% less on private estimates.

It won’t be a “recession” because in Australia that’s generally taken to mean two consecutive quarters of those things going backwards. And we already know spending, earning and production all started climbing as soon as the lockdowns ended at the beginning of the quarter we are in now.

The GDP has the same relationship to life as a heart rate monitor has to health.

There’s more to GDP than you might think

Behind the headline figure you hear about are actually three different measures.

GDP(P) is a measure of everything that’s produced in the quarter. The Bureau of Statistics has the unenviable job of adding up most things that are produced at market prices (and having a stab at trying to infer market prices where they are not apparent) in industries as diverse as mining, financial services and education.

It tries to count each thing only once, which is difficult because some things are used as inputs to others. Its work is made harder by relying partly on surveys and partly on complete sets of data from organisations such as the Tax Office.

Ask whether it uses guess work, you will be told it uses “informed judgement”.

GDP(E) is a totalling of government and household expenditure to buy those products. After adjusting for imports and exports it ought to equal GDP(P), but imperfections in measurement mean it usually doesn’t.

Then there’s GDP(I), which is a measure of the income households and businesses get from working and selling those products. Again, it ought to equal the other two, but it usually doesn’t.

After trying to get the three measures nearer each other (perhaps there was something somebody missed) the technicians in the bureau simply average the three, producing GDP(A). That’s what goes up on the ABS website at 11:30am AEDT Wednesday, followed by a Treasurer’s press conference and loads of analysis.

It needn’t indicate an underlying condition

Just as a heart rate monitor needn’t tell us much about health, because even in healthy people hearts beat slower while sleeping and faster while awake, GDP needn’t tell us that much about the condition of our lives.

A lot of the economy went to sleep during this year’s and last year’s lockdowns and is now waking up. The GDP will show that, but at least on Wednesday it won’t tell us more than that.

As it happens, economic growth has been weakening over time. Annual GDP growth is no longer the 3-4% it typically was between the early 1990s recession and the 2008 financial crisis. In the decade leading up to COVID it has been much lower, rarely touching 3%.


Annual financial year GDP growth

Financial year on financial year growth, 2002-03 to 2018-19. ABS

Put starkly, for little-understood reasons unrelated to quarterly fluctuations or COVID, we are getting better off more slowly than we were.

There are always people who say this doesn’t matter, we should be happy with what we had (and as I noted, much of what we’ve had isn’t counted in the GDP).

There is an underlying condition nonetheless

But it matters a good deal, because ever since economic growth took off in the 1870s we’ve grown used to things continually getting better, and have come to expect it.

US economic historian Brad Delong uses an 1880s science fiction book to illustrate how much we’ve come to regard improving living standards as a birthright.

In Looking Backward, Edward Bellamy purports to look back from the year 2000.

At one point a hostess asks if he would like to hear some music. Instead of playing the piano, she merely touched one or two screws and “immediately the room was filled with the music of a grand organ”, one of four she could dial up by landline.

It appeared to him that

if we could have devised an arrangement for providing everybody with music in their homes, perfect in quality, unlimited in quantity, suited to every mood, and beginning and ceasing at will, we should have considered the limit of human felicity already attained, and ceased to strive for further improvements.

He got it wrong.

Peter Martin, Visiting Fellow, Crawford School of Public Policy, Australian National University

This article is republished from The Conversation under a Creative Commons license. Read the original article.

Read more >>