Tuesday, July 30, 2019

There's a reason you're feeling no better off than 10 years ago. Here's what HILDA says about well-being

During the election campaign then-opposition leader Bill Shorten repeatedly claimed that everything was going up.

“Childcare is up 28%, out of pockets to see the doctor up 20%, specialists … up nearly 40%,” he said. And then the punchline: “everything is going up, except your wages.”

Statistically, it wasn’t true. The official rate of inflation was just 1.3%. The official rate of wage growth was 2.3%.

I haven’t asked him, but I wouldn’t be surprised if he kept saying it because his focus groups told him that’s what people felt.

Today’s release of the 17th wave of Australia’s Household, Income and Labour Dynamics Survey (HILDA) tells us that despite the official statistics, people were right to feel they were going backwards.

Funded by the Australian government and managed by the Melbourne Institute of Applied Economic and Social Research, HILDA is one of the most valuable tools Australian social researchers have.

It examined the lives of 14,000 Australians in 2001 and then kept coming back to them each year to discover what had changed. By surveying their children as well, and in future surveying their children, it will be able to build up a long-term picture of how circumstances change over the course of lives and generations.

It can be thought of as Australia’s Seven Up!, the British TV series that keeps going back for updates on the lives of 14 children it first examined when they were seven. Except that HILDA’s results have statistical significance, and the questions are detailed, asking among other things about depression and anxiety, work-life stress, stress in relationships, and illicit drug use.

We are right to feel no better off…

The Australian Bureau of Statistics does indeed find that wages are climbing faster than prices, as they almost always have, but because it doesn’t examine what happens to a particular household over time it can tell us little about whether an individual’s experience of things is getting better or getting worse.

HILDA gets a handle on each household’s disposable income by asking each member of the household about their gross income from wages, benefits, investments and other sources and then deducting its estimate of taxes. It gets a handle on the real (inflation-adjusted) changes by adjusting its totals for changes in the consumer price index.

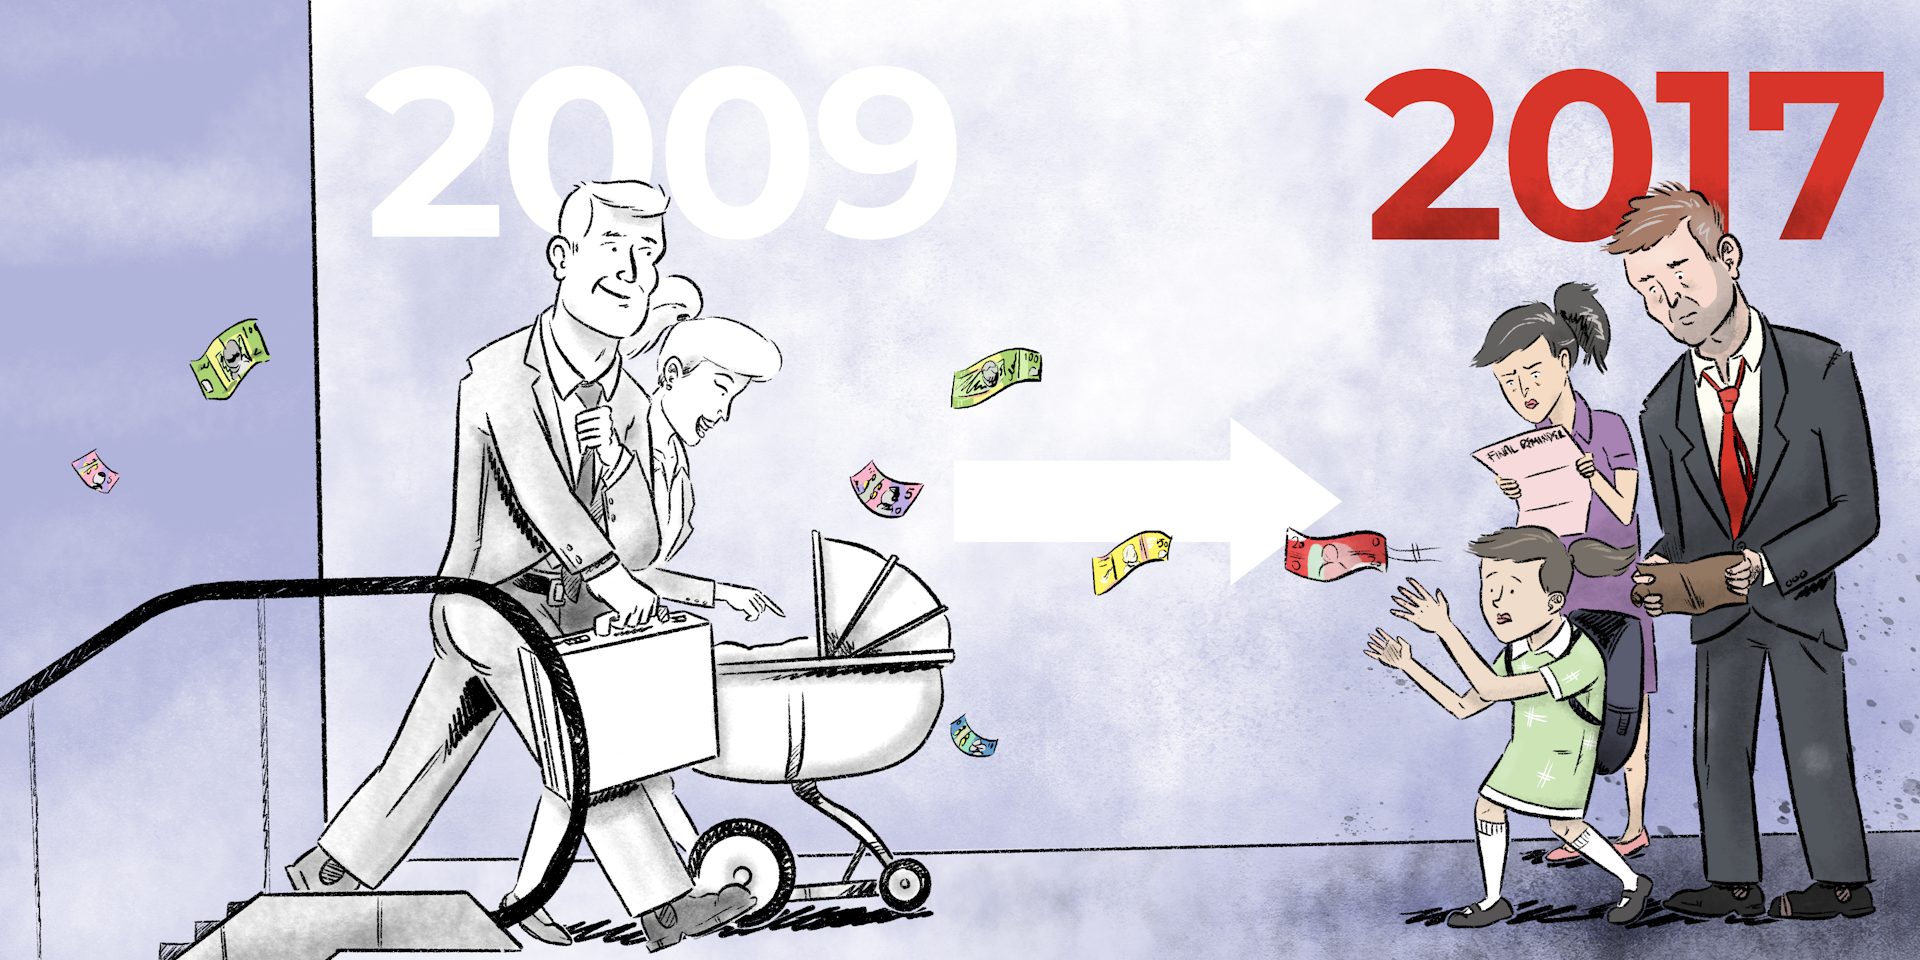
It finds that for the thousands of households it interviewed, real disposable income grew strongly during the first nine years of the survey, between 2001 and 2009. Then, after the global financial crisis, for the eight years between 2009 and the 2017 results released today, that growth stalled.


Expressed in today’s dollars, the average annual real disposable income of those households climbed by A$19,773 between 2001 and 2009, about $2,472 per year.

But most of the growth was during the mining boom that stretched from 2003 to 2009 when the average annual real disposable household income climbed about $3,000 per year, as did the income of the more representative median (or middle) household.

Since 2009 and the global financial crisis, the average and the median have moved in different directions.

The average houshold’s annual real disposable income has climbed a further $3,156. The median (or typical) household’s income has fallen $542, although not steadily. The graph shows it falling between 2009 and 2011, climbing in 2012, and changing little thereafter.

…and as if it’s harder to get ahead…

It has also become harder to “get ahead”, in the phrase used often by the prime minister.

Between 2001 and 2005, 40% of the households in the bottom fifth of earners (the bottom qunitile) moved out of it into a higher one. In more recent years, between 2012 and 2016, a lower 38.5% moved up.

Between 2001 and 2005, 44% of the households in the top qunitile had to move down to let other households take their place. In more recent years, between 2012 and 2016, only 41.5% have moved down.

Getting a long way out of the income circumstances you were born in is a long-shot, according on HILDA’s early attempt at measuring intergenerational mobility.

People who were 32-34 years old in 2015-17 are highly likely to be in the same household income quintiles as those people found themselves in when they were 15-17 back in 2001-03.


There’s only a one in ten chance of moving from the bottom quintile as a teenager to the top quintile in your early thirties. There’s a 37% chance you’ll stay put.

Even among teenagers who grew up in the middle quintile, there’s only a 17% chance of making it to the top, along with a 19% chance of moving one rung up.

Interestingly, women turn out to be more tied to the income their families had when they were children than men, and both men and women tend to stay more closely tied to their mother’s income than their father’s.

…yet we are less reliant on welfare, even pensions…

When HILDA began in 2001, 39% of Australians aged 18 to 64 were living in a household that received government welfare of some kind. By 2017, that proportion had fallen to 31%, but almost all of the drop happened before the global financial crisis in 2009.

Most of us are still in households that have received something from the government over a 10-year period: 58% of working age Australians in 2017, down from 64% in 2010.

Among older Australians aged 65 and over, reliance on the age pension and other benefits for more than half of income needs has dropped from 60% to 51%.

Among new retirees aged 65 and over, the proportion receiving the age pension has fallen from 76% of men and 74% of women to just 60% of men and 55% of women.


Read more: More people are retiring with high mortgage debts. The implications are huge


But while the growth of compulsory superannuation is likely to be part of the story, almost all of the decline happened before the financial crisis in 2009, suggesting that the destruction of wealth in the crisis kept people on the pension who otherwise might not have needed it.

…and gender roles are changing

Before the financial crisis, almost three quarters (73%) of men of traditional working age were employed full-time. After the crisis, the rate slipped to a much lower 67% and stayed there.

Female full-time employment was also hit by the crisis but has since almost totally recovered to be just a fraction below its pre-crisis peak of 39.6%.

Women’s hourly earnings are also climbing faster than men’s, up 24% between 2001 and 2017, compared to 21% for men’s.

While women have always been more likely than men to be employed casually, since the crisis male casual employment has climbed while female casual employment has declined.

The two are now as close as they have ever been, with women now only six percentage points more likely than men to be employed causally.


Read more: HILDA findings on Australian families' experience of childcare should be a call-to-arms for government


In dual-earner male-female couples, the proportion in which the woman earns more than the man has climbed from 22% to 25%.

The woman being the main breadwinner is more common in couples that aren’t legally married and don’t have children. It is also far more common in the regions than in cities and among couples in which the man doesn’t have a university degree.

Men in predominantly female breadwinner households are somewhat less happy with their lives and with their relationships, as (perhaps surprisingly) are women.

Fathers tend to agonise more about work-family conflict than mothers, notwithstanding the much greater amount of housework and childcare work performed by mothers. The men who worry the most work long hours, have irregular shifts and very young children. A mother working the same hours as a father will typically be more conflicted.


Read more: Language of love: a quarter of Australians are in inter-ethnic relationships


Most parents suffering high work-family conflict get out of it within a year or two, often by managing things better and sometimes by changing jobs. Those suffering high work-family conflict are 50% more likely than others to separate the next year.

HILDA’s great strength is that it will be able to follow those parents and their children and all the other families it surveys and tell us what happens next. Rather than being an Australian version of Seven Up!, it might be better described as Australia’s never ending story. Its co-director Roger Wilkins says its design allows it to be “infinitely lived”.


Read more: Australian city workers' average commute has blown out to 66 minutes a day. How does yours compare? The Conversation


Peter Martin, Visiting Fellow, Crawford School of Public Policy, Australian National University

Wes Mountain/The Conversation, CC BY-ND

This article is republished from The Conversation under a Creative Commons license. Read the original article.

Read more >>

Sunday, July 14, 2019

They've cut deeming rates, but what are they?

Treasurer Josh Frydenberg has cut the deeming rate for large investments from 3.25% to 3%, and for smaller ones from 1.75% all the way down to 1%.

The cuts are backdated, to the start of July.

But what exactly is a deeming rate, and why does it matter so much to about one million Australians on benefits, among them around about 630,000 age pensioners?

It’s a topic I covered in The Conversation mid last week in an explainer that went all the way back to the beginning, or at least the most recent beginning, when treasurer Paul Keating brought deeming rates back to Australia’s benefits system in 1991.


Read more: Deeming rates explained. What is deeming, how does it cut pensions, and why do we have it?


Before that, applicants for the pension were able to pass income tests by ensuring that their assets didn’t earn much income, a service banks and other institutions were happy to provide for them.

From 1991, on applicants for the age pension (and later other benefits) were “deemed” to have earned from their financial assets amounts set by the government, whatever they actually earned.

Of late, deeming rates haven’t kept up

For most of the past two decades both the high deeming rate (which at the moment applies to financial assets in excess of A$51,800 for singles and $86,200 for couples) and also the low deeming rate (for lesser assets) have been below the Reserve Bank’s cash rate, benefiting applicants who could earn more than those low rates while continuing to get benefits.


Deeming rates versus RBA cash rate, July 1996 - July 2019, per cent


Then, beginning with prime minister Kevin Rudd (who, to be fair to him, in 2009 delivered the biggest ever increase in the pension – $100 a fortnight for singles and $76 for couples) and continuing under his successors Gillard, Abbott, Turnbull and Morrision, the government adjusted the deeming rate more slowly, meaning that as the Reserve Bank’s cash rate fell, both the high and low deeming rates ended up above it.

The decisions announced by Frydenberg on Sunday go a long way to putting things right.

The lower deeming rate will once more be close to the cash rate (exactly at the cash rate, for as long as the cash rate stays at 1%). The higher deeming rate will not be, but then it probably shouldn’t be.

The higher rate applies to the return on financial assets (including shares) worth more than $51,800.

As Frydenberg pointed out on Sunday, many of those assets return much more, not much less, than the deeming rate:

It could apply to superannuation returns, and that’s averaging around 5.5%. Or to yields on ASX 200 stocks, which are averaging about 4.5%

The low deeming rate is on the face of it unfair, because few bank deposits pay 1%. The special retirees accounts offered by ANZ and the Commonwealth pay 0.25%. Many deposit accounts pay nothing.

But the low rate applies to financial assets all the way up to $51,800 ($86,200 for couples), and to all types of assets. Many pension applicants are likely to earn a total return on those assets well above 1%.

Deeming is by design, rough and ready. There will always be complaints, and of late those complaints had force. They are now back broadly where they should be.


The Conversation

Peter Martin, Visiting Fellow, Crawford School of Public Policy, Australian National University

This article is republished from The Conversation under a Creative Commons license. Read the original article.

Read more >>

Thursday, July 11, 2019

Deeming rates explained. What is deeming, how does it cut pensions, and why do we have it?

Now it’s the Coalition that’s being accused of a “retiree tax”.

As interest rates have come down over the past four years, the rate that retirees are “deemed” to have earned for the purpose of the pension income test hasn’t budged, meaning that although retirees have been earning less (in some cases a good deal less), they haven’t been getting more access to the pension.

Depending on how you look at it, it’s either been making a mockery of the idea of an income test, or making the test more restrictive.

So how did it happen? Why is income “deemed” rather than actually measured when determining eligibility for government benefits, and is the system hopelessly compromised?

It’s important to understand what deeming is and where it came from if we are to understand the debate that will ensue when the government completes its review of the deeming rate in the next few weeks.

Where did deeming come from?

Modern day deeming was introduced by former prime minister Paul Keating in his final budget as treasurer in 1990.

As he explained in that budget speech:

many pensioners still disadvantage themselves by holding their savings in accounts that pay little or no interest

He was being diplomatic. It was widely believed that many retirees deliberately earned low rates on their savings in order to qualify for the pension or get a bigger pension. It cost the government money (while making the banks money) and it cost many of the pensioners money, because they lost more in interest than they gained in pension – although for those that used low earnings to ensure they at least got some pension, the associated benefits cards made it worth it.

From March 1991 cash and deposits were to assumed to be earning at least 10%, whatever they actually earned. If they earned more than 10% they were treated as earning more.

Except for the first A$2000. That was treated as earning only what it did, because many pensioners held small savings in low interest accounts for day to day purchases.

How has it changed?

Deeming is different today. It applies to more assets, including gold,
managed investments, superannuation account-based income streams and listed shares; and it is used to assess eligibility for more benefits, including veterans and disability pensions.

And it’s no longer a win-win for the government. If someone earns more than the deeming rate, their income is assessed at only the deeming rate.

In the words of the department of human services:

if your investment return is higher than the deemed rates, the extra amount doesn’t count as your income

There are two rates: one for the first $51,800 of financial assets (for a couple, the first $86,200) which is currently 1.75%, and the other for those assets in excess of that amount, which is currently 3.25%.

The threshold climbs in line with the consumer price index each July.

(In its first budget in 2014 the Abbott government tried to cut the threshold to $30,000 for singles and $50,000 for couples but was thwarted by the Senate.)

We deem by whim…

But there’s nothing automatic about setting the rates. It’s up to the government (specifically the minister for families and social services) to adjust them, or not, as it sees fit.

Both the high and low deeming rate used to be below the Reserve Bank’s cash rate (with the low rate typically 1.5 to 2 percentage points below the high rate), but after the cash rate dived in 2016 they have been left above it, in the case of the low rate, for the first time ever.

The high deeming rates mean many applicants are being means tested on income they haven’t received.


Deeming rates versus RBA cash rate, 1996 - 2019, per cent


…leaving rates curiously out of whack

Back when the deeming rates were lower relative to deposit rates, each of the big four banks offered “deeming accounts” that paid the deeming rates.

Today none of them do. They are not allowed to call accounts deeming accounts unless they pay the deeming rate, so instead they have retitled them “retirement accounts”.

The National Australia Bank’s retirement account (closed to new customers) pays just 0.20% for the first $10,000, well below the lowest deeming rate of 1.75%. The ANZ and the Commonwealth pay 0.25%. Westpac pays 0.3%. If you have more than $250,000 on deposit it pays 1.5% on the part above $250,000, which is still lower than the lowest of the two deeming rates.


Read more: Why pensioners are cruising their way around budget changes


Labor believes that not cutting deeming rates since 2015 has saved the government more than $1 billion per year in pension payments. It’s a significant portion of the $7.1 billion surplus it has forecast for 2019-20.

That is probably why the government has said it will take its decision about rates to its expenditure review committee, in what amounts to an admission that those decisions have as much to do with government finances as they do with treating applicants for pensions fairly.

There’s actually a case for extending deeming

As unrealistic as deeming rates have become, there’s a case for extending their use.

At the moment applicants for the pension face two means tests: one for assets and one for income.

Both the Henry Tax Review and the Abbott government’s National Commission of Audit recommended replacing them with a “merged means test” of the kind Australia had up until the 1970s.

Instead of an assets test, all assets would be deemed to earn a prudent rate of return; among them cars, holiday homes, investment properties, and high-value family homes.

The Commission put the case this way:

Exempting the principal residence from the means test is inequitable as it allows for high levels of wealth to be sheltered from means testing. For example, under current rules a single person who owns a $400,000 house and has $750,000 in shares ($1.15 million in total assets) would not be eligible for the pension, while a similar person with a principal residence worth $2 million and $100,000 in shares ($2.1 million in total assets) would be able to claim a pension at the full rate.

It’s a worthwhile idea whose time might come, but it is unlikely to come while deeming rates are seen to be unfair and capriciously set.

The government has an opportunity to restore confidence in deeming and pensions. The decisions it is about to make will show how important it thinks that is.


Read more: Words that matter. What’s a franking credit? What’s dividend imputation? And what's 'retiree tax'? The Conversation


Peter Martin, Visiting Fellow, Crawford School of Public Policy, Australian National University

This article is republished from The Conversation under a Creative Commons license. Read the original article.

Read more >>

Wednesday, July 03, 2019

Ultra-low unemployment is in our grasp. How Philip Lowe became the governor who lifted our ambition

Rarely does a Reserve Bank governor get to remake Australia.

HC “Nugget” Coombs, the first Reserve Bank governor, did.

As director general of the Department of Post-War Reconstruction from 1943, he was instrumental in creating the White Paper on Full Employment in Australia that was adopted as a guide by prime ministers from Chifley to Menzies to Whitlam.

He ensured the objective of full employment became part of the charter of the Reserve Bank when he became its first governor in 1960, moving over from the then government-owned Commonwealth Bank, which had performed the Reserve Bank’s functions up to then.

After once again cutting interest rates to a new record low at a special Reserve Bank board meeting in Darwin on Tuesday, his latest successor Philip Lowe will travel to Yirrkala in Arnhem Land to visit the site where some of the Coombs ashes were buried.

HC Coombs gave us full employment

On Tuesday night in Darwin, he paid tribute to Coombs. He said that in his dual roles as governor of the Reserve Bank and chair of the Council for Aboriginal Affairs, he was a strong advocate for land rights and the preservation of cultural values and traditions.

Another governor who remade Australia was Bernie Fraser, head of the treasury when Prime Minister Paul Keating made him governor of the Reserve Bank in 1989 – shortly before Australia plunged into recession.

He cut rates dramatically from early 1990, as might have been expected in order to bring about a recovery. But then, well before the recovery was complete (and the unemployment rate was still about 10%), he stopped cutting and started pushing rates back up – much to Keating’s displeasure.

Bernie Fraser gave us low inflation

His rationale appears to have been to salvage something out of the unusual circumstances in which Australia found itself. With inflation on the ropes because of the recession, he decided to keep it there – to squeeze out high inflation forever. With one temporary exception during the introduction of the goods and services tax in 2000 it never again returned to the rates of 5% or more that had been common.

He did it not because of an unusual opportunity, and changed Australia forever.

And so to Philip Lowe, who on Tuesday night in Darwin indicated that he too was taking advantage of an unusual opportunity and would probably change Australia forever.

Until a few years ago, it was thought that Australia’s rate of “full unemployment” – the rate below which unemployment couldn’t stay without stoking inflation – was touch over 5%. As it has fallen to 5% in the past year without stoking either inflation or much-wanted wage growth, the bank has come to revise its view.

It now thinks something has changed and the “full employment” is probably 4.5% or lower, a low that was reached during the peak of the mining boom but hasn’t been sustained since the early 1970s. Aiming for an unemployment rate of 4.5% instead of 5% would get 69,000 more people into work.

Lowe wants unemployment lower

Lowe could have ignored the opportunity to push unemployment down that far, to a low that hasn’t been sustained since the 1970s. Instead, in Darwin on Tuesday night, he embraced the opportunity, saying his board was:

prepared to adjust interest rates again if needed to get us closer to full employment and achieve the inflation target in a way that supports the collective welfare of all Australians

Governor Lowe plans to usher in the lowest unemployment target in half a century. He believes the economy can sustain it. He said several times on Tuesday that he would prefer the government to help out with infrastructure projects and the like, but if it won’t, he is “prepared to adjust interest rates again if needed to get us closer to full employment”.

He is doing it because the opportunity is there, as did Coombs and Fraser before him.

There’s no telling (yet) how far rates will have to fall to achieve it. Without setting out to, Lowe is remaking Australia.


Read more: Buckle up. 2019-20 survey finds the economy weak and heading down, and that's ahead of surprises The Conversation


Peter Martin, Visiting Fellow, Crawford School of Public Policy, Australian National University

This article is republished from The Conversation under a Creative Commons license. Read the original article.

Read more >>