Showing posts with label inequality. Show all posts

Wednesday, June 09, 2021

Other Australians earn nothing like what you think. If you're on $59,538, you're typical

I’m guessing you earn less than A$200,000.

And I’m guessing you think you’re missing out. People keep telling you so.

On one side of politics Labor leader Anthony Albanese says anyone earning $200,000 dollars a year “can’t be described as being in the top end of town”.

On the other, Prime Minister Scott Morrison parries with interviewers when asked whether people on $180,000 to $200,000 (the biggest beneficiaries of his planned 2024 Stage 3 tax cut) are “high income”.

“They’re hardworking people working out on mines and difficult parts of the country,” he says. “They deserve a tax cut.”

Hardworking or not, Australians on more than $200,000 are rare. And an awful lot of them don’t work at all.

$200,000 is unusual

I’ve never quite understood why politicians are so keen to tell us such incomes are normal. It might be because they are on them. Each backbencher gets $211,250 plus a $32,000 electorate allowance (boosted by $19,500 if they turn down the use of a private-plated vehicle) plus home internet and travel allowances.

Very detailed tax office figures (updated on Monday) tell us what the rest of us earn, all 14.3 million of us.

Only 2% of those required to pay tax earned more than $211,365. Only 3% earned more than $188,667.

Everyone else — the other 97% — earned less than $188,667, most of them a good deal less, and many more earned even less and weren’t required to pay tax.

The typical taxable income (typical in the sense that half earned more than it, half less) was $59,538. If that’s what you’re on, you’re more likely to find people who earn close to what you do than anyone who earns more or less.

We can get an idea of how lonely it is at the top by examining the top 1%, those Australians with a taxable income of greater than $350,134.

There aren’t many of them, just 110,613 — 82,258 men and 28,355 women.

Only 39,209 have taxable incomes of more than $500,000, and of these only 14,467 have taxable incomes of more than $1 million.

Life at the top needn’t be taxed

You’re probably thinking there’s a difference between taxable incomes and actual incomes, and the tax office figures show you’re right.

15,358 Australians reported total incomes of more than $1 million. By the time they had applied legitimate tax deductions, the number had shrunk to 14,467.

Some of these million-dollar earners were able to shrink their taxable incomes very low indeed. 45 cut their taxable incomes to less than the tax-free threshold of $18,200 — meaning they didn’t have to pay anything, not even the Medicare levy.

Another eight managed to escape the Medicare levy even though their taxable incomes were above $18,200, and another 21 escaped income tax while paying the Medicare levy.


Read more: Yes, some millionaires pay no tax, but crimping deductions mightn't help


Many of these millionaires weren’t “hardworking” in the sense Morrison meant. Only 9,144 of the 14,467 Australians on taxable incomes of more than $1 million worked. Only 17,883 of the 57,120 Australians on more than $250,000 worked.

Only nine of the 45 million-dollar earners who cut their taxable incomes to less than the tax-free threshold worked. 27 received so-called franked dividends from companies that had paid tax, enabling them to cut their own tax bills or receive rebates from the tax office. On average, each received dividends of $2.25 million.

Many who aren’t taxed are generous

Seventeen of the 45 million-dollar earners received capital gains, on average $6.4 million each. 38 received interest, averaging $290,000 each.

Against that were set expenses, small and large. Three claimed for work-related car expenses averaging $27,340 each, 13 claimed expenses averaging $57,200 for assistance with tax affairs, eight claimed for previous losses from farms averaging $684,000 each, and eight for losses from other businesses averaging $408,000.

But by far their biggest expense was donations. 14 gave away a total of $161 million in gifts or tax-deductible donations — an extraordinary average of $11.5 million each.

Most of us aren’t like these people.

Most of us claim more modest deductions

Three-quarters of Australians in the tax system earn less than $89,173.

Those on that income typically claim between $1,500 and $1,900 in deductions (men claim more than women) and, thanks to negative gearing, claim losses on properties of between $1,800 and $2,600 (again, men claim more than women).

Such Australians typically report between $1,200 and $2,100 in capital gains (more for women than for men).

If higher-earning Australians are unaware of how most of us live, it’s understandable. Surgeons mix with other surgeons. On average each of Australia’s 4150 surgeons earns $394,303, making surgery our highest-paying occupation.

We mix with, and marry, people like us

And they increasingly marry each other. In 2010 the Productivity Commission found that 68% of Australia’s high earners were married to other high earners. A decade earlier it was 49%.

And high earners live near each other. The average income in Sydney’s Double Bay (Australia’s highest-earning suburb) is $202,598. The average income in Ruse in Sydney’s Campbelltown is $55,100.

People in Double Bay don’t drive through Ruse on their way to the city.


Read more: The Low and Middle Income Tax Offset has been extended yet again. It delivers help neither when nor where it's needed


In the United States it is often the other way around. There, low-income suburbs are more likely to be near the city, meaning that high-income Americans at least see them as they go in to town.

That most of us have little idea of what others earn suits those in charge when they propose tax cuts skewed to high earners.

They can con us that most of us will be better off, and those on high incomes can con themselves they are not already better off.

Peter Martin, Visiting Fellow, Crawford School of Public Policy, Australian National University

This article is republished from The Conversation under a Creative Commons license. Read the original article.

Read more >>

Wednesday, March 31, 2021

The true cost of the government’s changes to JobSeeker is incalculable. It’s as if it didn’t learn from Robodebt

Poor people are different to rich people, and not only in the amount of money they’ve got. They are also different in something that flows from it.

It’s (lack of) ease. And the consequences can be severe.

Economist Sendhil Mullainathan and psychologist Eldar Shafir outline these in their book Scarcity: Why Having So Little Means So Much.

They asked shoppers at a New Jersey mall to take part in a so-called fluid intelligence test. Fluid intelligence is problem-solving ability unrelated to language or knowledge.

The test is usually presented as a series of eight images, each different from the one before, followed by an invitation to guess the ninth.


What’s in the missing box?

Raven’s Progressive Matrices test. LifeofRiley/Wikipedia. CC BY-SA 3.0

It’s usually pretty easy. And it was indeed easy for the first half of the shoppers they tested. Comparing the scores against self-reported income, the researchers found no significant differences – “the rich and poor looked equally smart”.

Just before they presented the first half of shoppers with the test, they also presented a hypothetical scenario:

Imagine that your car has some trouble, which requires a $300 service. Your auto insurance will cover half the cost. You need to decide whether to go ahead and get the car fixed, or take a chance and hope that it lasts for a while longer. How would you go about making such a decision?

For the second half of shoppers they presented the same scenario with just one change. Instead of the car service costing $300, it cost $3,000.

The one simple change had a remarkable effect on the test results of just one group of shoppers – those on low incomes. Although completely fictional, the scenario got them thinking about how they couldn’t afford a $3,000 bill from out of the blue. They mightn’t know where to find the money.


Read more: What happens when you free unemployed Australians from 'mutual obligations' and boost their benefits? We just found out


Instead of performing as well as the high earners (which low earners had done without the $3,000 prompt) they did dramatically worse. Their mental impairment was as bad as if they had lost an entire night’s sleep.

Stress is costly when ends can’t meet

The researchers have replicated the results time and time again. Even when they pay for correct answers (which might be expected to incentivise low earners more than high earners) low earners can’t concentrate enough to do well.

The authors’ conclusion is that it is incumbent on authorities not to send such people over the edge – not to make them fill in multi-page forms or reapply for assistance or attend recurring pointless meetings, and not to send them unexplained unpayable bills out of the blue – not to do anything that will remind them of how their finances don’t really allow them to cope.


Read more: The bad bits of ParentsNext just came back


When that happens, when what Mullainathan and Shafir call mental bandwidth is flooded, it is hard to think properly about things such as caring for children and getting work.

Australia’s treasury gets it. Its well-being framework sets out five points it believes should be considered in designing programs and policies. Point five is the cost to individuals of “dealing with unwanted complexity”.

Not so treasury’s political masters. When on Thursday the government boosts JobSeeker by a meagre $25 a week, it will cut the amount job seekers actually receive by a net $50 per week because of the end of the coronavirus supplement.

Mutual obligations impose stress

To offset that generosity – the first real increase in the base rate in 30 years – from April 1 it will ramp up its “mutual obligation” requirements. Job seekers will have to show they have applied for 15 jobs a month, climbing to 20 jobs a month on July 1 – that’s a fresh application every working day.

Failures will attract demerit points. Too many demerits and payments will be stopped.

There will be increased auditing of job applications to ensure they are “genuine”, a return to the compulsory face-to-face meetings suspended during the pandemic, and a dob-in line for employers to report job seekers they think aren’t genuine.

That this will dangerously ramp up stress on the people most susceptible to it, and make it hard for them to do things such as care for their children, ought not to surprise the government.

It has been considering the three-volume report of its Productivity Commission inquiry into mental health for nine months.

The report says stringent mutual obligation requirements might do more than stress those who take part — they might precipitate “clinically defined mental illness in previously well participants”.

For people with preexisting problems, “sound reasons and plausible evidence suggest this could aggravate their illness”.

The government ought to have learnt from repeated mistakes.

A Senate inquiry found the compliance measures associated with its ParentsNext program caused “anxiety, distress and harm”. Post-pandemic, it reinstated those compliance measures.

Robodebt should have been a wakeup call

Its unsolicited “robodebt” demands for repayments of thousands of dollars per recipient the Federal Court found was not owed caused what another Senate inquiry found to be “breakdown, anxiety, depression requiring medication, sleeplessness, stress causing physical illness, and fear”.

The ministers who announced the program in 2016 were Scott Morrison (then treasurer) and Christian Porter (then social services minister).


Read more: Robodebt was a fiasco with a cost we have yet to fully appreciate


They promised that smarter use of technology would “better manage our social welfare system to ensure that every dollar goes to those who need it most” and predicted it would save the budget $2 billion.

The kindest thing that can be said about what happened is that they didn’t follow through with the details, at considerable human cost.

It would be great to see something – anything – that made it look as if, five years on, they have learned from what happened.

Peter Martin, Visiting Fellow, Crawford School of Public Policy, Australian National University

This article is republished from The Conversation under a Creative Commons license. Read the original article.
Read more >>

Tuesday, July 30, 2019

There's a reason you're feeling no better off than 10 years ago. Here's what HILDA says about well-being

During the election campaign then-opposition leader Bill Shorten repeatedly claimed that everything was going up.

“Childcare is up 28%, out of pockets to see the doctor up 20%, specialists … up nearly 40%,” he said. And then the punchline: “everything is going up, except your wages.”

Statistically, it wasn’t true. The official rate of inflation was just 1.3%. The official rate of wage growth was 2.3%.

I haven’t asked him, but I wouldn’t be surprised if he kept saying it because his focus groups told him that’s what people felt.

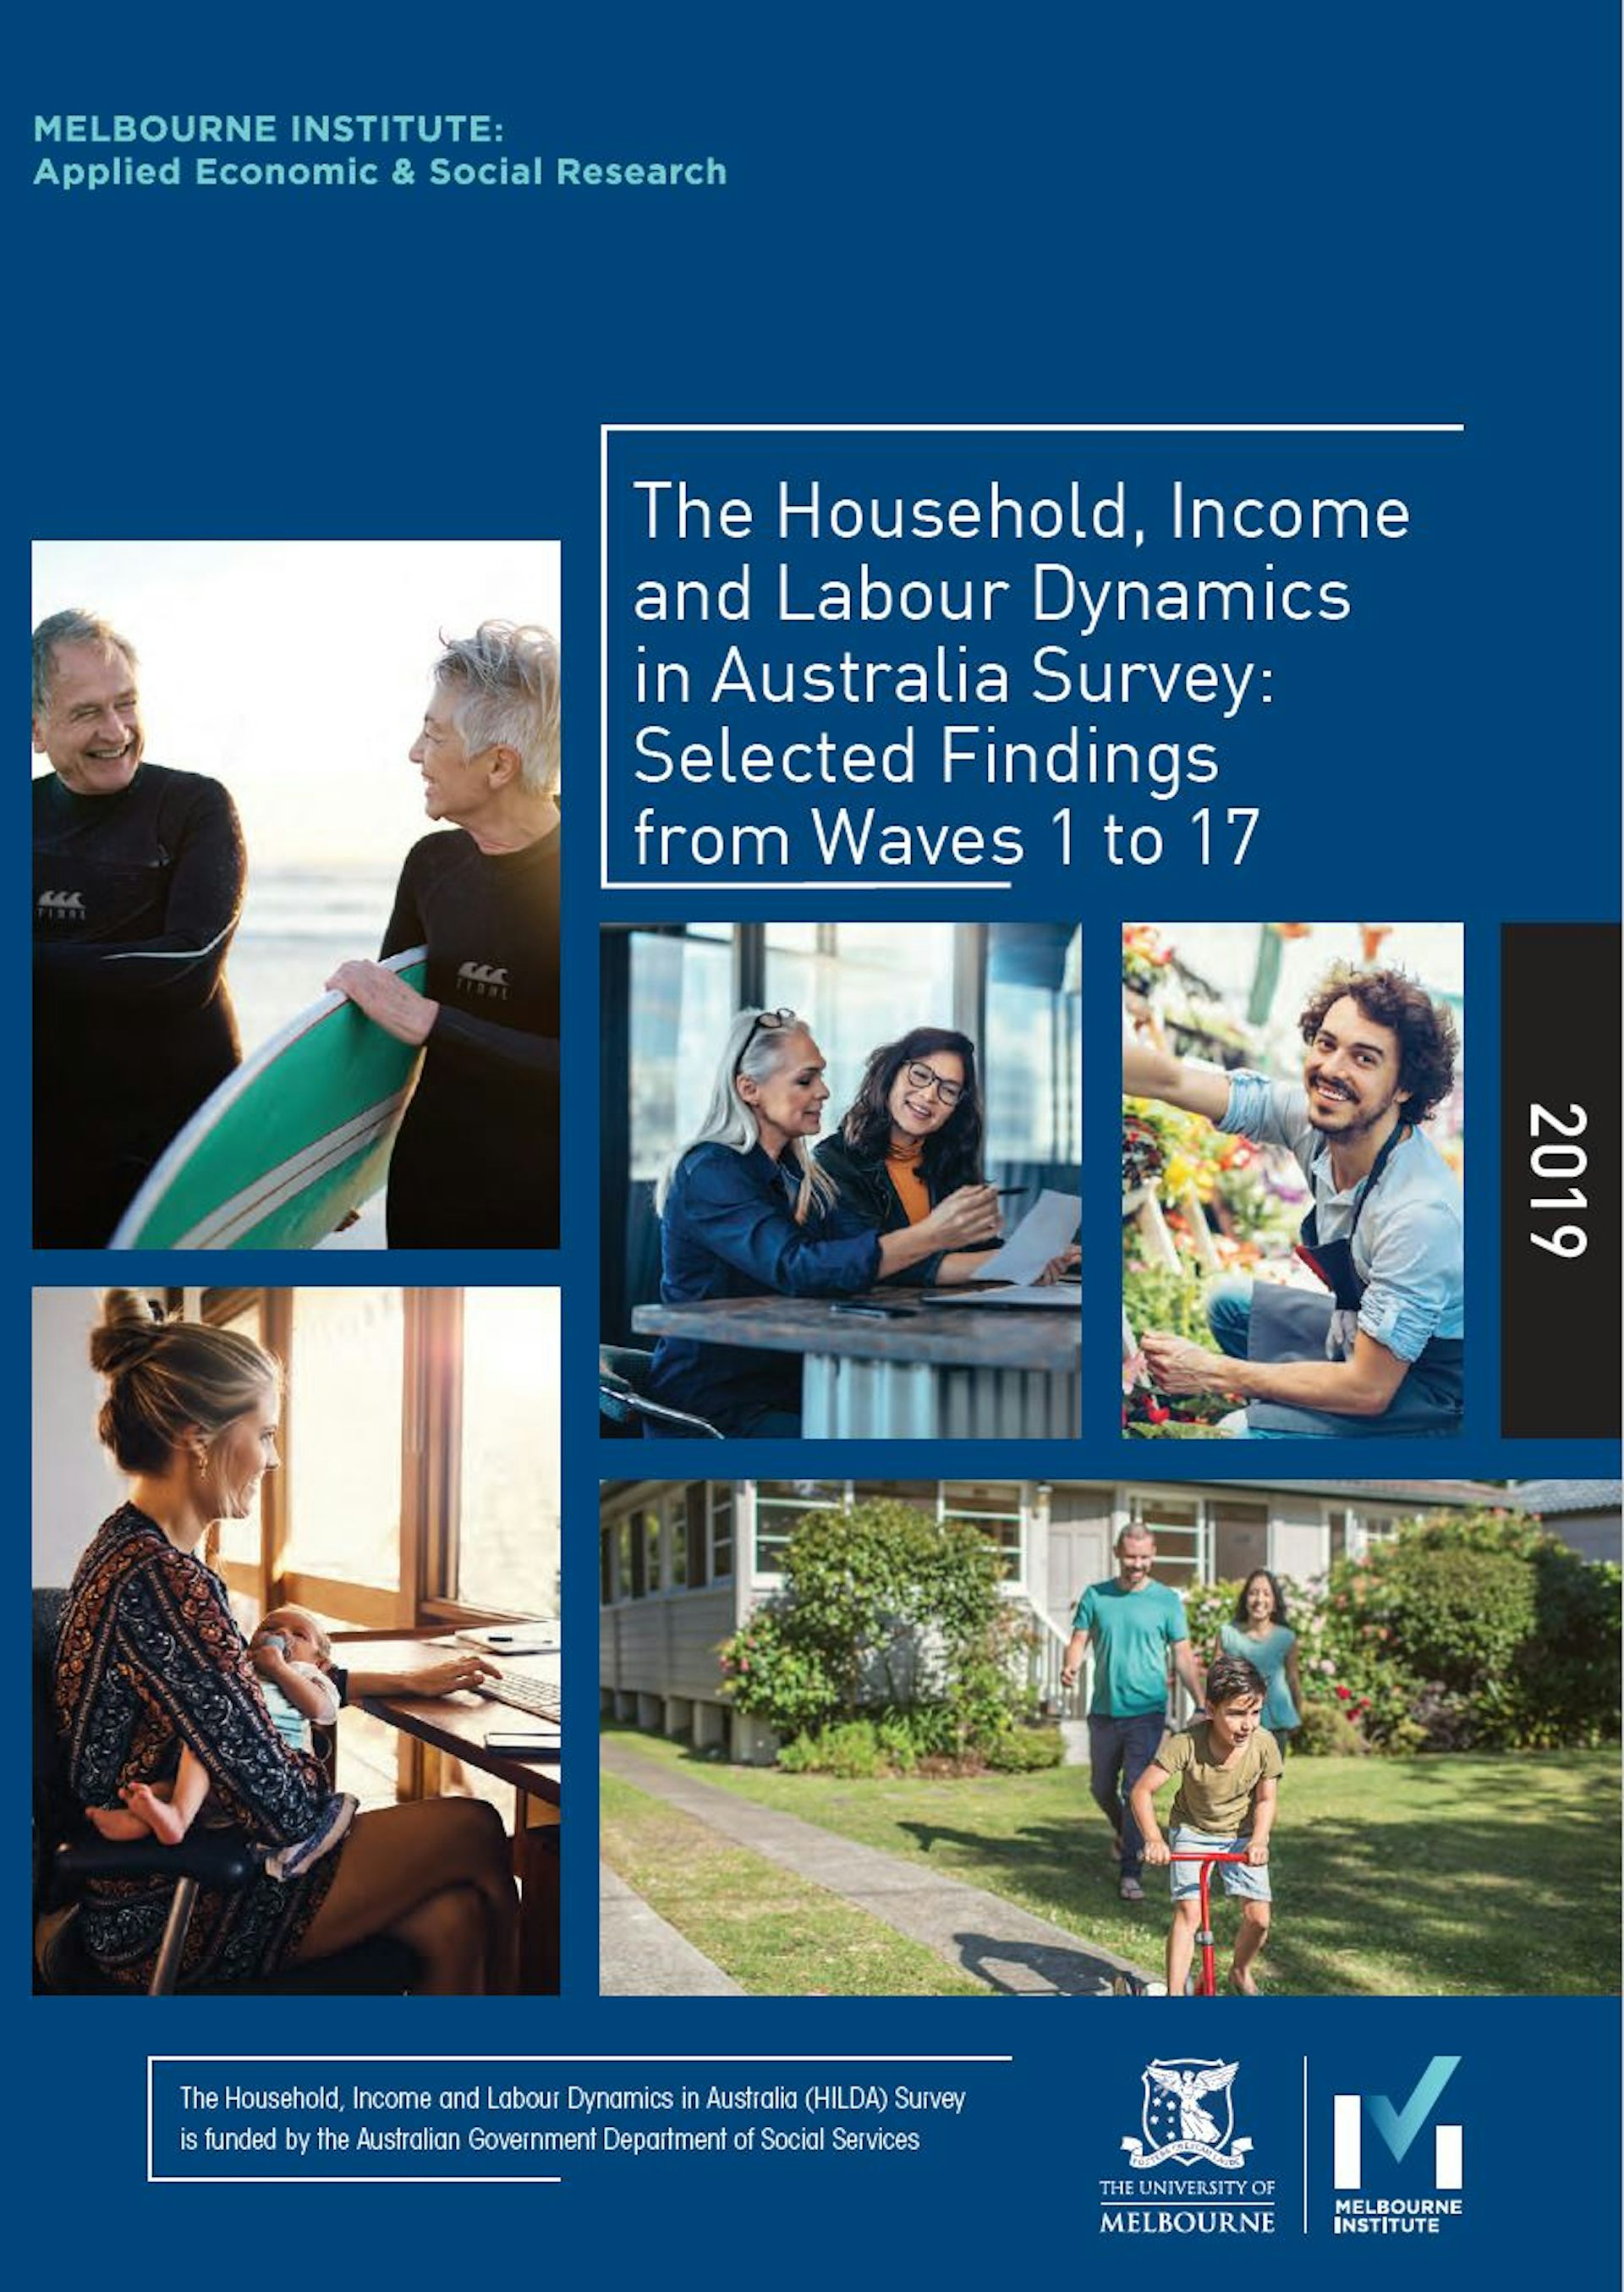
Today’s release of the 17th wave of Australia’s Household, Income and Labour Dynamics Survey (HILDA) tells us that despite the official statistics, people were right to feel they were going backwards.

Funded by the Australian government and managed by the Melbourne Institute of Applied Economic and Social Research, HILDA is one of the most valuable tools Australian social researchers have.

It examined the lives of 14,000 Australians in 2001 and then kept coming back to them each year to discover what had changed. By surveying their children as well, and in future surveying their children, it will be able to build up a long-term picture of how circumstances change over the course of lives and generations.

It can be thought of as Australia’s Seven Up!, the British TV series that keeps going back for updates on the lives of 14 children it first examined when they were seven. Except that HILDA’s results have statistical significance, and the questions are detailed, asking among other things about depression and anxiety, work-life stress, stress in relationships, and illicit drug use.

We are right to feel no better off…

The Australian Bureau of Statistics does indeed find that wages are climbing faster than prices, as they almost always have, but because it doesn’t examine what happens to a particular household over time it can tell us little about whether an individual’s experience of things is getting better or getting worse.

HILDA gets a handle on each household’s disposable income by asking each member of the household about their gross income from wages, benefits, investments and other sources and then deducting its estimate of taxes. It gets a handle on the real (inflation-adjusted) changes by adjusting its totals for changes in the consumer price index.

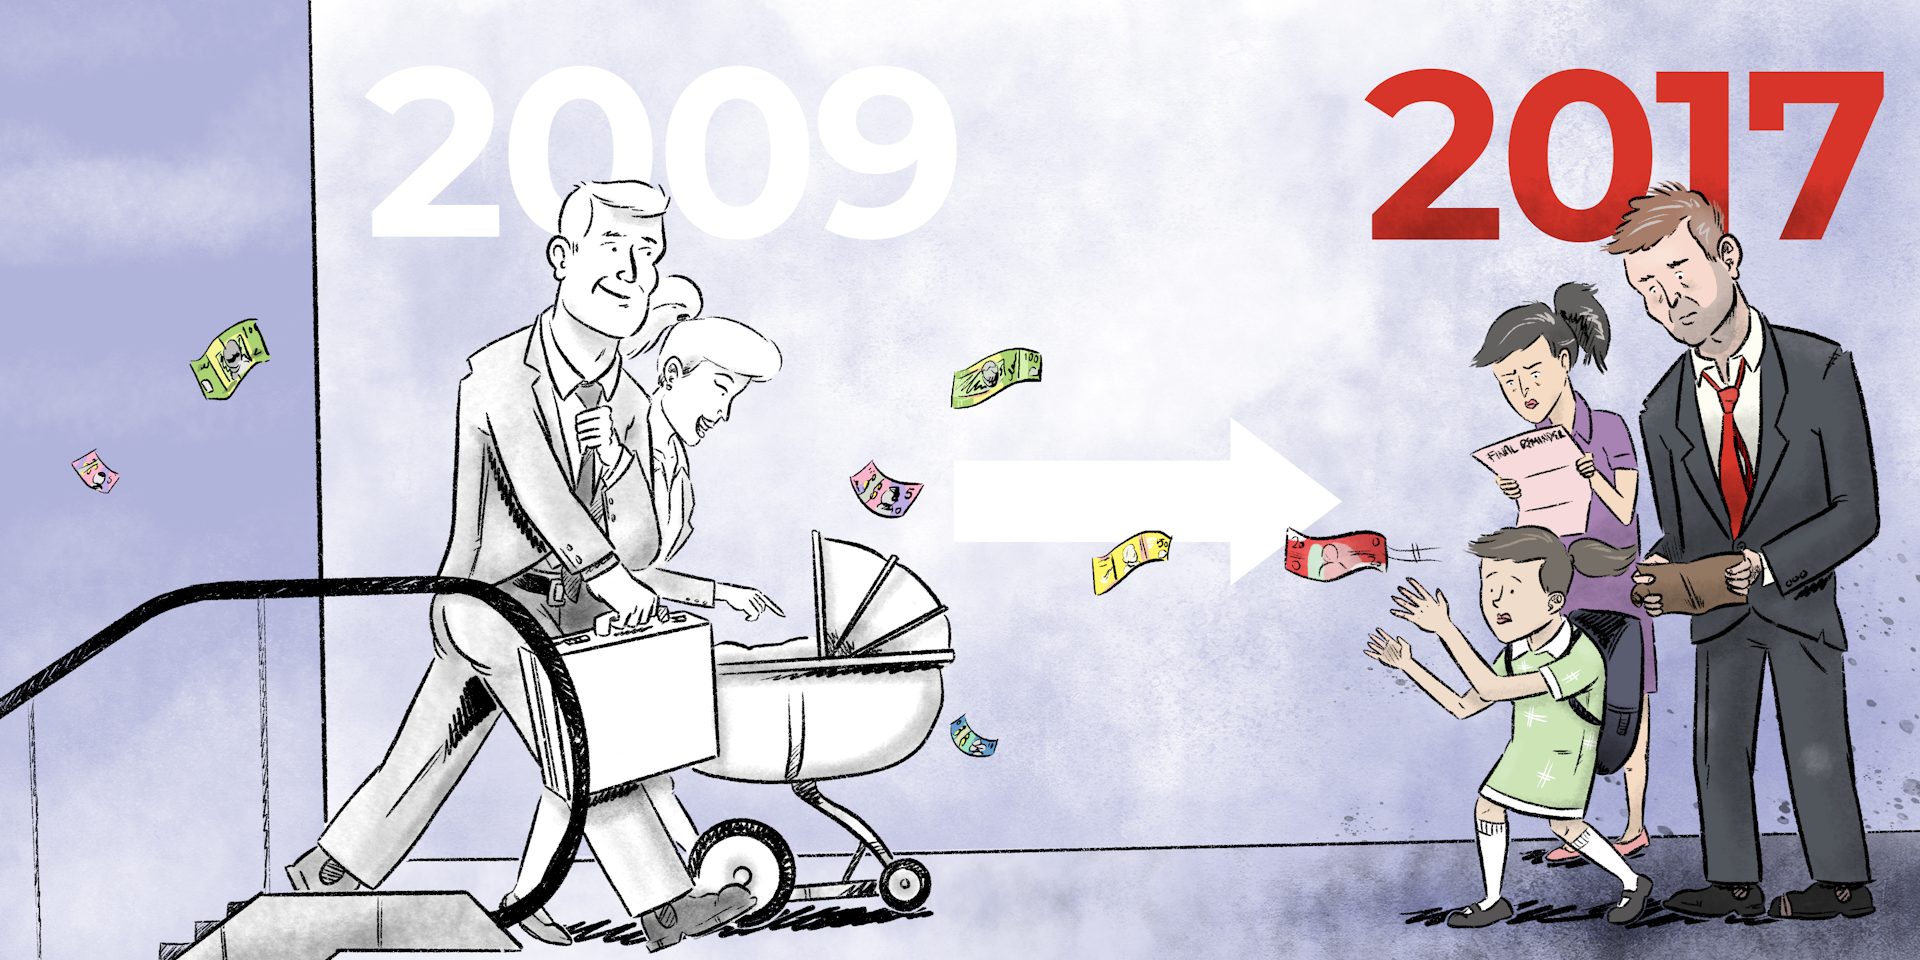
It finds that for the thousands of households it interviewed, real disposable income grew strongly during the first nine years of the survey, between 2001 and 2009. Then, after the global financial crisis, for the eight years between 2009 and the 2017 results released today, that growth stalled.


Expressed in today’s dollars, the average annual real disposable income of those households climbed by A$19,773 between 2001 and 2009, about $2,472 per year.

But most of the growth was during the mining boom that stretched from 2003 to 2009 when the average annual real disposable household income climbed about $3,000 per year, as did the income of the more representative median (or middle) household.

Since 2009 and the global financial crisis, the average and the median have moved in different directions.

The average houshold’s annual real disposable income has climbed a further $3,156. The median (or typical) household’s income has fallen $542, although not steadily. The graph shows it falling between 2009 and 2011, climbing in 2012, and changing little thereafter.

…and as if it’s harder to get ahead…

It has also become harder to “get ahead”, in the phrase used often by the prime minister.

Between 2001 and 2005, 40% of the households in the bottom fifth of earners (the bottom qunitile) moved out of it into a higher one. In more recent years, between 2012 and 2016, a lower 38.5% moved up.

Between 2001 and 2005, 44% of the households in the top qunitile had to move down to let other households take their place. In more recent years, between 2012 and 2016, only 41.5% have moved down.

Getting a long way out of the income circumstances you were born in is a long-shot, according on HILDA’s early attempt at measuring intergenerational mobility.

People who were 32-34 years old in 2015-17 are highly likely to be in the same household income quintiles as those people found themselves in when they were 15-17 back in 2001-03.


There’s only a one in ten chance of moving from the bottom quintile as a teenager to the top quintile in your early thirties. There’s a 37% chance you’ll stay put.

Even among teenagers who grew up in the middle quintile, there’s only a 17% chance of making it to the top, along with a 19% chance of moving one rung up.

Interestingly, women turn out to be more tied to the income their families had when they were children than men, and both men and women tend to stay more closely tied to their mother’s income than their father’s.

…yet we are less reliant on welfare, even pensions…

When HILDA began in 2001, 39% of Australians aged 18 to 64 were living in a household that received government welfare of some kind. By 2017, that proportion had fallen to 31%, but almost all of the drop happened before the global financial crisis in 2009.

Most of us are still in households that have received something from the government over a 10-year period: 58% of working age Australians in 2017, down from 64% in 2010.

Among older Australians aged 65 and over, reliance on the age pension and other benefits for more than half of income needs has dropped from 60% to 51%.

Among new retirees aged 65 and over, the proportion receiving the age pension has fallen from 76% of men and 74% of women to just 60% of men and 55% of women.


Read more: More people are retiring with high mortgage debts. The implications are huge


But while the growth of compulsory superannuation is likely to be part of the story, almost all of the decline happened before the financial crisis in 2009, suggesting that the destruction of wealth in the crisis kept people on the pension who otherwise might not have needed it.

…and gender roles are changing

Before the financial crisis, almost three quarters (73%) of men of traditional working age were employed full-time. After the crisis, the rate slipped to a much lower 67% and stayed there.

Female full-time employment was also hit by the crisis but has since almost totally recovered to be just a fraction below its pre-crisis peak of 39.6%.

Women’s hourly earnings are also climbing faster than men’s, up 24% between 2001 and 2017, compared to 21% for men’s.

While women have always been more likely than men to be employed casually, since the crisis male casual employment has climbed while female casual employment has declined.

The two are now as close as they have ever been, with women now only six percentage points more likely than men to be employed causally.


Read more: HILDA findings on Australian families' experience of childcare should be a call-to-arms for government


In dual-earner male-female couples, the proportion in which the woman earns more than the man has climbed from 22% to 25%.

The woman being the main breadwinner is more common in couples that aren’t legally married and don’t have children. It is also far more common in the regions than in cities and among couples in which the man doesn’t have a university degree.

Men in predominantly female breadwinner households are somewhat less happy with their lives and with their relationships, as (perhaps surprisingly) are women.

Fathers tend to agonise more about work-family conflict than mothers, notwithstanding the much greater amount of housework and childcare work performed by mothers. The men who worry the most work long hours, have irregular shifts and very young children. A mother working the same hours as a father will typically be more conflicted.


Read more: Language of love: a quarter of Australians are in inter-ethnic relationships


Most parents suffering high work-family conflict get out of it within a year or two, often by managing things better and sometimes by changing jobs. Those suffering high work-family conflict are 50% more likely than others to separate the next year.

HILDA’s great strength is that it will be able to follow those parents and their children and all the other families it surveys and tell us what happens next. Rather than being an Australian version of Seven Up!, it might be better described as Australia’s never ending story. Its co-director Roger Wilkins says its design allows it to be “infinitely lived”.


Read more: Australian city workers' average commute has blown out to 66 minutes a day. How does yours compare? The Conversation


Peter Martin, Visiting Fellow, Crawford School of Public Policy, Australian National University

Wes Mountain/The Conversation, CC BY-ND

This article is republished from The Conversation under a Creative Commons license. Read the original article.
Read more >>

Sunday, September 02, 2018

What the newspapers said about inequality. It's wrong

PETER WHITEFORD
If you were going to reduce a 150-page Productivity Commission examination of trends in Australian inequality to a few words, it would be nice if they weren’t “ALP inequality claims sunk”, or “Progressive article of faith blown up” or “Labor inequality myths busted by commission”.

The editorial in the Australian Financial Review of August 30 says questions about whether inequality is increasing are “abstract”, taught in universities as “an article of faith”, and a “political truncheon”.

Here I should disclose that I teach courses covering inequality as well as undertaking research on the topic. Also, I was one of the external referees for this week’s Productivity Commission report.

It adds to a growing pile of high quality research on trends in income distribution in Australia, including a recent Australian Council of Social Service (ACOSS) and University of New South Wales study using data from the Australian Bureau of Statistics (ABS) that provides an in-depth analysis of income and wealth inequality in 2015-16 and an analysis of trends since 2000.

Also released at the end of July was the latest HILDA Statistical Report that analyses how things have changed over time for individuals between 2001 and 2016.

The Productivity Commission survey takes the deliberately ambitious approach of assessing a wider range of outcomes than income, including indicators of household consumption and wealth, their components, and changes over time and in response to events such as transitions to work, divorce and retirement.

Much of the reporting seems to have misread the messages the survey and the Chairman’s speech to the National Press Club were trying to emphasise. For example, the editorial in the Financial Review argues the Commission’s report shows “economic growth has made everyone in Australia in every income group better off”.

Well, no, it doesn’t.

The finding that every income group has benefited from income growth should not be interpreted as meaning every person in Australia is better off. The discussion of mobility in the report makes the point that the incomes of households and individuals fall as well as rise.

Put simply, not everyone – in fact very few (about 1%) – stay in exactly the same place. Table 5.1 (page 96) shows more than 40% of the Australian population were in a lower income group in 2016 than they had been in 2001, for reasons ranging from retirement to disability to unemployment to family breakdown.

Single adults on Newstart, although not the same people, have fallen down the income distribution over the past 25 years, from around the bottom 10% to the bottom 5%. As another example, someone who worked on a manufacturing production line until it was closed and then got a job as a sales assistant would be better paid than a sales assistant used to be but most certainly not better paid than they used to be. They would have little reason to believe the Financial Review.

And as the Commission was at pains to point out, the stabilisation and slight decline in overall inequality over the past decade is to a large extent the result of specific government decisions.

One of the most important was the one-off increase in age pensions by the Rudd government in 2009. The 2016 ACOSS report on poverty found the relative poverty rate (before housing costs) for people aged 65 and over fell from around 30% in 2007-08 to 11% in 2013-14, due to the “historic increase” in pension rates.

ABS income surveys show the average incomes of households headed by people aged 65 and over climbed by 16% in real terms between 2007-08 and 2015-16, while for the population as a whole the increase was about 3%. As a result, the average incomes of older households jumped from 69% to 78% of those of households generally.

While economic prosperity was needed to fund that increase, it didn’t automatically fund it. That needed deliberate government intervention.

In his speech releasing the report, Commission chairman Peter Harris specifically noted “growth alone is no guarantee against widening disparity between rich and poor”.

Some forms of poverty for children “have actually risen”.

The slide in inequality resulting from the increase in the age pension is likely to have disguised increases in inequality elsewhere.

According to the Bureau since the global financial crisis the number of workers who are underemployed – working part time and wanting more hours - has climbed from about 680,000 to 1.1 million; from 6.3% to 8.9% of the workforce.

And the ABS finds wage disparities have increased. The ratio of the earnings of a worker at the 90th percentile (earning more than 90% of workers) to the earnings of a worker at the tenth percentile grew from 7.75 times in 2008 to 8.24 times in 2016. This was due to widening wage differentials for both full-time and part-time workers and an increase in the proportion of part-time workers

We often hear about Australia as a “miracle economy” enjoying 27 years of economic growth. In fact, the Commission report (Figure 1.2 page 13) shows real net national disposable income per person – a better measure of individual economic well-being than GDP – actually fell in six out of the last 27 years.

The income survey data show an even more mixed record. The Our World in Data database shows that by 2003 the real income of the median Australian household was only about 5% higher in real terms than in 1989, while the second and third decile households – mainly headed by those on low wages and some on social security – were actually no better-off than in 1989, largely due to the effects of the early 1990s recession.

Virtually all of the increase in real disposable household incomes enjoyed since 1989 (or 1981 for that matter) came in one five-year period, between 2003 and 2008 during the first mining boom.

What is striking about Australia compared to other countries is that since the global financial crisis we have largely maintained the income lift from the boom.

Will we be blessed by another boom to pump up the figures? Or might we be less lucky?

Despite the way it’s been spun, the Commission’s main message is that in the decades ahead we will need both policies that generate economic growth and policies that ensure it’s well spread. One without the other could leave many of us worse off.
Peter Whiteford, Professor, Crawford School of Public Policy, Australian National University
This article was originally published on The Conversation. Read the original article.
The Conversation

Read more >>

Sunday, March 18, 2018

Australia. It depends on where you live

Woody Allen was right when he said 80 per cent of success was showing up. But only for some of us.

If you are born in Blacktown in Sydney or Broadmeadows in Melbourne, showing up probably won’t do. But showing up is about all you’ll need if you are born in Pennant Hills or Glen Iris.

It’s a shocking thought, and until now there’s been no evidence for it. It is well-known that people who are born in poor suburbs do more poorly later in life, but until now it has been thought that it's because of who they are rather than where they are.

It’s been hard to disentangle the two. Families with low aspirations and little education tend to congregate in the same suburbs. That their children do poorly could well be because of them, rather than the families and conditions that surround them.

Now Australian National University researcher Nathan Deutscher come up with an ingenious way to seperate the them. He got the Tax Office to match taxpayers born between 1978 and 1991 to their parents using the home addresses they first quoted when they applied for their tax file numbers. He compared their incomes at age 24 to those of their parents and also to the parents of their peers in the same postcodes.

Then he got clever. Some of those parents moved home while their children were growing up, to suburbs more than 15 kilometres away.

He examined what happened to the eventual incomes of the children who moved compared to the eventual incomes of the children with similarly well off parents who stayed put.

Moving out of a poor suburb helped them even when their parents’ incomes didn’t change. Unsurprisingly, it helped them more the earlier they left. But here’s what is surprising. When they moved didn’t matter much before the age of 11. Nor did it matter much after the age of 20. It mattered an awful lot in the teenage years. Every year that a teenager delayed moving to a higher income suburb cost them 4 per cent of the eventual boost to their income.

It’s as if it’s our teenage years most determine who we are, rather than the earlier ones or the later ones. That’s certainly how it is for our taste in music, and also for our ability to learn languages when we move between countries. Every teenage year delayed matters a lot more than each early childhood year delayed.

Deutscher is quick to point out this doesn’t mean our early childhood years aren’t critical. It’s just that there’s less variation in them suburb by suburb, after taking into account income. Parents that move don’t deliver particularly different early childhood experiences.

What is it about location that matters so much during our teenage years? Roughly half of it is because it’s where we live in those years that will most likely determine where we look for a job and try to settle down. It's where our friends are. It’s also where we are likely to develop the connections that will help us look for that job. It’s why Adelaide turns out to have been a less than good place for many to have spent teenage years. It’s also why during the mining boom Western Australia and Queensland turned out to be good places, although less so afterwards.

Much of the rest of it is to do with our peers – our friends in our teenage years. Deutscher gets at this by comparing the income of their parents (actually the income of all parents of children born in the same year in that postcode) to eventual personal incomes. The poorer our friends' parents, the poorer we will be ourselves. Naturally, the income of our parents matters more. But the income of our friends' parents matters quite a bit. It has about a quarter the weight of the income of our own parents.

Added to that would be the impact of our teachers, what’s available in the community and what seems possible in the community. All of this might be something many parents already know, which might be why so many of them spend so long obsessing about bringing up children in the right suburb. And it might be what pushes up prices in those suburbs and makes the distinction between high priced and low priced suburbs more extreme.

As would intermarriage. The Productivity Commission reported a few years back that two thirds of Australia’s high earners were married to other high earners. A decade earlier it was half.

We are increasingly less likely to move out of the circumstances in which we are born, unless our parents up stumps and move, which is itself increasingly difficult.

Australia is a far less equal place than it was in the 1980s. But that’s not all. There’s also less equality of opportunity. Just showing up is just about good enough for some, nowhere near good enough for others.

In The Age and Sydney Morning Herald
Read more >>

Monday, October 16, 2017

'Staggering': Young people twice as likely to be on Centrelink benefits if parents were

Children of parents on Centrelink benefits are almost twice as likely to be on benefits themselves by their early 20s as children who are not.

The world-first finding, culled from 18 years of Centrelink records, calls into question the conventional wisdom that it is easy for Australians to escape their upbringing.

The researchers from the Universities of Melbourne and Sydney were granted unprecedented access to the lifetime payment records of 124,285 young Australians born between October 1987 and March 1988.

They examined their payment status at the ages of 18, 20 and 26, and hope to do so again at the age of 30.

They found that 32 per cent of the children born to parents not in receipt of benefits were themselves on some sort of benefit by the ages of 18 to 26. But among those born to parents who were on benefits, the proportion was almost twice as high at 58 per cent, a ratio of 1.8 to 1.

The effect was the most pronounced for the children of parents on single-parent benefits and disability and carer payments.

Young people who had grown up with parents who received disability mental health payments received 2.4 times the amount of social assistance as their peers who had grown up in families that did not receive them, and 4 times the assistance of children who grew up in families with no history of social assistance at all.

Young people who had grown up with a parent on the single parenting payment received 2.2 times the assistance of other young.

In contrast, young people who had grown up in families receiving Newstart or the partnered-parent benefits received just 1.5 to 1.7 times as much assistance as other people in life.

Importantly, the researchers found that young people who had grown up in single parent or disability payment household were far more likely than other young people to be on welfare payments of all types, not just single parent of disability payments.

Researcher Deborah Cobb-Clark of Sydney University said she was shocked by the finding and took some time to be convinced.

"Disability is pretty random. For the children of parents on disability benefits to themselves be on welfare later on life is kind of like lightning striking twice," she said.

"I had thought the biggest correlation would be unemployment benefits, because they are related to investments in education."

Professor Cobb-Clark said she wasn't aware of another team anywhere in the word that had looked at the intergenerational correlation of benefit payments across an entire system.

"There will be other people who follow this with other work, so maybe this is not the end of the story, but I think what is going on is that the disadvantage for kids whose parents are on disability benefits and single parent payments is just really intense, and it is manifested itself in all kinds of things happening to them before they are 26: they are more likely to be on unemployment benefits, they are more likely to be on the caring benefit themselves, they are more likely to be on disability benefits.

"It happens to a fairly small group of people, but if you are one of those people it looks very difficult to overcome."

So large was the Centrelink dataset that the University of Sydney had to build a "virtual computer" linking hundreds of others to process it.

University of Melbourne researcher Nicolás Salamanca said the finding ought to be a "game changer" for the way governments designed social policy. "This isn't survey data. It's almost 100 per cent coverage, drilling down into 126 million fortnightly payments. The results are staggering," he said.

"The government is talking about an investment approach to welfare, funding what works, but until now it has had little idea about what leads to what in subsequent generations".

The paper, to be published by Melbourne University on Monday, makes clear that it has not found that welfare payments themselves lead to more welfare payments.

"If anything, it's the reverse," said Professor Cobb-Clark. "Young people who grew up in disadvantaged families would not be better off had their families never received benefits.

"The benefits are a marker for something that's happened. It is important that people don't jump to the conclusion that we can fix all this by taking them away."

In The Age and Sydney Morning Herald
Read more >>

Wednesday, August 30, 2017

All in the family. Surnames suggest elite jobs inherited

It's no easier to move from rags to riches in Australia than it used to be, and no easier than anywhere else.

That's the surprising finding from a new study of intergenerational mobility that negates the traditional wisdom that it's twice as easy to get ahead in Australia as in Britain or the United States.

The new study has created Australia's first very long run estimates of social mobility, using data on rare surnames among doctors and university graduates from 1870 to the present.

"What we find is that even although some apples might fall away from the tree, they have a tendency to roll back," said one of the authors, Andrew Leigh, a former professor of economics and a Labor member of parliament. "In other words, a rich grandparent might have a poor son, but the grandkids may end up closer to their grandparents' social status."

With Melbourne University economist Mike Pottenger​ and the author of an American study of surnames, Gregory Clark from the University of California, Davis, Dr Leigh has compiled a list of the rarest surnames among the graduates of Sydney and Melbourne universities between 1870 and 1899.

Among the 500 rare surnames are A'Beckett, Brissenden, Clubb, Westacott and Zwar.

He then examined the electoral rolls from 1903 on to determine the occupational status of voters with those names. He finds that even in recent years they are much more likely to be in elite professions than people with names such as Smith.

A separate examination of graduation records from Sydney and Melbourne universities found that even today people with the rare surnames of earlier graduates are 76 per cent more likely to obtain university degrees than people with names such as Smith.

Another examination of rare surnames among the doctors listed on the 1875 Australian Medical Pioneers Index held by the State Library of Victoria found that even today people with those names are 28 per cent more likely to be doctors than the rest of the population.

The study concludes that the intergenerational correlation of status >is a very high 0.7, twice as high as found in earlier father-son studies, and about as high as in Britain and the United States. A correlation of 0.7 means the status of earlier Australians explains about half of the status of their descendants.

The correlation has changed little over time.

Dr Leigh himself conducted one of the earlier father-son studies in 2007 and wrote at the time that "Australian society exhibits more intergenerational mobility than the United States".

His findings were used by Finance Minister Mathias Cormann​ in a speech to the Sydney Institute this month to claim that when it came to providing opportunity to succeed in life through effort and hard work Australia ranked "ahead of other significant countries including the UK, the US, Switzerland, France, Germany, Japan, New Zealand and Sweden".

Dr Leigh told Fairfax Media that his earlier study was about what happened in a single generation. The new study was about what happened across multiple generations. There appeared to be a "surprising degree of persistence" at the top.

In The Age and Sydney Morning Herald
Read more >>

Thursday, August 03, 2017

Why we're suddenly concerned about inequality. Things have stopped getting better

Bill Shorten's on to something. Not the pointless debate over inequality – whether it's rising or not depends on what you measure – but the truth that lies beneath the debate.

It's that, unusually, life is getting harder.

In every year since the turn of the century the Melbourne Institute's Household Income and Labour Dynamics survey has asked the same 7000 households a raft of questions designed to establish whether things are getting better or worse. HILDA is a statistical version of Seven Up.

In all but four of the past 15 years, things were getting better.

Two of those four years followed the global financial crisis. The other two were the two most recent years for which we have data: the first two full years of the Abbott-Turnbull government.

It means that whereas before the election of Tony Abbott, a typical Australian family took home about what it did in 2009, it now takes home less, after adjusting for inflation.

It's unusual, absent a recession. But it's been bearable because interest rates have been falling. When they climb, as they have just started to for some borrowers, it'll become painful.

As Shorten put it in a speech that purported to be about inequality but was actually about declining real incomes, "It feeds that sense, that resentment, that the deck is stacked against ordinary people, that the fix is in and the deal is done."

We didn't get that sense when ordinary incomes were rising, even though inequality was widening. Only now, when real incomes are slipping, do we feel resentful.

And it's mainly men who are resentful. Female earnings are trending up, especially those of women employed full-time. Male earnings are trending down.

University graduates earn much less than their predecessors used to ($1023 a week, down from $1468) and they are much less likely to be in full-time jobs four years later (73 per cent, down from 91 per cent).

Australians with only a high school qualification are even worse off. When the survey started, 81 per cent of them were employed full-time within four years. Now it's 62 per cent.

The survey's custodian, Roger Wilkins, notes dryly that this suggests the payoffs from university education have not deteriorated "relative to the alternatives".

As more and more of us work in part-time rather than full-time jobs, an increasing proportion are combining part-time jobs in order to work full-time. This means that part-time jobs are more common than the Bureau of Statistics survey suggests and that full-time jobs are harder to get.

Home ownership rates for the under-40s have collapsed. In 2002 when the survey began, 32.5 per cent of 18- to 39-year-olds owned a home. It's now 24.9 per cent.

The proportion of men in their early-20s living with their parents has jumped from 43 per cent to 60 per cent. The proportion of early 20s women staying at home has jumped from 27 per cent to 48 per cent.

Those who can buy houses find it hard to pay them off. The average mortgage taken out by a young homebuyer has almost trebled – jumping from $120,813 to $330,687. Going back to the same homeowners year after the year the survey finds that in most years the amount owed climbs as a substantial minority of young homeowners refinance or redraw or fall behind on their loans.

Wilkins says if they continue like this – using their mortgages to fund day to day expenses – there will be "real implications for future aged pension liabilities".

Australians are working longer without waiting for the pension age to rise. The typical retirement age has climbed from 62 to 66 for men, and for 61 to 64 for women. And retirement is less likely to be a one-off event. Thirteen per cent of men who retired between the ages of 60 and 64 find themselves back at work within a year, up from 9 per cent. Seven per cent of the women who retired between 60 and 64 find themselves back at work in a year, up from 4 per cent.

Even now, a quarter of a century after the introduction of compulsory superannuation and 15 years after compulsory contributions of around 9 per cent, the balances of retirees are surprisingly low.

Thirty per cent of men retire without super, and 29 per cent of women.

The men who do have super retire with a typical balance of $325,200; the women with $110,952. That typical balance is the median, meaning half of the retirees will have more, and half less. The mean (average) is much higher, pushed up by very big retirement balances at the top.

Retirees with low balances are highly likely to use them to pay off debts, obliterating 58 per cent of their super (men) or 70 per cent (women) in one go.

Wilkins says a significant proportion of people with relatively low balances are making the decision "not to use their superannuation to help fund their retirement".

Australia remains a wealthy country. But it isn't absolute wealth (or even relative inequality) that matters most when it comes to our feelings. It's whether or not things are getting better. HILDA suggests they are getting worse.

In The Age and Sydney Morning Herald
Read more >>

Tuesday, August 01, 2017

Better under Rudd: Household finances in reverse

The typical Australian family takes home less today than it did in 2009, when Kevin Rudd was prime minister.

The shocking finding, in the latest latest wave of the Household Income and Labour Dynamics survey, helps explain a growing political divide about inequality, even though the survey itself provides mixed evidence on whether things are getting worse.

Unique among Australian surveys, HILDA has been conducted every year since 2001 by returning to the same households and tracking changes in their lives.

Funded by the Department of Social Services and managed by the Melbourne Institute, it is able to reveal what the census and other mass surveys cannot: how the life circumstances of individuals change over time.

More than 7000 households have been surveyed each year. Another 2000 have been added in recent years, bringing the total number of people surveyed up to 17,300, including 5000 children.

The survey finds that real household disposable income (net of tax) peaked just before the global financial crisis at $77,411.

It fell sharply in 2010 and 2011 to $73,531 and then climbed back to $77,143 before sliding in 2014 and 2015 to $76,225.

The figures are medians, meaning half of Australia's households would have earned more than $76,225 and half less.

A measure of inequality, the Gini coefficient, shows little change in household inequality over the entire 15 years of the survey.

But when only earnings from paid work are examined on an individual basis, the survey finds inequality has worsened since 2008, by about 7 per cent for men and 9 per cent for women.INTERACTIVE

Over 15 years the typical inflation-adjusted household income has climbed from $58,956 to $76,225.

Sydney experienced the weakest growth of any region, with the typical household income adjusted for size climbing just $5182.

The typical Melbourne income climbed $9785. Perth household incomes grew $19,276.

The relatively weak performance of Sydney has changed the league table, with Perth now the highest-earning Australian state capital, with a typical real household income of $56,073, up 52 per cent after adjusting for inflation.

Brisbane is in second place on $49,210, followed by Melbourne on $48,494.

Sydney, which had the highest household income of any state capital back in 2001, is in fourth place just ahead of Adelaide at $44,779.

The percentage of Australians in poverty has fallen since 2001, whether measured as the proportion of households earning less than 50 per cent of the typical household adjusted for size, or whether measured as the proportion of households able to afford a limited basket of goods.

Poverty is highest among older Australians, especially women, although the report says the measure will overstate poverty where elderly Australians own their own homes and don't have to pay rent as many do.

Poverty is lowest among couples with dependant children.

Victoria has the most extreme geographical divide, with Melbourne having one of Australia's lowest poverty rates at 7.6 per cent while other Victorian towns and cities have 16.5 per cent.

In NSW the rates in Sydney and other towns and cities are much the same at 10.5 and 11.6 per cent.

South Australian regional towns and cities are the most disadvantaged in Australia with a poverty rate of 21.1 per cent, compared with 10.1 per cent in Adelaide.

Most people in poverty improve their situation in one to two years.

Far fewer Australians live in households that receive welfare payments than in 2001: 32.2 per cent of workforce-aged Australians, down from 38.1 per cent, and most get off it fairly quickly.

The experience of those surveyed suggests that university education is not the ticket to full-time employment it used to be.

Around 86 per cent of those who graduated between 2001 and 2005 were in full-time jobs five years later, compared with just 75 per cent of those who graduated between 2010 and 2011.

They were more likely to be employed part-time or doing further study.

The decline in full-time employment for men who had only completed high school was even worse, from 81 per cent to 32.6 per cent.

In The Age and Sydney Morning Herald
Read more >>

Sunday, January 22, 2017

Not born to run. Why Springsteen was lucky

People don't see Bruce Springsteen for the music. He says so himself.

Here he is on the New Yorker radio hour in November: "I don't get paid necessarily to play this song or that song. I get paid to be as present as I can conceivably be on that particular night, because if I'm there, and I'm alive, I know you're feeling it too."

That's what we will be paying for over the next few weeks: communion, the opportunity to hang out with Springsteen and have him hang out with us, fully present.

We want to be close to him because we know he is one of us. Although talented and driven as a musician, he almost dropped out of high school, he drove busses. He mightn't have made it at all were it not for an extraordinary stroke of luck, which he details in his autobiography.

Asked what he would have done if it hadn't worked out, he says he would have gone back to New Jersey and played in bars.

I've been privileged to see Peter Allen perform twice. As for Springsteen, I didn't go for the music. I went to see him perform, to have him take me into his life. He was the boy who could have been any of us. Try to listen to Cassie McCullagh's Life Matters documentary about her family's memories of him as a boy in Armidale without crying.

Allen was certain he had what it took to get to the top, but he couldn't get close until, balding, with a failing voice and an act that was getting laughed out of gay bars, he was picked up by a manager who thought he could pull something off.

We want to get close to Allen, Springsteen and the rest in part because what happened to them is so unlikely.

If you need to be convinced, check out the Academy Award-winning documentary 20 Feet from Stardom broadcast on the ABC last month. It's an account of truly excellent singers - all of them as good as or better than the stars - who didn't make it.

As with Allen, back-up singer Merry Clayton felt that "if I just gave my heart to what I was doing, I would automatically be a star". She was wrong. Record companies told her she sang gospel and said: "there can only be one Aretha".

In a legendary paper entitled The Economics of Superstars, economist Sherwin Rosen argues that these days the world only needs a few musical superstars, whereas before modern communications it needed one per village.

In Success and Luck: Good Fortune and the Myth of Meritocracy, economist Robert Frank uses maths to point out that even if most of success is due to talent, the final decisions about who makes it to the top will inevitably be the result of luck.

The implications extend from ministerial entitlements to Centrelink to tax to pay scales. They're worth remembering whenever we are told someone got there by themselves.

In The Age and Sydney Morning Herald
Read more >>

Wednesday, July 20, 2016

Hard times. We're no better off than in 2009

If you think you are worse off despite a raft of economic statistics saying things are getting better, you're probably right.

Australia's longest-running household survey finds home ownership is increasingly out of reach for many of us, one in eight families don't have $500 in savings in case of emergency, and that real household disposable incomes peaked in 2009.

Australia's longest-running Seven Up! style longitudinal survey of Australian households finds that real household disposable incomes peaked in 2009 and still aren't back to where they were.

The finding is different from those of other studies that survey different Australians at different times.

The Household, Income and Labour Dynamics in Australia survey (known as HILDA) tracks the same 17,000 Australians each year to find out whether their particular living standards have improved rather than those of the population on average.

Beginning in 2001, the survey finds that the typical household was better off each year until 2009, with the typical real household disposable incomes climbing from $57,704 to $76,264 - a gain of 32 per cent.

The gain includes more than what happened to households on average, it includes promotions and increased employment opportunities for household members surveyed.

Between 2009 and 2011 the global financial crisis pushed down typical household income 5 per cent to $72,260 as household members lost jobs, worked fewer hours and lost pay rises.

Since 2012 household income has recovered slowly, climbing to $75,731 in 2014, still 0.7 per cent worse than in 2009, meaning typical Australian families are no better off than they were five years ago.

Household disposable income is the combined income of all household members after receipt of government pensions and benefits and after taxes. It is adjusted for inflation.

Household wealth has also been slipping, sliding 3.3 per cent since 2010. Between 2006 and 2010 it climbed 4.8 per cent.

Superannuation is the most important household asset after property, but it is a long way behind.

In 2014 the average household owned a home worth $392,241, secured with a debt of $100,689 and a second property worth $138,718 secured with a debt of $42,226.

The average superannuation balance was $168,011, average share ownership $44,116 and average cash in the bank $51,118.

But in this survey, 12 per cent of households surveyed were unable to lay their hands on $500 of savings in the event of an emergency.

Almost 80 per cent said they believed that savings of at least $500 were essential.

Five per cent were unable to afford dental treatment when needed. Almost all believed that dental work was essential.

Seven per cent were unable to afford new clothes for their school-aged children. Sixty per cent believed new clothes were essential each year.

Professors Peter Saunders of the University of NSW and Roger Wilkins of the University of Melbourne used the answers to construct a "deprivation score" which counted the number of essential items the individual could not afford.

Twelve per cent of Australians were deprived of at least two essential items. Seven per cent were deprived of at least three.

Single parents had the worse deprivation score, with almost 20 per cent unable to afford three or more essential items.

Singles were much worse off than couples regardless of whether they had children.

Nine per cent of single non-elderly men were deprived of three or more essential items and eight per cent of women.

Retirees were much better off with only 3.5 per cent of singles deprived of three or more essential items and less than 1 per cent of retired couples.

Fourteen per cent of unemployed Australians were unable to afford three or more essential items.

In The Age and Sydney Morning Herald
Read more >>

Friday, April 01, 2016

Melbourne Institute: The uber-rich are earning more, and more

The top 1 per cent of Australian earners amassed an extraordinary 9 per cent of Australian income in 2013, the highest proportion since the 1950s.

As recently as the early 1980s the top 1 per cent took in just 4.4 per cent.

An analysis of the latest tax statistics to be published by the Melbourne Institute shows the top 0.1 per cent - a mere 18,750 people - took in 2.7 per cent, also the highest take since the 1950s.

The starting income for the top 1 per cent was $237,300. On average each earned $438,100.

The entry income for a member of the top 0.1 per cent was $608,700. On average each earned $1.3 million.

The figures are the incomes reported to the Tax Office, leaving open the possibility that actual incomes might be higher. They are gross figures, before tax and deductions, and adjusted to take account of the people who do not file tax returns.

The national average for all Australians aged 15 and older was $48,800.

The highest earners are different from the rest of us. They get big chunks of their income from sources other than wages, salaries and benefits.

In 2013 the top 10 per cent earned about one quarter of their income from other sources, including shares. The top 1 per cent earned almost half from other sources and the top 0.1 per cent earned more than two thirds of their income from other sources.

The figures show a rapid growth in the proportion of their income high earners are getting from other sources. Ten years earlier the top 10 per cent obtained only one fifth of its income from non-wage sources, the top 1 per cent only 40 per cent, and the top 0.1 per cent, 60 per cent.

But Melbourne Institute professorial research fellow Roger Wilkins says much of the very recent growth in high earnings has been due to salaries.

"The top 1 per cent are more likely to be in the global labour market," he says. "Technological change is making highly skilled workers increasingly valuable."

"Also, in the years to 2013 they had benefited from repeated tax cuts. Although these are pre-tax incomes, there's evidence to suggest that cuts in tax also boost reported before-tax incomes. One reason is that people find creative ways to hide or lower their income. There's less point in trying when rates are lower, so we might be getting a more accurate reading."

"And it takes effort to secure wage increases. The higher the tax rate, the less worthwhile it becomes because you keep less of what you bargained for. Lower rates make wage increases more worthwhile."

Asked whether it mattered that high income Australians were getting larger and larger shares of national income, Professor Wilkins said that depended on why their incomes were climbing. If if was because they were being entrepreneurial and working harder their higher incomes would be boosting the economy, but if it was because they were seeking favours it would be harming it.

"Look at the people in the BRW Rich 200 list. A fair proportion of them are in property and mining. These are not entrepreneurial areas. These are areas where what matters most is the ability to deal with government and get monopoly rights over mining and property developments."

"To the extent that the growing income of high earners is driven by developments like that, things like the College of Surgeons controlling entry into their profession so it can charge high prices, to the extent it is driven by that, and to some extent it is, it is unambiguously bad. It's not fuelling broader economic growth or income growth."

In The Age and Sydney Morning Herald
Read more >>

Sunday, December 01, 2013

What's not to like about Gonski? Pyne edition.

I get that Christopher Pyne likes private schools. But what I don't get (or didn't get until this week) is that he could possibly want to take money away from poor schools to give to richer ones. I couldn't understand how anyone would want to do that.

Of course, Pyne says that's not what he wants to do. As Australia's new education minister he merely wants ''a new model that is national, that is fair to everyone and that is needs-based''.

But note his use of the word ''new''.

The Gonski panel spent two years examining everything about the funding of Australian schools and built a new model from the ground up. It's so new, it's not due to start until next year.

Every student would attract a base amount of funding, the amount needed to provide a good education. It would follow them from school to school. The panel suggested about $8000 a primary student, around $10,500 a secondary student.

Students at government schools would receive the full amount. Students at private schools would receive a scaled-down amount, depending on the school's ability to charge fees.

On top of the base funding would be extra loadings for measures of disadvantage, such as the number of disabled students in the school, the number of them from low socioeconomic backgrounds, the number of indigenous students, the number from non-English speaking backgrounds and so on.

The loadings would be paid in full to all schools, public and private. So generous would they be that some private schools serving heavily disadvantaged students would have all of their costs met by the public.

What on earth is there not to like about such a scheme?

Why in heavens does Pyne want to go back to the drawing board?

He isn't saying, but on Tuesday he dropped a hint. He said the scheme introduced by the Howard government a decade ago was ''a good starting point for a school-funding model'', a comment he spent the rest of the week backing away from.

It is a scheme that saw funding for the wealthiest schools increase at a far faster rate than funding for the poorest ones.

At its heart were two tricks: it no longer took account of a school's ability to raise its own income, so it blindly piled public money into exquisitely appointed private schools in way that hadn't happened before.

And it doled out the money on the basis of a con. Funds were allocated in accordance with the ''socioeconomic status'' of the postcode in which each student lived - not on the basis of each student's actual socioeconomic status, but on the basis of the status of those who lived in the same postcode, most of whom would never go near the school and couldn't afford it.

It meant good schools in poor areas cleaned up, even though they didn't take poor students. It meant schools taking in boarders from poor rural areas cleaned up, when the boarders themselves came from Australia's richest families.

This is the system Pyne said directed funds ''to the schools that were most in need''. This is the system he said was ''a good starting point for a school-funding model''. It's the system Gonski found ''lacks coherence''.

So why would someone like Pyne yearn for it? I didn't have a clue, until I found myself listening to Lars Osberg, a Canadian economist who specialises in the widening income gap between the rich and the poor. He has been travelling around Australia delivering a talk titled What's so bad about more inequality? Osberg says while some inequality mightn't be so bad, a self-perpetuating process is under way that is continually widening the gap, with private schools an important part of the machine.

When incomes were more equal, he said, it didn't much matter whether their children went to a public or a private school. Their success in life would be pretty much the same.

But as the gap widens, affluent families find ''the greater is the gap between their own incomes and those of the masses, the further there is to fall in the next generation''.

It becomes ''ever more important'' for them to give their own children every possible advantage.

''More inequality of incomes thus implies more incentives for upper-income families to reduce their support for public expenditure on the human capital of all children'' - to reduce support for public education.

It calls to mind images of well-heeled passengers clambering onto rescue boats throwing the less well-heeled off. It isn't nice, but it would be rational if you knew only some could survive. And I sincerely hope it is not what's driving Christopher Pyne.

In The Age and Sydney Morning Herald
Read more >>

Thursday, March 01, 2007

The poor get the picture. Does Peter Garrett?


If Labor’s shadow cabinet thinks that the middle-class owns million dollar houses, I can’t help wondering what their election strategy to target mainstream Australia is going to look like.

That's the ANU's Andrew Leigh, who takes a break from parenting today to comment on this Peter Garrett radio transcript.

On ABC Adelaide's Matthew Abraham and David Bevan program Tuesday the Labor front bencher was asked, quite legitimately in the view of Labor's taunts about Malcolm Turnbull, whether he was a millionaire.

I hate to say it, again, but Garrett's reply was excruciatingly embarrassing, not to mention wrong.

BEVAN: Are you a millionaire?

GARRETT: Well, anybody who owns a house in Sydney or around Sydney probably qualifies for that but I’d say I’m a person of moderate means.

As Andrew Leigh notes, the median house price in Sydney is $520,000.

As he says: "If Labor’s shadow cabinet thinks that the middle-class owns million dollar houses, I can’t help wondering what their election strategy to target mainstream Australia is going to look like."
Read more >>

Monday, February 03, 2003

Waiting for Mr. Right: Rising Inequality and Declining Marriage Rates

The thesis of this paper discussed on Life Matters is that women are waiting longer because there is now a greater potential payoff from doing so. When all the potential males earned pretty much the same income there was little to be gained (financially) in Waiting for Mr. Right.

Increasing inequality, say the authors, explains about 30% of the marriage rate decline in the US over the last few decades. They purport to show that this is not due to the labor force decisions of women in response to rising income inequality, or to the marital decisions of men in response to rising income inequality.
Read more >>

Tuesday, October 01, 2002

The mathematics of inequality

That was the title of this week's discussion on Life Matters with Geraldine Doogue.

Two French physicists believe they can explain why in every society the distribution of incomes follows the same mathematical pattern.

The arguments are best sumarised in New Scientist.

There is not a lot to add except that it'll pay to follow the work of the new "econphysists" closely.
Read more >>

Monday, September 09, 2002

Happiness

Today on Life Matters with Geraldine Doogue I spoke about happiness.

Money doesn't matter much. The average Japanese can buy five times what they could after the war but is no more happy. The average American can buy 2.5 times what they could and is no more happy. Psychologist Bob Cummins from Deakin University refers to "homeostasis". He says our body regulates how happy we feel to keep our mood in a tight band, in much the same way as it regulates blood pressure and temperature. There are doubtless good adaptive reasons for doing that. Too little happiness and we'll commit suicide or forget to eat. Too much happiness and we won't bother to hunt, or look out for predators.

One way in which adaption happens is rising expections. The higher our income, the more income we feel we need. So we believe that a certain increase in our income will make us happy, but it never does. The Journal of Economic Literature article includes a graph which describes the process perfectly.

What does make us happy is work. Having a job is usually far more important to happiness than the income the job provides.

Even moving from the lowest quartile of income to the highest won't be enough to compensate for losing a job. It's worth paying money in order to be in work...

The implications for policy: a tax on employed Australians designed to create employment is a good idea. Also the economists obsession with GDP is probably the right one - but for the wrong reasons! We need high GDP not because of the goods that it will deliver us but because of the work that getting the high GDP will make for ourselves along the way!

The other thing that matters is democracy. The Swiss local government areas where citizens can take part in direct elections are far more happy than those where citizens can not. The process matters. Economists Frey and Stutzer determine this by observing that immigrants to Switzerland who can't vote, aren't made nearly as happy by living in a district with direct referenda as are those who can vote, even though they enjoy the same outcome in terms of good government.

Taken all together - the implications are that redistribution of income is a very good idea, positional goods should probably be banned (in aggregate they make people unhappy by raising expectations) jobs matter, and that democracy matters in its own right, regardless of where it leads us.

After the discussion Geraldine told me of a Background Briefing program on happiness which noted the importance of festivals. Experiences give a much bigger happiness bang for the buck than goods. (Unless it is the experience of buying the good. A new kitchen increases happiness at the time it is bought, but not a lot after that). Much of India is very poor, but poor Indians devote a lot of effort to festivals (and weddings, as some recent films make clear).

Also aftert the discussion Kathy Golllan, the Life Matters Executive Producer, told me of her amazing finding. Teaching English to upper class children in Indonesia, she asked, as a language excercise: "What would you do if you had a million dollars?" One of the replies shocked her. "I would get a job".
Read more >>