Sunday, June 27, 2021

Intergenerational report to show Australia older, smaller, in debt

Australia will be smaller and older than previously expected in 40 years time after the first downward revision of official projections in an intergenerational report in 20 years.

The much lower projections in Monday’s fifth five-yearly intergenerational report will mean indefinite budget deficits with no surplus projected for 40 years, only 2.7 Australians of traditional working age for each Australian over 65 (down from four) and average annual economic growth of 2.6%, down from 3%.

“Intergenerational reports always deliver sobering news, that is their role,” Treasurer Josh Frydenberg will say launching the report Monday morning. “The economic impact of COVID-19 is not short lived.”

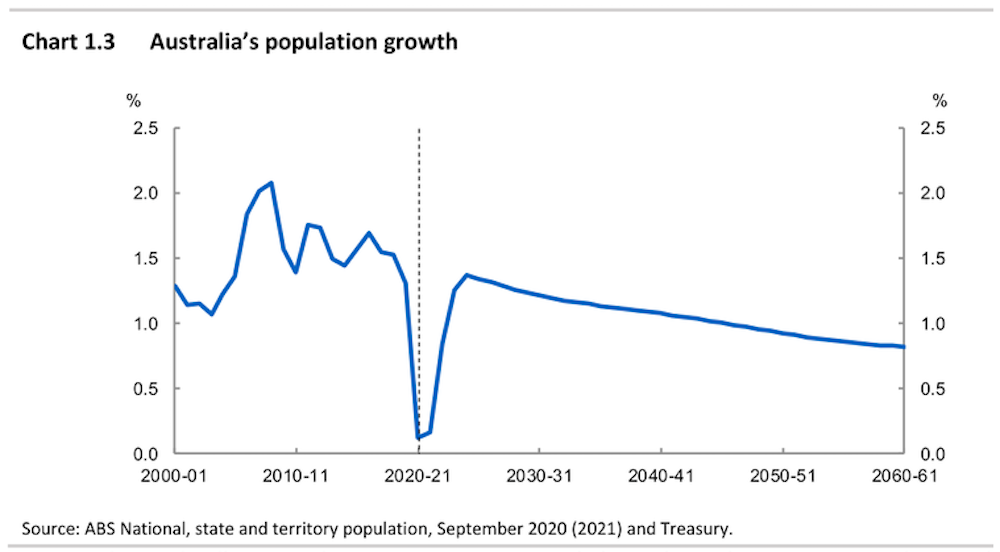
The report says the pandemic has slowed both Australia’s birth rate and inflow of migrants.

The 2015 intergenerational report projected an Australian population of almost 40 million by 2054-55. The 2021 update projects 38.8 million by 2060-61.

As a result in 2060-61, about 23% of the population is projected to be over 65, up from 16% at present and 13% in 2002.

Although in the future increased superannuation would take pressure off the age pension, superannuation attracts favourable tax treatment which cuts government revenue.

The combined total of age pension spending and superannuation tax concessions was projected to grow from around 4.5% of gross domestic product to 5% by 2061.

Health, aged care spending to soar

Real per person health spending is projected to more than double over the next 40 years, largely due to the costs of new health technologies.

By 2060-61 health is expected to be the largest component of government spending, eclipsing social security and accounting for 26% of all spending.

Aged care spending is projected to nearly double as a share of the economy, largely due to population ageing.


Read more: No Barnaby, 2050 isn't far away. The IGR deals with 2061


Mr Frydenberg will say that even in the face of these demands the government remains committed to its promise to limit the tax take to 23.9% of GDP. Tax receipts are not expected to reach this level until 2035-36.

“Growing the economy is Australia’s pathway to budget repair, not austerity or higher taxes. This is why we remain committed to our tax to GDP cap, ensuring our COVID support is temporary and persuing productivity-enhancing reforms.”

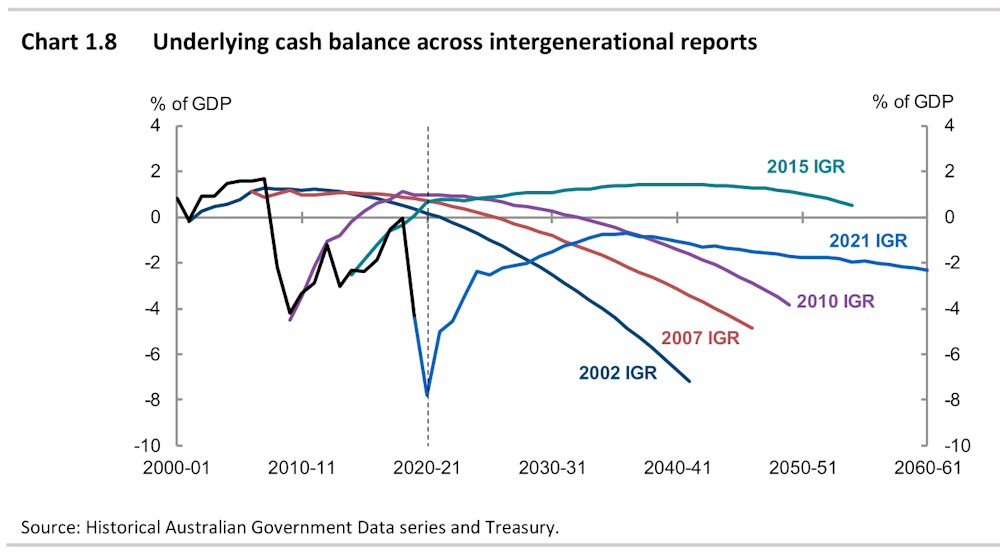
Net debt is projected to peak at 40.9% of GDP in 2024-25, before falling to 28.2% in 2044-45 and then climbing again to 34.4% by 2060-61.

While Australia’s population will be smaller and older, and debt levels higher as a result of the pandemic, had the government not spent at unprecedented levels to support the economy a generation of Australians might have been condemned to long term unemployment, seriously damaging the budget longer-term.

Other projections have real GDP per person a measure of living standards, growing at an annual average of 1.5%, down from an earlier-projected 1.6%

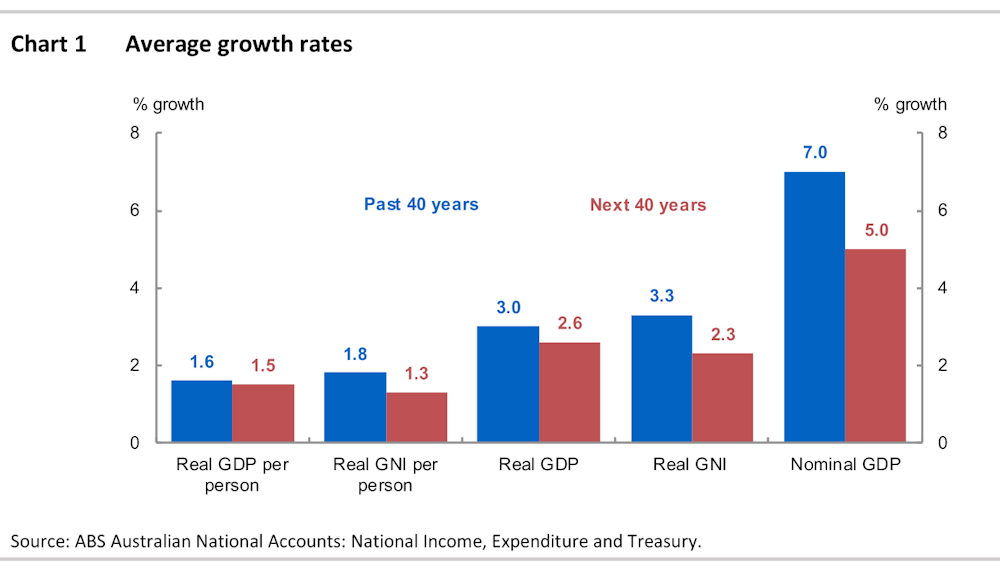
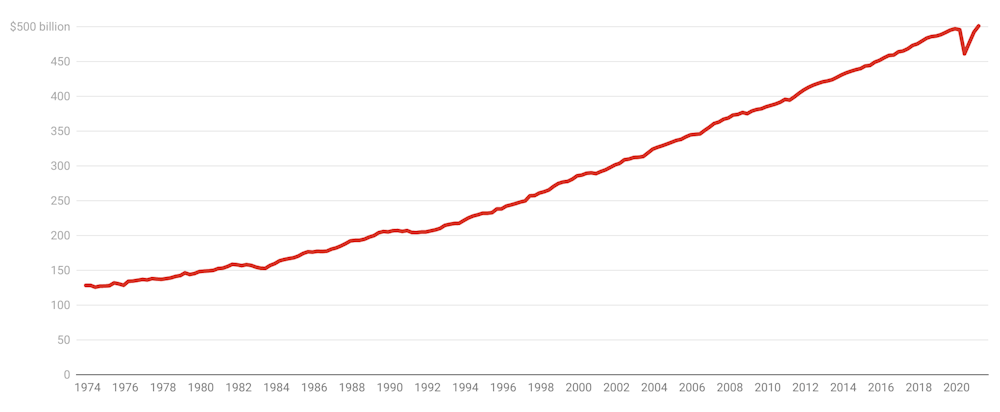
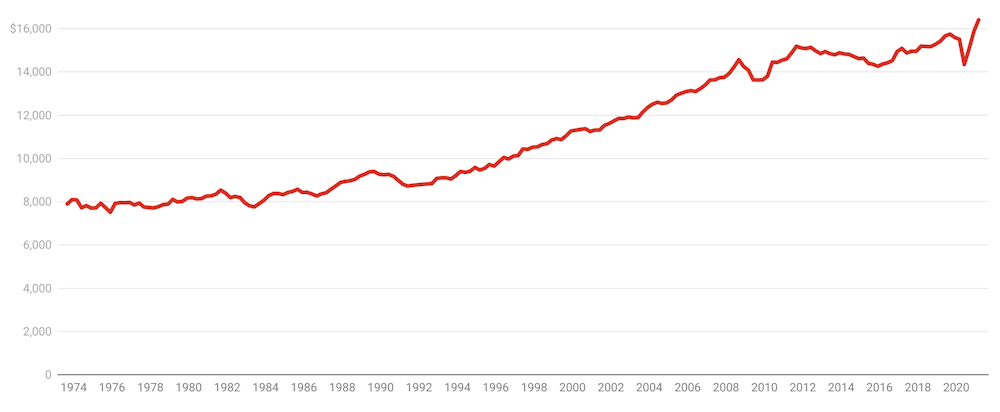
The result will still be a near-doubling of real GDP per person, from $76,700 in today’s dollars to $140,900 in today’s dollars in 2060-61.

Behind that projection lies an assumed lift in annual labour productivity growth to 1.5%. In the decades before the pandemic, annual productivity growth had been averaging 1.2% and had slumped to 0.4% in the year leading up to the pandemic?


Read more: Why productivity growth stalled in 2005 (and isn't about to improve)


The lift in productivity assisted by government policies that will help individuals and businesses “take advantage of new innovations and technologies” is expected to take ten years.

Not included in the extracts from Monday’s report released by the treasurer late Sunday are the closely-watched projections for net overseas migration and for spending on the national disability insurance scheme.

Peter Martin, Visiting Fellow, Crawford School of Public Policy, Australian National University

This article is republished from The Conversation under a Creative Commons license. Read the original article.

Read more >>

Wednesday, June 23, 2021

No Barnaby, 2050 isn’t far away. The IGR deals with 2061

Barnaby Joyce has an answer to those who say Australia should commit to net zero carbon emissions by 2050. He says 2050 is too far away to be sure of anything.

As he put it in February while a backbencher, “many of the politicians and commentators talking about a 2050 aspiration will be dead by then”.

The man he replaced as deputy prime minister, Michael McCormack, said much the same thing at about the same time.

He was “not worried about what might happen in 30 years’ time”.

While edging Australia ever closer to endorsing a target for 2050, Prime Minister Scott Morrison used the same line of reasoning.

Australia’s goal was to reach net zero emissions as soon as possible, and preferably by 2050.

Near enough to forecast

“But when we get there, when we get there, whether in Australia or anywhere else, that will depend on the advances made in science and technology needed to commercially transform not just advanced economies and countries, but the developing world as well.”

For all of these leaders, 2050 was simply too far into the future to have a sensible view about.

So what are we to make of what will happen next Monday?


Read more: Infographic: the language of Intergenerational Reports


Shortly after 10am Treasurer Josh Frydenberg will release a set of official projections that will go way out into the future, to 2061 rather than 2050.

It’ll be the fifth set of official projections going out 40 years — the fifth so-called intergenerational report.

The first, produced by Prime Minister John Howard and his treasurer Peter Costello in 2002, set out projections to 2042.

The Howard government mandated the five-yearly intergenerational reports as part of its Charter of Budget Honesty.

The idea was that it wasn’t good enough to examine the impact of government policies just a handful of years into the future, as happened each budget night. If problems were set to build up over time — say over 40 years — budgets wouldn’t give you a handle on them until it was too late.

The Charter of Budget Honest Act made clear that the intergenerational reports were to deal with more than demographic change.

The first identified increasing spending on new health care technologies unrelated to demographic change as the greatest threat to government finances.

Climate change feeds into the IGR

And that first John Howard and Peter Costello report included a sharp warning about climate change, noting that “early action to prevent environmental damage, rather than later action to remedy it, is likely to reduce long-term costs”.

In 2010 the third intergenerational report had an entire chapter on climate change. The report was entitled Australia to 2050.

The fourth (Abbott government) intergenerational report in 2015 was prescient in its warning about the Great Barrier Reef, describing protection of it as a “significant challenge over coming decades”.


Read more: 'Severely threatened and deteriorating': global authority on nature lists the Great Barrier Reef as critical


Frydenberg’s 180-page report will also include a chapter on climate change, one that looks beyond 2050.

It will doubtless include the sort of disclaimers all intergenerational reports have had — that projections on the basis of unchanged settings aren’t forecasts. Part of their purpose is to warn what will happen if settings aren’t changed.

The first warned that steadily-rising spending on new medical technologies along with a rapidly ageing population would boost the need for tax by 5% of GDP.

As governments took measures to wind back the growth in spending (including lifting the pension age) those needs shrank in future intergenerational reports, to about 3% of GDP.

Challenges manageable…

To date, each report has found we will have no difficulty finding the money.

The first pointed to living standards 90% higher in 40 years time.

The fourth, using the same metric of real GDP per person but assuming lower productivity growth, pointed to living standards 80% higher.

With so much uncertain, the assumptions in Frydenberg’s report will tell us a lot about where the treasury thinks we are going and what might need to change.

A big concern in the first report was that as the population of older Australians grew, the number of people of traditional working age available to serve each one would shrink, roughly halving.

…if we’re given notice

That concern was overstated somewhat because at the same time the number of young people who needed serving would shrink.

Twenty years on, it is clear that our population isn’t ageing nearly as quickly as had been expected, in part because we’ve been importing many more (relatively young) migrants than expected.

In the year before COVID net overseas migration reached 241,300 per year. The first intergenerational report had expected only 90,000 per year.


Read more: Why productivity growth stalled in 2005 (and isn't about to improve)


On the other hand our productivity growth — the amount produced per hour of work — has been abysmal. Before COVID it fell to 0.4% per year. The first intergenerational report assumed 1.75% per year.

And the first assumptions about wage growth seem positively quaint. The first intergenerational report expected 4.25% per year. Before COVID we got 2.1%

There’s no doubt that the assumptions and projections in Monday’s intergenerational report will also seem quaint several decades down the track. But it’s important to make them. The future arrives more quickly than we think.

Peter Martin, Visiting Fellow, Crawford School of Public Policy, Australian National University

This article is republished from The Conversation under a Creative Commons license. Read the original article.

Read more >>

Tuesday, June 22, 2021

Breaking up ABC HQ suits its competitors, not the ABC

Of all the Sydney-centric notions, the idea that the ABC would better represent Australia if it moved its programmakers from Ultimo in Sydney to Parramatta in Sydney is as Sydney-centric as you can get.

Newsflash: 79% of Australia lives outside of Sydney; and the ABC — more than any other organisation —  lives where they live.

The ABC has staff in 53 locations across the country from Esperance to the Eyre Peninsula, from Ballarat to Broken Hill, from Katherine to the Kimberley, from Launceston to Lismore.

From 6.35 each morning as many as 50 microphones broadcast live from 50 different locations, updating Australians on developments in the broader world and where they live in a way no other institution can match — certainly none I’ve worked for.

Yes, the ABC has a national headquarters, and it’s needed. It helps to have staff working on national programs near each other, rubbing shoulders, seeding ideas. It’s why corporations have national headquarters.

News Corporation recognises this. It’s moved Fox Sports into its Sydney newspaper headquarters. It’s moved the Melbourne part of Sky News into its Melbourne newspaper headquarters. In parliament house Canberra it’s moved its Sky News political reporters into its newspaper office to work alongside its political reporters.

Nine has done the same thing. It’s moved its Sydney newspapers in with Nine in Sydney, it has moved its Melbourne papers in with Nine in Melbourne.

None of these organisations has a fraction of the ABC’s ability to report from all across the continent. Nor to report from overseas. The ABC has staff in Tokyo, Bangkok, New Delhi, Nairobi, Port Moresby, Seoul and Jakarta, as well as Washington and London. It even has a newsroom in Parramatta.

But, just as is the case for the less geographically diverse organisations that chide the ABC for not reaching out, the work of these staff needs to be brought together in a central location.

Being in a central location doesn’t mean being of that location. When I worked for the ABC on national programs such as AM and 7.30 most of the colleagues I worked with in Sydney came from somewhere else. I was from Adelaide, the woman I reported to was from rural Queensland. Ultimo was a melting pot.

The ABC defended its decisions to centralise most of its Sydney operations in Ultimo and most of its Melbourne operations in Southbank — taken just 20 years ago — on the ground they would create “synergies”.

Catalyst would benefit from being together with the radio science unit, ABC radio news and online news would benefit from being together with TV news, ABC audio, film, tape and reference archives would be in a single easily-accessible location, and staff working on very different projects would rub shoulders seeding ideas.

These were all things that were said to the parliamentary committee inquiring into those co-location projects, and to some extent digitisation has made them less relevant. Archive material can be served up anywhere and people can rub shoulders virtually though Zoom.

But in another way the COVID-induced shift to working from home has made co-location even more important. There needs to be a compelling reason to come into the office. As in many enterprises, if the national headquarters doesn’t offer the top staff working together in the one space, it doesn’t offer much.

After months of pressure from the Sydney-based communications minister, the ABC said last week it would move 300 of its staff from Ultimo to Parramatta, to make it “easier to engage with more parts of Sydney”.

Minister Paul Fletcher said it was “a good first step”.

If it makes program producers more insular (makes it less likely that the makers of, say, The Money will rub shoulders with the makers of Saturday Extra) it’ll be a step backwards.

Depending on how the real estate transactions play out, it’ll probably cost the ABC money.

Regardless, it’ll cost the ABC time and focus and make programs harder to make, which might be what its more narrowly-focused competitors want.

First published in Pearls and Irritations

Read more >>

Monday, June 21, 2021

Top economists call to speed the switch to electric cars

Australia’s top economists overwhelmingly back government measures to speed the transition to electric cars in order to meet emission reduction targets.

An exclusive poll of 62 of Australia’s preeminent economists — selected by their peers — finds 51 back measures to boost the take-up of electric cars including subsidising public charging stations, subsidising the purchase of all-electric vehicles, and setting a date to ban the import of traditionally-powered cars.

Only 11 oppose such measures, three of them because they prefer a carbon tax.

Six of the 51 who supported special measures said they did so reluctantly, as their preferred alternative would be a carbon price or a carbon tax, rather than subsidising “one alternative out of many to reduce emissions”.

Cars account for roughly half of Australia’s transport emissions, making them about 8% of Australia’s total emissions.

Yet Australia’s take-up of electric vehicles is dwarfed by the rest of the world.

On one measure, all-electric cars accounted for just 0.7% of new car sales in Australia in 2020 compared to 5% in China and 3.5% in the European Union.

Australia has no domestic car industry to protect, meaning industry policy concerns needn’t hold back the transition.


Read more: Going electric could be Australia’s next big light bulb moment


Norway plans to outlaw new petrol car sales from 2025; Denmark, the Netherlands, Ireland and Israel from 2030; and California and Britain from 2035.

Asked whether Australia should take action to speed the transition, eight in ten of the 62 economists selected by the Economic Society said it should.


Economic Society of Australia/The Conversation, CC BY-ND

The results represent a departure for a profession whose usual advice is to avoid interfering with markets.

One participant, University of NSW professor Gigi Foster said an important question needed to be answered in order to justify government intervention: “what is the market failure here?”

The market failure was pollution, imposing costs on the community beyond the drivers of conventionally-powered cars and on the planet by pushing up global temperatures.

Broad support: subsidies for charging points

If it wasn’t to be dealt with by a carbon price, measures that sped up the switchover to electric vehicles could achieve some of the same effect.

By far the most popular measure of six presented to the panellists who supported government action was subsidising public charging points, backed by 84%.

The next most popular was removing the luxury car tax from electric-only vehicles. At present the 35% tax applies to cars valued at more than $69,152, and $79,659 for fuel-efficient vehicles.

43% supported making charging points compulsory in new homes and new car parks. 39% supported setting a date to ban the import of petrol and diesel cars.


Matthew Butlin, who chairs South Australia’s Productivity Commission, noted that much of Australia was not urban and unlikely to be served by charging points for some time.

Without government measures to speed the installation of remote charging stations, many buyers would be reluctant to go electric, even if most of their driving was in cities.

When they were in place, there would be a good case for banning the import of petrol and diesel vehicles, but not until then.


Read more: Could electric car batteries feed power back into the grid?


Others wanted to hold off on banning the import of conventionally-powered cars until Australia had a lower-emissions mix of electricity.

Macquarie University’s Lisa Magnani said that with three quarters of Australia’s electricity generated from coal, electric vehicles created considerable emissions.

The Grattan Institute’s Danielle Wood disagreed, saying “network effects” built a case for switching over early.

Network effects build on themselves

The more people switched, the more charging stations would be built and the lower electric vehicle prices would drop, driving more people to switch, and increasing the benefits of decarbonising the electricity supply.

The sooner Australia swapped over, the easier it would be to get to net zero emissions by 2050 without the need for a “cash for clunkers” style scheme to buy back polluting vehicles.

Setting 2035 as the date for banning imports of petrol-powered cars as recommended this year by the International Energy Agency would give buyers time to adjust while the charging infrastructure developed.


Read more: Want an electric car? Here's how to buy second-hand


Tax specialist John Freebairn said electric cars were already heavily subsidised by escaping the fuel excise used to fund roads, despite the efforts of some states to plug the gap.

Sydney University economist Stefanie Schurer argued on the other hand bulky and polluting sport utility vehicles were effectively subsidised because of the tax benefits they attracted when used for work.

Former Liberal Party leader John Hewson of the Crawford School of Public Policy said smoothing the transition had become urgent.

Smooth transition now “urgent”

It took only ten years from 1903-13 for the United States to switch from horse-drawn to petrol-driven vehicles, and technology take-up was quicker today, particularly in Australia.

Other economists surveyed noted that there was much that could be done to reduce harmful emissions in addition to going electric.

Sue Richardson said Australia should impose serious limits on the tailpipe emissions of new cars. Australia is unusual among developed nations in not having such a limit, making it a favoured market for high-emission cars.


Read more: The trucking industry has begun to turn electric; cars will take longer


Rana Roy said a better approach would be to limit transport itself through remote working and efforts to encourage walking and cycling. Subsidies for electric cars could send such moves backwards.

When responses to the survey were weighted by the confidence respondents had in them on a scale of 1 to 10, support of special measures to drive the transition remained about as strong, backed by eight in ten of the economists surveyed.


Economic Society of Australia/The Conversation, CC BY-ND

Detailed responses:

Peter Martin, Visiting Fellow, Crawford School of Public Policy, Australian National University

This article is republished from The Conversation under a Creative Commons license. Read the original article.

Read more >>

Wednesday, June 16, 2021

The end of JobKeeper wasn’t a blip. It might have cost nearly 100,000 jobs

At its peak, more than 3.8 million Australians were on JobKeeper — three in every ten Australian workers.

Adding in those workers already employed by government, it meant four in every ten received a paycheck that originated from government, more than in Russia.

Yet when JobKeeper ended at the end of March, it looked like a mere blip in employment. The unemployment rate actually fell, for the sixth consecutive month.

The Bureau of Statistics said the cutoff had no “discernible impact”.

Treasurer Josh Frydenberg went further. The economy had “strengthened, even after the end of JobKeeper”.

Since the end of JobKeeper 132,000 people had come off income support.

The treasurer is right. After March the number of Australians on JobSeeker and related payments fell 9%.

Changed rules pushed people off benefits

But it’s possible for people to come off benefits at the same time as people are losing jobs, especially if something else is driving them off, as it was at the end of March.

At the end of March the coronavirus supplement that topped up unemployment benefits stopped. The payment dropped from $715.70 to $620.80 per fortnight.

And job seekers were once again required to search for a minimum of 15 jobs a month, climbing to 20 from July.


Read more: New finding: jobseekers subject to obligations take longer to find work


While burdensome for employers (if all of Australia’s job seekers actually apply for those jobs, employers will be lumbered with 17 million applications per month, climbing to 23 million) it’s also unhelpful for job seekers.

There’s evidence to suggest job seekers get real jobs sooner if they don’t have to go through charades.

The “dob in a job seeker” hotline will have further dissuaded them from applying for benefits.

These changes make the drop in the number of claimants understandable, much more so than the suggestion they got jobs, which in net terms they did not. Employment fell after the end of March, by 30,600 according to Bureau of Statistics figures which will be updated on Thursday.

As many as 97,000 fewer workers?

How is a drop in employment consistent with a drop in the unemployment rate?

The unemployment rate fell to 5.5% in April not because employment grew, but because 33,600 people who had previously identified themselves as unemployed dropped out of contention, changing their status to “not in the labour force”.

Had they continued to not work but continued to describe themselves as “unemployed”, the unemployment rate would have been 5.7%.

And it would have been higher still if those shifted to zero or reduced hours with the end of JobKeeper had been called unemployed. Employment fell 0.2%, but hours worked fell 0.7%.


Read more: Josh Frydenberg has the opportunity to transform Australia, permanently lowering unemployment


My rough maths suggests this means the number of Australians actually working might have fallen by 94,100.

An analysis prepared by Melbourne University employment specialist Jeff Borland for the Fair Work Commission puts the number of jobs lost between 45,000 and 97,000.

He gets 45,000 by comparing the number of people who left employment between March and April this year with the number who left between March and April in previous years.

He gets 97,000 by comparing the average (rapid) growth over the previous four months as we emerged from recession with the growth between March and April.

One in 11 JobKeeper jobs

A touch over one million Australians remained on JobKeeper to the end, suggesting that as many as ten in every 11 of them kept their jobs when JobKeeper ended. One in every 11 might have lost their jobs.

The Australians most knocked around were the youngest. Since the end of JobKeeper, women under the age of 30 have on balance lost jobs while women over that age have continued to gain jobs.

Men under the age of 40 have lost jobs while men over that age have gained them.

The treasury’s deepest concern about jobs since the start of COVID (it mentions it right at the top of that section of the budget) has been scarring.

The unlucky young people who happen not to secure jobs during downturns can fail to secure them for years, being passed over by newer, fresher young people who are barely affected.

Even where these people get jobs, if they enter the market when the youth unemployment is five percentage points higher than normal, they can expect to earn roughly 8% less in their first year, and 3.5% less after five years. It takes about a decade for the effect to fully disappear, and it’s worse for women than men.

Vacancies, plus mismatch

Australia’s record-high vacancy rate (2% of all jobs were vacant at the end of March) makes it look as if scarring needn’t be much of a concern. But jobs are vacant for reasons.

It might be that the mix of jobs we will need is changing, or that employers can for the moment no longer rely on migration to give them the mix of skills they want. Or it might simply be that the general bounceback in jobs has been so fast that the right employers and the right workers are still working out how to find each other.


Read more: The four GDP graphs that show us roaring out of recession pre-lockdown


Many businesses will die as a result of the end of JobKeeper. Businesses are forever dying. Some have been kept alive for longer than they would have been, and some have exited JobKeeper into a changed environment.

We’ve managed to end JobKeeper without a catastrophe, but that doesn’t mean there hasn’t been damage, and it doesn’t mean young lives won’t be scarred.

After a textbook exit from a recession — the sharpest V-shaped recovery ever — it would be awful if we left a slice of young Australia behind.

Peter Martin, Visiting Fellow, Crawford School of Public Policy, Australian National University

This article is republished from The Conversation under a Creative Commons license. Read the original article.

Read more >>

Wednesday, June 09, 2021

Other Australians earn nothing like what you think. If you're on $59,538, you're typical

I’m guessing you earn less than A$200,000.

And I’m guessing you think you’re missing out. People keep telling you so.

On one side of politics Labor leader Anthony Albanese says anyone earning $200,000 dollars a year “can’t be described as being in the top end of town”.

On the other, Prime Minister Scott Morrison parries with interviewers when asked whether people on $180,000 to $200,000 (the biggest beneficiaries of his planned 2024 Stage 3 tax cut) are “high income”.

“They’re hardworking people working out on mines and difficult parts of the country,” he says. “They deserve a tax cut.”

Hardworking or not, Australians on more than $200,000 are rare. And an awful lot of them don’t work at all.

$200,000 is unusual

I’ve never quite understood why politicians are so keen to tell us such incomes are normal. It might be because they are on them. Each backbencher gets $211,250 plus a $32,000 electorate allowance (boosted by $19,500 if they turn down the use of a private-plated vehicle) plus home internet and travel allowances.

Very detailed tax office figures (updated on Monday) tell us what the rest of us earn, all 14.3 million of us.

Only 2% of those required to pay tax earned more than $211,365. Only 3% earned more than $188,667.

Everyone else — the other 97% — earned less than $188,667, most of them a good deal less, and many more earned even less and weren’t required to pay tax.

The typical taxable income (typical in the sense that half earned more than it, half less) was $59,538. If that’s what you’re on, you’re more likely to find people who earn close to what you do than anyone who earns more or less.

We can get an idea of how lonely it is at the top by examining the top 1%, those Australians with a taxable income of greater than $350,134.

There aren’t many of them, just 110,613 — 82,258 men and 28,355 women.

Only 39,209 have taxable incomes of more than $500,000, and of these only 14,467 have taxable incomes of more than $1 million.

Life at the top needn’t be taxed

You’re probably thinking there’s a difference between taxable incomes and actual incomes, and the tax office figures show you’re right.

15,358 Australians reported total incomes of more than $1 million. By the time they had applied legitimate tax deductions, the number had shrunk to 14,467.

Some of these million-dollar earners were able to shrink their taxable incomes very low indeed. 45 cut their taxable incomes to less than the tax-free threshold of $18,200 — meaning they didn’t have to pay anything, not even the Medicare levy.

Another eight managed to escape the Medicare levy even though their taxable incomes were above $18,200, and another 21 escaped income tax while paying the Medicare levy.


Read more: Yes, some millionaires pay no tax, but crimping deductions mightn't help


Many of these millionaires weren’t “hardworking” in the sense Morrison meant. Only 9,144 of the 14,467 Australians on taxable incomes of more than $1 million worked. Only 17,883 of the 57,120 Australians on more than $250,000 worked.

Only nine of the 45 million-dollar earners who cut their taxable incomes to less than the tax-free threshold worked. 27 received so-called franked dividends from companies that had paid tax, enabling them to cut their own tax bills or receive rebates from the tax office. On average, each received dividends of $2.25 million.

Many who aren’t taxed are generous

Seventeen of the 45 million-dollar earners received capital gains, on average $6.4 million each. 38 received interest, averaging $290,000 each.

Against that were set expenses, small and large. Three claimed for work-related car expenses averaging $27,340 each, 13 claimed expenses averaging $57,200 for assistance with tax affairs, eight claimed for previous losses from farms averaging $684,000 each, and eight for losses from other businesses averaging $408,000.

But by far their biggest expense was donations. 14 gave away a total of $161 million in gifts or tax-deductible donations — an extraordinary average of $11.5 million each.

Most of us aren’t like these people.

Most of us claim more modest deductions

Three-quarters of Australians in the tax system earn less than $89,173.

Those on that income typically claim between $1,500 and $1,900 in deductions (men claim more than women) and, thanks to negative gearing, claim losses on properties of between $1,800 and $2,600 (again, men claim more than women).

Such Australians typically report between $1,200 and $2,100 in capital gains (more for women than for men).

If higher-earning Australians are unaware of how most of us live, it’s understandable. Surgeons mix with other surgeons. On average each of Australia’s 4150 surgeons earns $394,303, making surgery our highest-paying occupation.

We mix with, and marry, people like us

And they increasingly marry each other. In 2010 the Productivity Commission found that 68% of Australia’s high earners were married to other high earners. A decade earlier it was 49%.

And high earners live near each other. The average income in Sydney’s Double Bay (Australia’s highest-earning suburb) is $202,598. The average income in Ruse in Sydney’s Campbelltown is $55,100.

People in Double Bay don’t drive through Ruse on their way to the city.


Read more: The Low and Middle Income Tax Offset has been extended yet again. It delivers help neither when nor where it's needed


In the United States it is often the other way around. There, low-income suburbs are more likely to be near the city, meaning that high-income Americans at least see them as they go in to town.

That most of us have little idea of what others earn suits those in charge when they propose tax cuts skewed to high earners.

They can con us that most of us will be better off, and those on high incomes can con themselves they are not already better off.

Peter Martin, Visiting Fellow, Crawford School of Public Policy, Australian National University

This article is republished from The Conversation under a Creative Commons license. Read the original article.

Read more >>

Wednesday, June 02, 2021

The four GDP graphs that show us roaring out of recession, pre-lockdown

Back in the first three months of this year when we had JobKeeper, enhanced unemployment benefits and no lockdowns, Australia roared out of recession.

The GDP figures released on Wednesday tell us that in the months leading up to the end of JobKeeper and the coronavirus supplement at the end of March Australians spent, earned and produced an impressive 1.8% more than in three months to December, which was itself more 3.2% more than the three months to September, which was itself 3.5% more than the three months before that.

It’s growth of more than 8%, described by Treasurer Josh Frydenberg as the most over three quarters since 1968.

But it followed a collapse in gross domestic product of 7% – by far the worst since the Bureau of Statistics began compiling records in 1959.

The net result over the year to March growth of 1.1%, an extraordinary result which means that, at least until Victoria’s (just extended) lockdown, we were producing, earning and spending more than before the COVID recession.

On the graph it’s not much more, not the two or so per cent of normal growth the Reserve Bank had been expecting before the recession, but it means that almost alone among developed nations (along with South Korea and probably New Zealand whose figures aren’t yet out) we are better off after the COVID recession than before it.


Australian quarterly gross domestic product

Chain volume measures, seasonally adjusted. ABS

And we are better off than that bald GDP figures suggest.

In accordance with what is normally good statistical practice those figures are adjusted down for upward movements in prices.

We’ve had a monster upward movement in the price of iron ore over the past year which has enriched Australians through channels including company profits, tax revenue and a higher dollar that aren’t fully reflected in gross domestic product.

That’s why the bureau publishes a separate measure that measures buying power called real national disposable income per capita.

The graph shows it has climbed well above where it was to a new record high.

We ended the recession with 5.8% more buying power than before it began.


Real national disposable income per capita

Chain volume measures, seasonally adjusted. ABS

But we’ve been reluctant to fully use that buying power.

While consumer spending has bounced back to where it was before the recession, in terms of what it buys it is no higher.

In March 2021 we were buying no more than we were in March 2020 — more goods, less services, and more essential items, fewer discretionary items, but no more than we did a year earlier.

Zero growth in buying at a time of substantial growth in buying power can be seen as either disturbing, a sign of understandable caution, or a sign that the best is yet to come.


Household final consumption expenditure

Chain volume measures, seasonally adjusted. ABS

At his press conference Frydenberg painted the caution to date as something that would support economic growth in the months to come as we unwind our record-high household saving rate.

But the unwinding slowed in the three months to March.

In the December quarter the saving rate plunged from 18.6% of after tax income to 12.2%. Before that it had plunged from the record-high 22% to 18.6%.

But in the March quarter it barely fell, inching down from 12.2% to 11.6%, perhaps reflecting the imminent end of JobSeeker and the coronavirus supplement.


Household saving ratio

Ratio of saving to net-of-tax income, seasonally adjusted. ABS

The subsequent spread of coronavirus in Victoria, and the reluctance to date of the federal government to reinstate JobKeeper in Victoria will give Australians to keep saving rather than spending their money for some time to come.

Frydenberg told the national accounts press conference he was open to further assistance of another kind and would speak to Victoria’s Treasurer as soon as he could.


Read more: Frydenberg spends the bounty to drive unemployment to new lows


Business investment in buildings and equipment surged 5.3% in the March quarter (enough to account for nearly all of the economic growth over the past year) aided by investment incentives which were renewed in the May budget.

Australia’s rigorous approach to compiling the national accounts means the ones released Wednesday are out of date.

Although much will have improved since then, the spread of coronavirus and the lockdown in Victoria means much is suddenly worse.

Our future is about as uncertain as it has ever been.

Peter Martin, Visiting Fellow, Crawford School of Public Policy, Australian National University

This article is republished from The Conversation under a Creative Commons license. Read the original article.

Read more >>

Paying off a home loan used to be easier than it looked. It's now harder. Here's why

So you think it’s the right time to dive in and buy a home.

I can’t tell you you’re wrong. I can tell you it would have been better to do it before prices began soaring, and that if they keep soaring it will get worse still.

When the year began, the typical Sydney price was $872,000. Five months later at the start of June it is $970,000.

That’s a jump of almost $100,000 in a matter of months — an awfully big price for procrastinating.

In Melbourne the typical price has climbed from $682,000 to $740,500. In Perth it has climbed from $471,000 to $521,500, and so on.

And banks are beginning to withdraw the cheapest of their still-very-cheap mortgage rates, at this stage mainly the fixed four-year rates which had been below 2%.

So why on earth wouldn’t you dive in, cut your living expenses to the bare minimum and try and buy a home while it’s the least bit possible?

One (slight) reason to relax is mortgage rates. Despite the increases in fixed four-year rates, three-year rates have barely moved. That’s because the Reserve Bank has promised to hold the three-year bond rate constant at 0.1%.

Buying has become a bigger commitment

The three-year bond rate determines the cost to banks of their three-year fixed rate mortgages.

The Reserve Bank has said it does not expect to lift its 0.1% cash rate until “2024 at the earliest”. Movements in the cash rate determine movements in variable mortgage rates.

But there is another reason for proceeding with caution and taking stock.


Read more: Home prices are climbing alright, but not for the reason you might think


For our parents, buying a home was an exceptionally good deal, not only because homes were cheaper — until the end of the 1990s homes typically cost between two and three times household after-tax income, they now cost closer to five — but also because over time the loan became easier to pay off.


Housing prices as proportion of household disposable income

Household disposable income after tax, before the deduction of interest payments, including income of unincorporated enterprises. Core Logic, ABS, RBA

That isn’t because mortgage rates were coming down — at times they were going up — it’s because during our parents’ times wages (and prices) were climbing.

It meant that even if someone of our parents’ generation just squeaked through one of the bank’s tests about their ability to make payments on a mortgage, a few years and lots of inflation and several big wage rises down the track those mortgage payments shrank compared to everything else.

Once, wage rises took care of repayments

Many of our parents paid off their mortgages early.

One way to look at this is that the bank’s ability-to-repay calculators were set too harshly. They failed to account for future hefty wage rises and inflation.

It’s probably also true that they were set more generously than they might have been in an implicit acknowledgement of what the assistant governor in charge of the Reserve Bank’s economic branch Luci Ellis calls “mortgage tilt”.

The former governor, Glenn Stevens, used another term, “front-end loading”.

Mortgages were ‘front-end loaded’

When inflation was high, and as a consequence interest rates were high, wages that climbed rapidly with high inflation made the servicing burden “most acute in the very early phase of a loan, falling over time”.

On a graph (and the former governor presented a graph) the line showing payments as a portion of income tilts down over time.

In a world of lower inflation and interest rates, the tilt becomes flatter.

By now (Stevens published the graph in 1997) the line must be near horizontal.

If wage growth remains near the record lows the treasury is forecasting it will become scarcely any easier to make payments on a home loan over time.

Yet the banks are still handing out loans using the sort of formulas they used to.

If you get a loan you’ll be assessed as being able to (just) make the payments as always, but you’ll be denied the near certainty of being able to more easily meet the payments as time goes on.

Now, we retire mortgaged

This is a different from the risk you’ll also run of today’s ultra-low mortgage rates climbing (which banks do take into account in deciding whether to give you a loan).

The proportion of homeowners reaching retirement age while still paying off their mortgage has doubled in 20 years. Which might be why some banks ask for details of your super before granting you a loan. It isn’t an idle inquiry.

Might things get better? Maybe, if we can get wages moving again.

Evidence given to Tuesday’s post-budget Senate estimate hearing provides cause for hope, and despair.

Super hikes will make things worse

The budget forecasts for wage growth over the next four financial years are incredibly low — 1.5%, 2.25%, 2.5% and 2.75%

On Tuesday Treasury Secretary Steven Kennedy revealed that each would have been higher — 0.4 points higher — had the government not persisted with the five scheduled annual increases in compulsory superannuation contributions of 0.5% of salary starting in July.

The treasury believes each increase will slice 0.4 percentage points from wage growth, on the basis that employers, who are legally required to pay the contributions, will have to find the money somewhere.

Commonwealth budget, 2021-22

It’s the same conclusion reached by the government’s retirement incomes review.

It’s cause for hope because it means that when those five increases stop (in mid-2026, or sooner if the government stops them mid-track) wages might be able to grow more strongly.

It’s cause for despair because if the treasury is right, we are denying ourselves wage rises we could use in return for super we will increasingly use to pay down our mortgages.

Peter Martin, Visiting Fellow, Crawford School of Public Policy, Australian National University

This article is republished from The Conversation under a Creative Commons license. Read the original article.

Read more >>