Monday, September 30, 2019

5 questions about superannuation the government's new inquiry will need to ask

The government’s new retirement incomes review will need to work quickly.

On Friday Treasurer Josh Frydenberg said he expected a final report by June, just seven months after the issues paper he wants it to deliver by November.

The deadline is tight for a reason. In recommending the inquiry in its report on the (in)effeciency of Australia’s superannuation system this year, the Productivity Commission said it should be completed “in advance of any increase in the superannuation guarantee rate”.

In other words, in advance of the next leglislated increase in compulsory superannuation contributions, which is on July 1, 2021.


Read more: Government retirement incomes inquiry puts superannuation in the frame


The next increase (actually, the next five increases) will hurt.

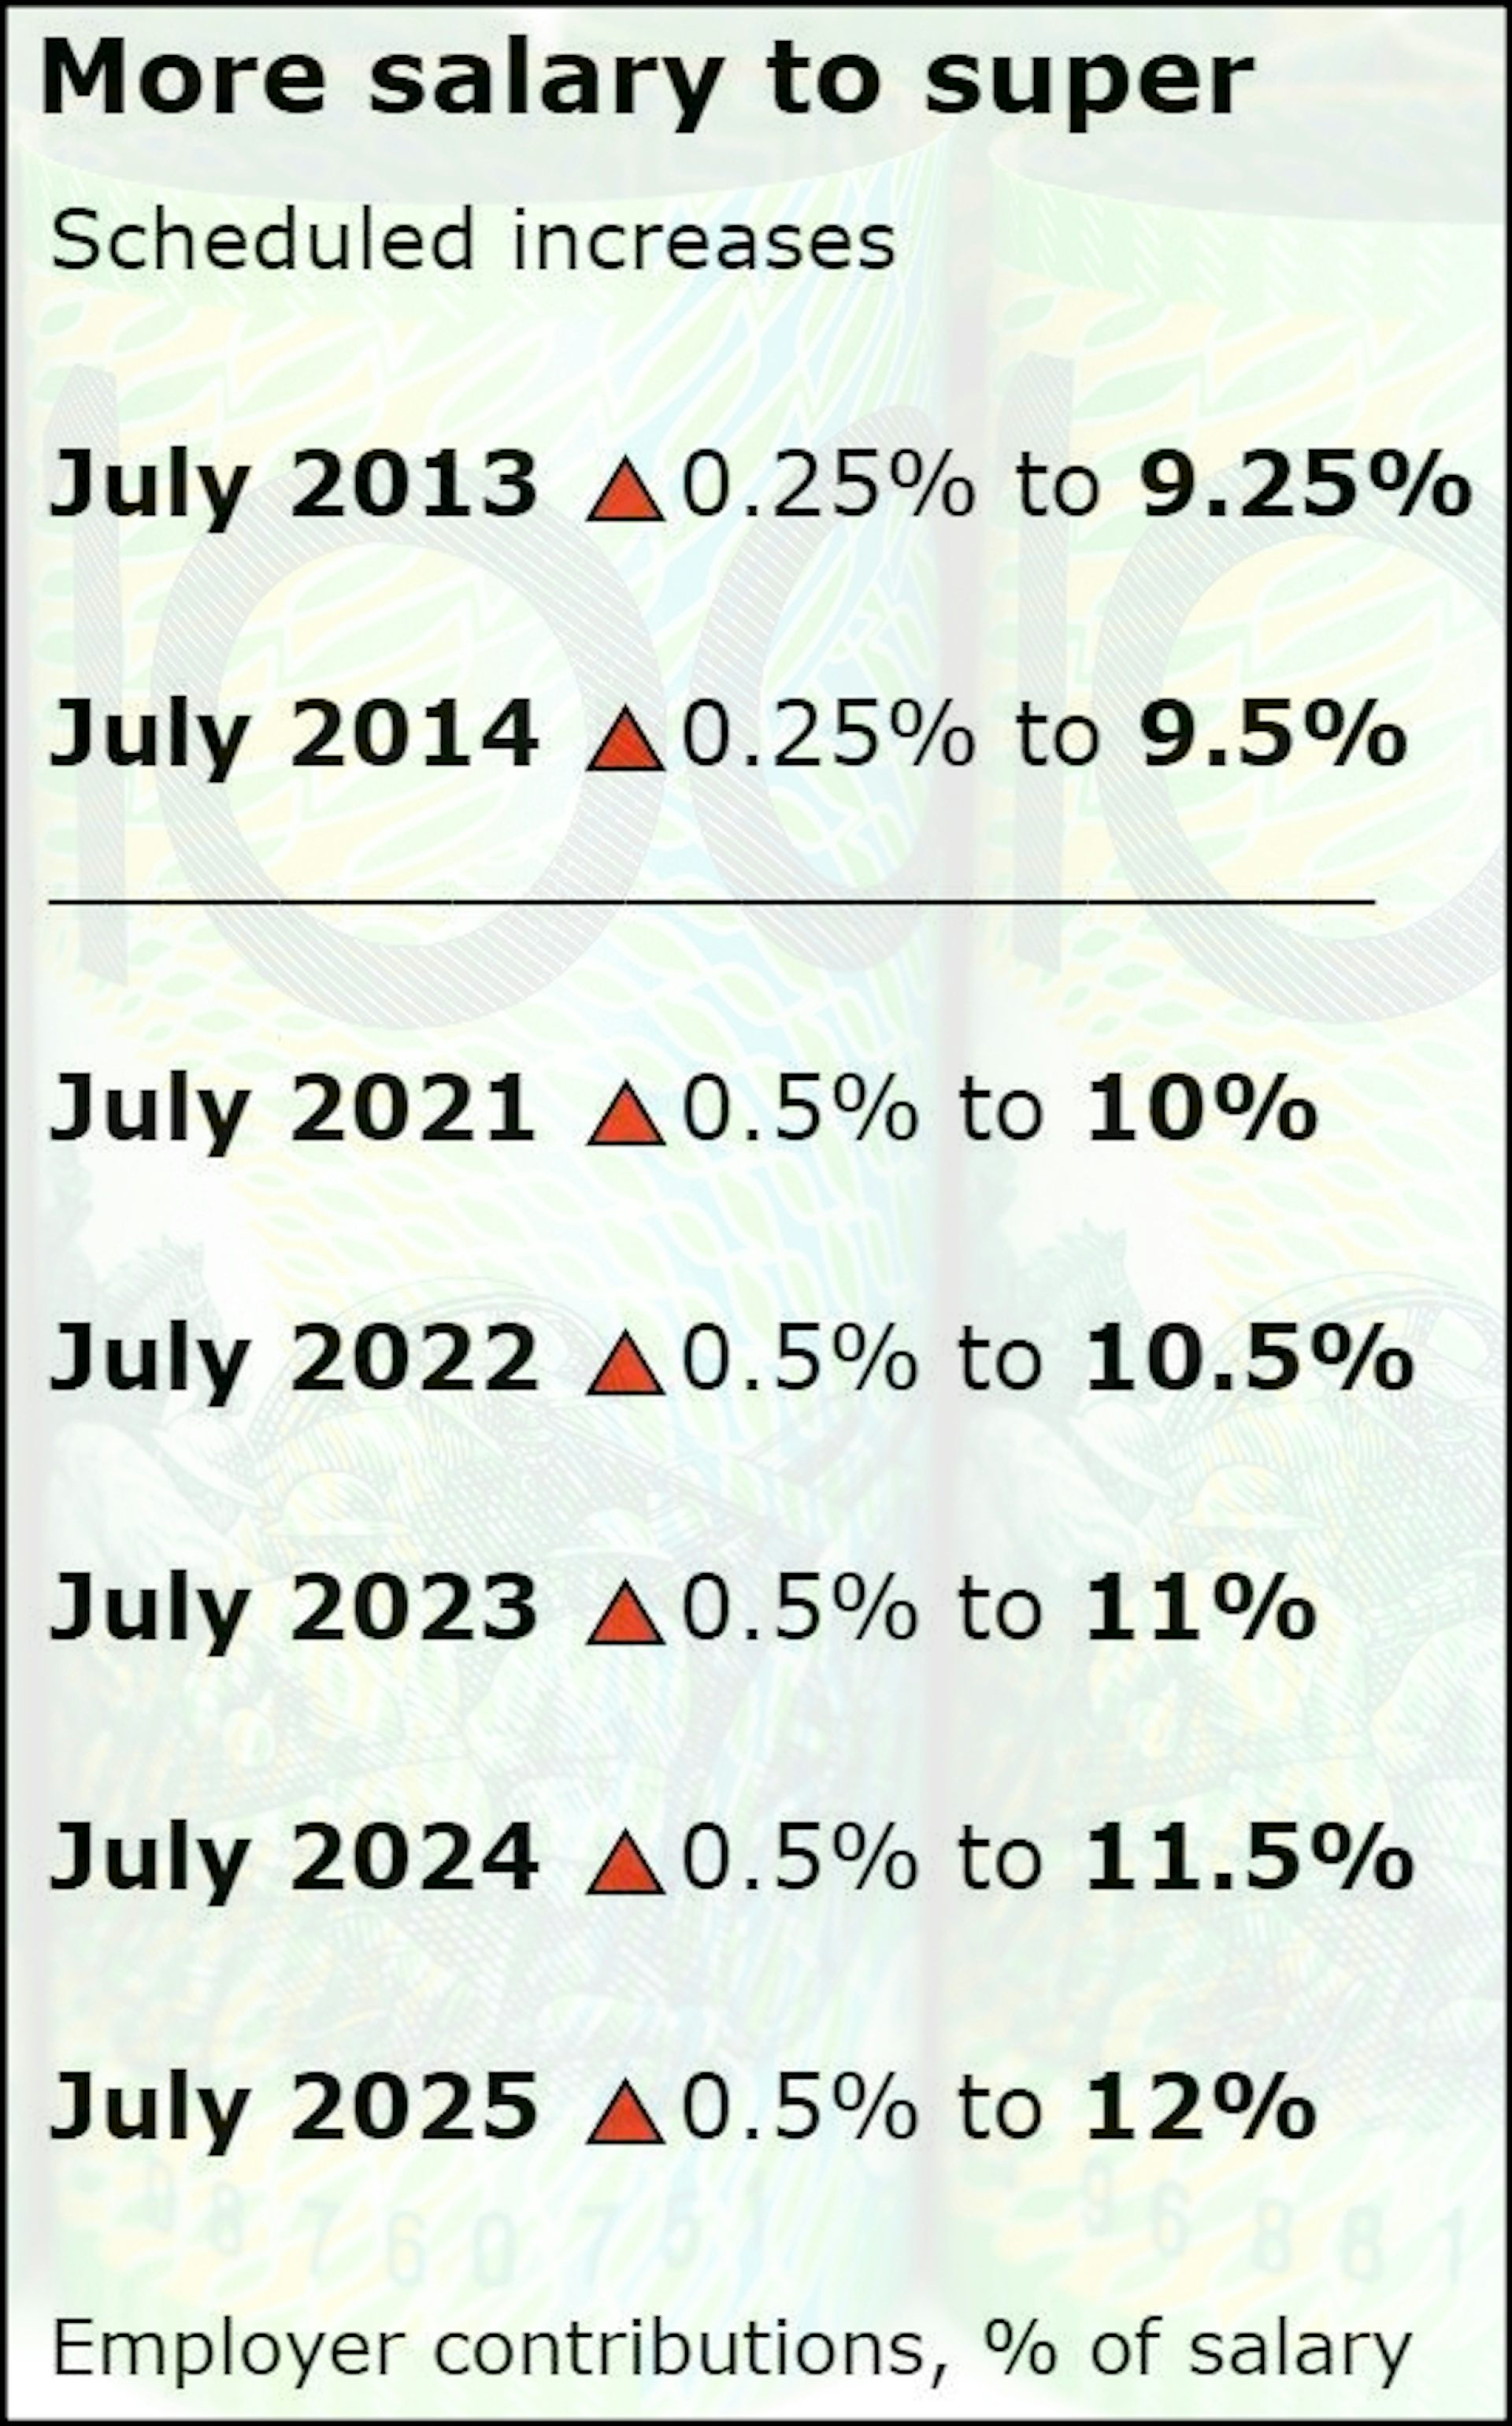
The last two, on July 1 2013 and July 1 2014, took place when wage growth was stronger. In 2013 wages growth was 3% per year.

And they were small – an extra 0.25 per cent of salary each.

The next five, to be imposed annually from July 1 2021, are twice the size: 0.5% of salary each.

If taken out of wage growth, they’ve the potential to cut it from its present usually low 2.3% per annum to something with a “1” in front of it, pushing it below the rate of inflation, for five consecutive years.

If we were going to do that (even if we thought the economy and wage growth could afford it) it would be a good idea to have a good reason why. After all, compulsory superannuation is the compulsory locking away of income that could otherwise be spent or used to pay down debt or saved through another vehicle, regardless of the wishes of the person whose income it is.

Question 1. What’s it for?

Fortunately, the new inquiry doesn’t need to do much work on this one.

For most of its life compulsory super hasn’t had an agreed purpose. At times it has been justified as a means of restraining wage growth, at times as means of restraining government spending on the pension, at times as means of boosting national savings.

In 2014, more than 20 years after compulsory super began, the Murray Financial System Review asked the government to set a clear objective for it, and two years later the government came up with one, enshrined in a bill entitled the Superannuation (Objective) Bill 2016.

The bill lapsed, but the objective at its centre lives on as the best description we’ve come up with yet of what compulsory super is for:

to provide income in retirement to substitute or supplement the age pension

Which raises the question of how much we need. For compulsory super, the answer is probably none. People who want more than the pension and their other savings can save more through voluntary super. People who don’t want more (or can’t afford to save more) shouldn’t.

Question 2. How much do people need?

Assuming for the moment that how much people need in retirement is relevant for determining how much compulsory super they need, the inquiry will need to examine what people need to live on in retirement.

The “standards” prepared by the Association of Superannuation Funds of Australia are loose. The more generous of the two allows for overseas travel every two or so years, A$163 per couple per fortnight on dining out, $81 on alcohol “or equivalent spent with charity or church”.


Read more: Why we should worry less about retirement - and leave super at 9.5%


It isn’t a reasonable guide to how much people need to live on, and certainly isn’t a reasonable guide for how much the government should intervene to make sure they have to live on. They are standards it doesn’t intervene to support while people are working.

And there’s something else. Super isn’t what will fund it. Most retirement living is funded outside of super, either through the age pension, private savings, or the family home (which saves on rent). Most 65 year olds have more saved outside of super than in it, and a lot more than that saved in the family home.

It’s a slight of hand to say that retirees need a certain proportion of their final wage to live on and then to say that that’s how much super should provide.

Question 3: Does it come out of wages?

The best guess is that, although paid by employers in addition to wages, compulsory super comes out of what would otherwise have been their wage bill.

Treasury puts it this way:

Though compulsory superannuation guarantee contributions are paid by employers, wage setting generally takes into account all labour costs. As such, it is widely accepted that employees bear the cost of higher superannuation guarantees in the form of lower take home pay.

The inquiry will probably make its own determination. If it finds that extra contributions do indeed come out of what would have been pay rises, it will have to consider the tradeoff between lower pay rises (and they are already very low) and the compulsory provision of more superannuation in retirement.

Question 4: Does it boost private saving?

It’d be tempting to think that the compulsory nature of compulsory superannuation meant that each extra dollar funnelled into it increased retirement savings by an extra dollar. But it doesn’t, in part because wealthy Australians who are already saving a lot have the option of offsetting it by saving less in other ways.

For them, the increase in saving isn’t compulsory.

For financially stretched Australians unable to afford to save (or for Australians at times in times life when they can’t afford to save) the compulsion is real, and unwelcome.

The inquiry will have to make its own assessment, updating Reserve Bank research which found in 2007 that each extra dollar in compulsory accounts added between 70 and 90 cents to household wealth.

Question 5: Does it boost national saving?

Boosting private saving (at the expense of people who are unable to escape) is one thing. Boosting national savings (private and government) is another. The tax concessions the government hands out to support superannuation are expensive. The concession on contributions alone is set to cost $19 billion this year and $23 billion in 2022-23, notwithstanding some tightening up. It predominately benefits high earners, the kind of people who don’t need assistance to save.


Read more: Myth busted. Boosting super would cost the budget more than it saved on age pensions


On balance it is likely that the system does little for national savings, cutting government savings by as much as it boosts private savings. But because the question hasn’t been asked, not since the Fitzgerald report on national saving in 1993 shortly after compulsory super was introduced, we don’t know.

It’ll be up to the inquiry to bring us up to date.The Conversation


Peter Martin, Visiting Fellow, Crawford School of Public Policy, Australian National University

This article is republished from The Conversation under a Creative Commons license. Read the original article.
Read more >>

Friday, September 27, 2019

The dirty secret at the heart of the projected budget surplus: much higher tax bills

The budget is bouncing out of deficit and is set to stay in surplus for the decade to come.

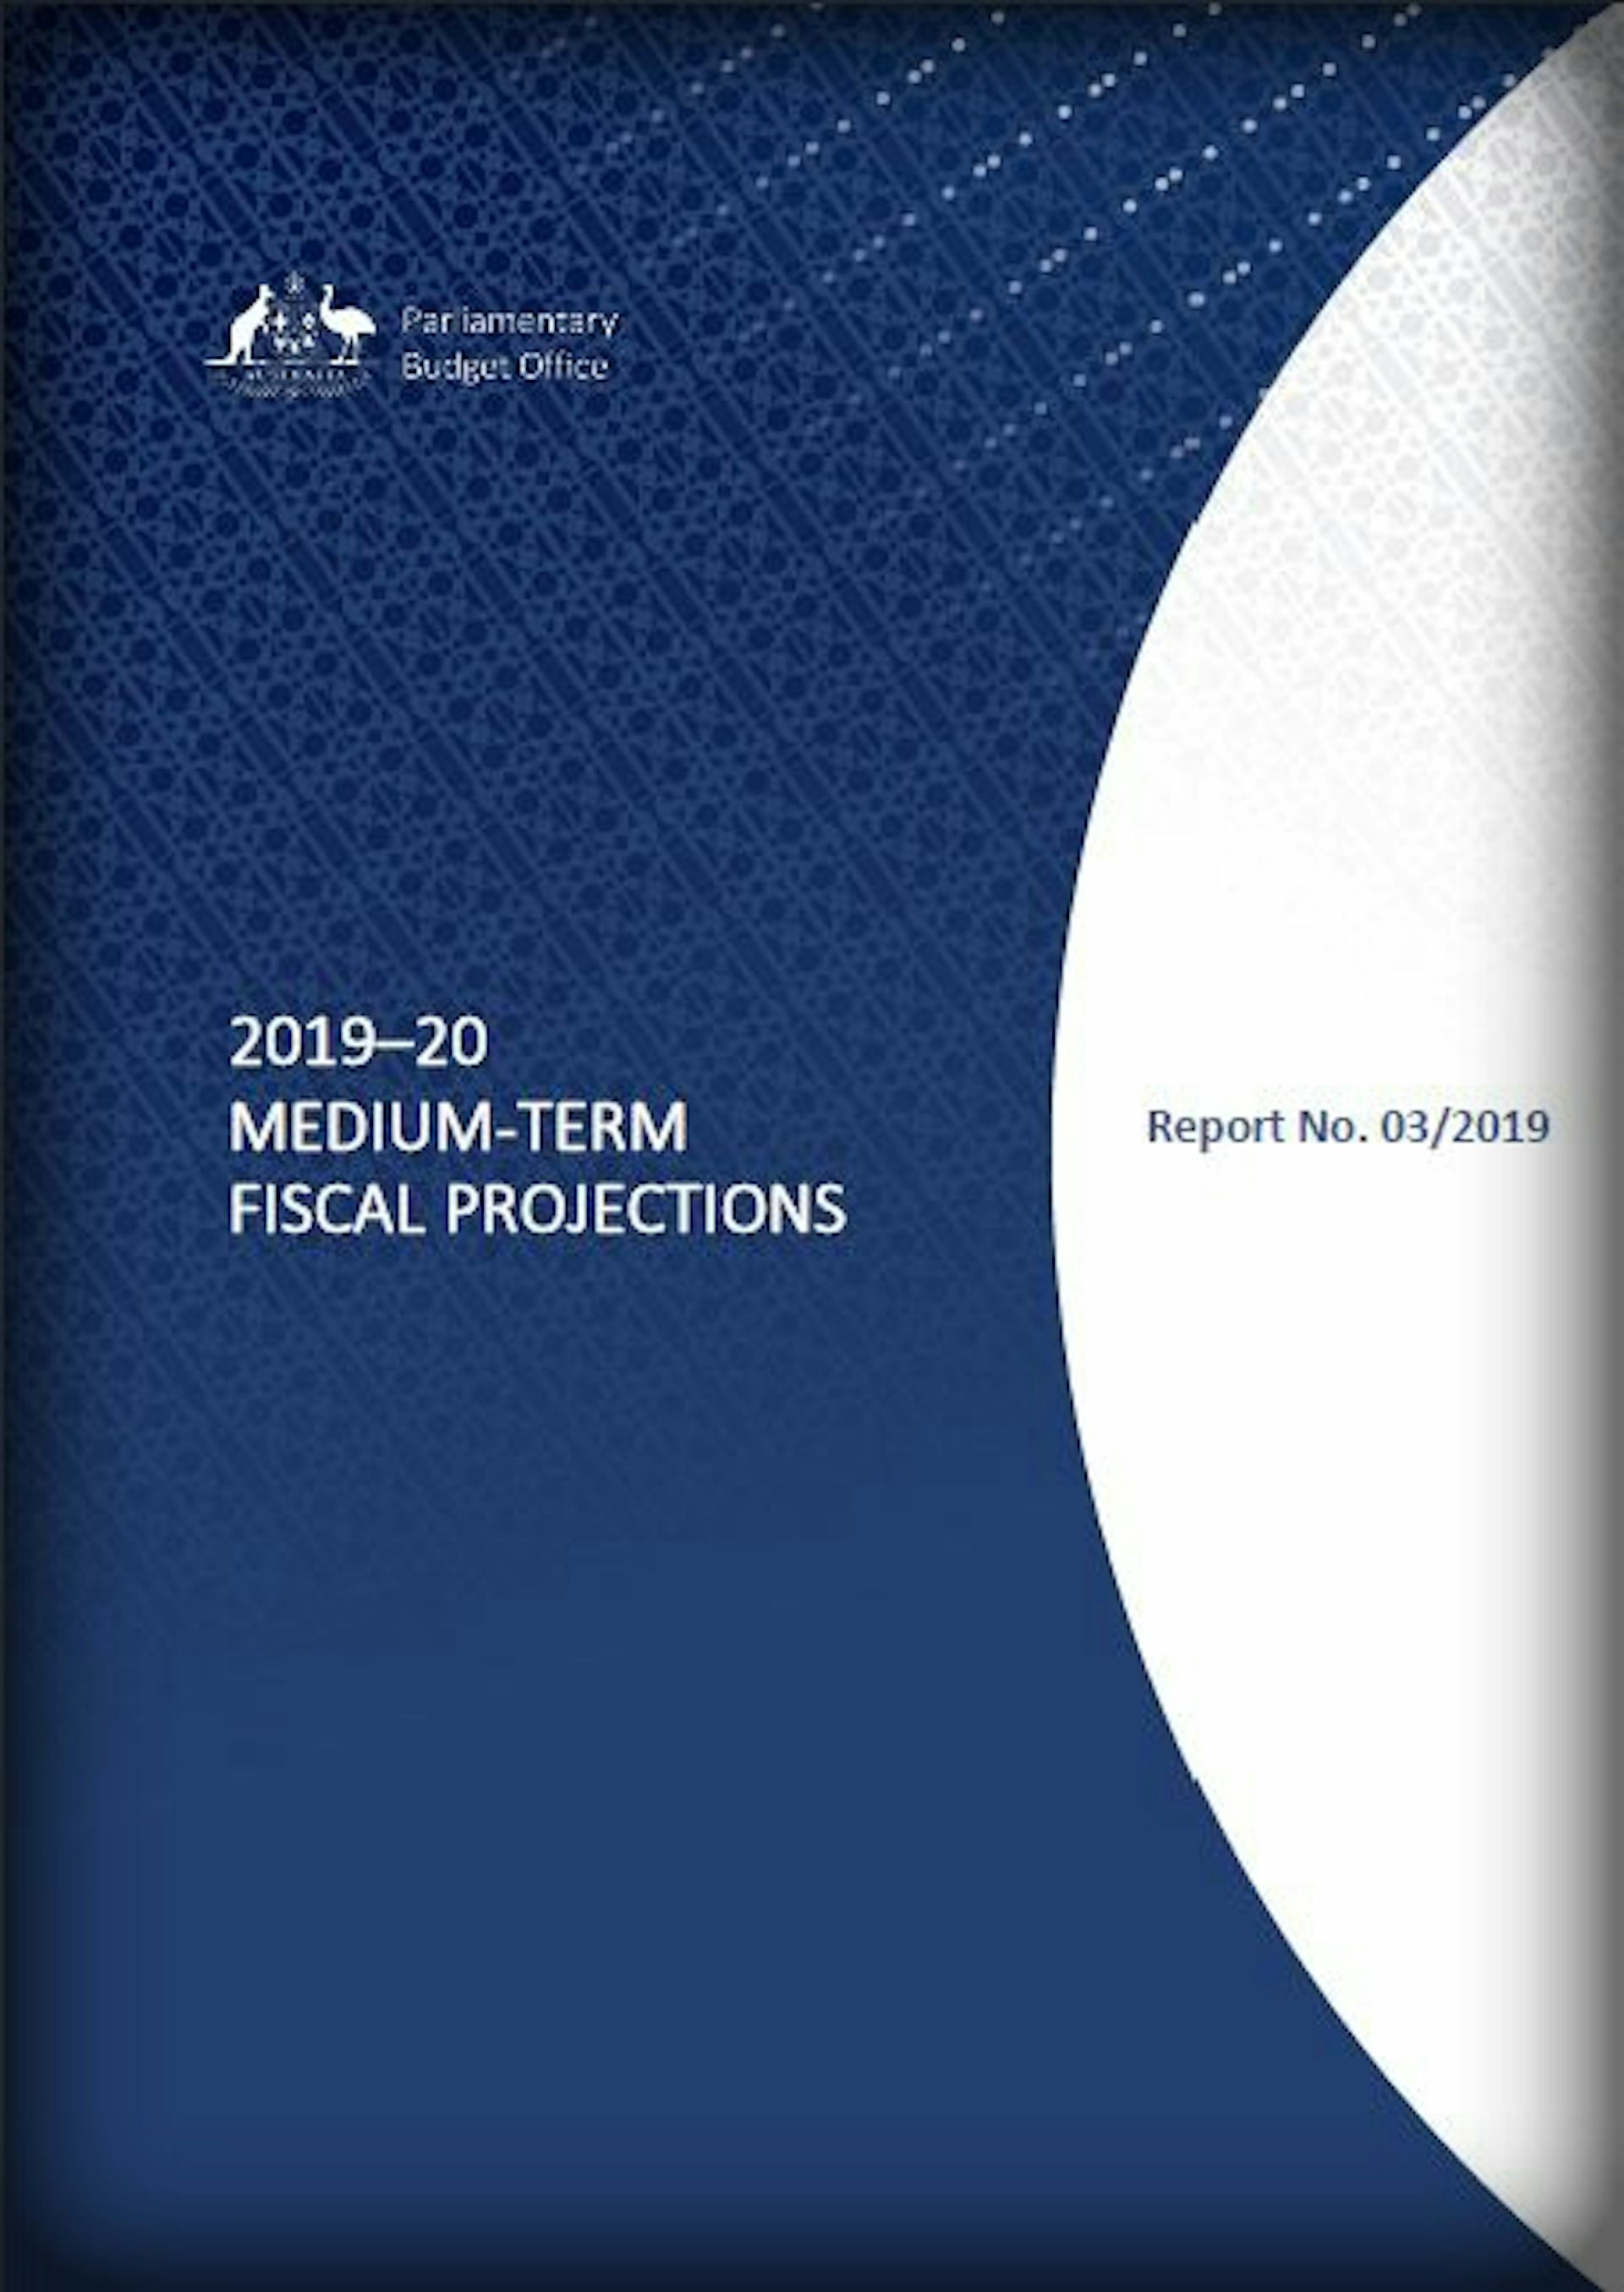
That’s what the April budget and the final budget outcome for 2018-19 tell us, and Thursday’s report from the Parliamentary Budget Office doesn’t say any different.

It doesn’t have much choice. The Parliamentary Budget Office is required to take the government’s surplus and deficit projections for the next four years as given, and to take its economic forecasts and tax and spending announcments for the next ten years as given, whether realistic or not.

What it is allowed to do, and does once a year in a publication entitled medium-term fiscal projections, is to set out the implications of those projections.

Those implications, spelled out on Thursday, show the projected budget surplus to be so fragile as to be unrealistic, except the parts that rely on much higher personal income tax collections.

That’s right: much higher income tax collections per person, even after taking into account the coming decade of legislated tax cuts.

Middle earners hit hardest

But it won’t be higher for all of us.

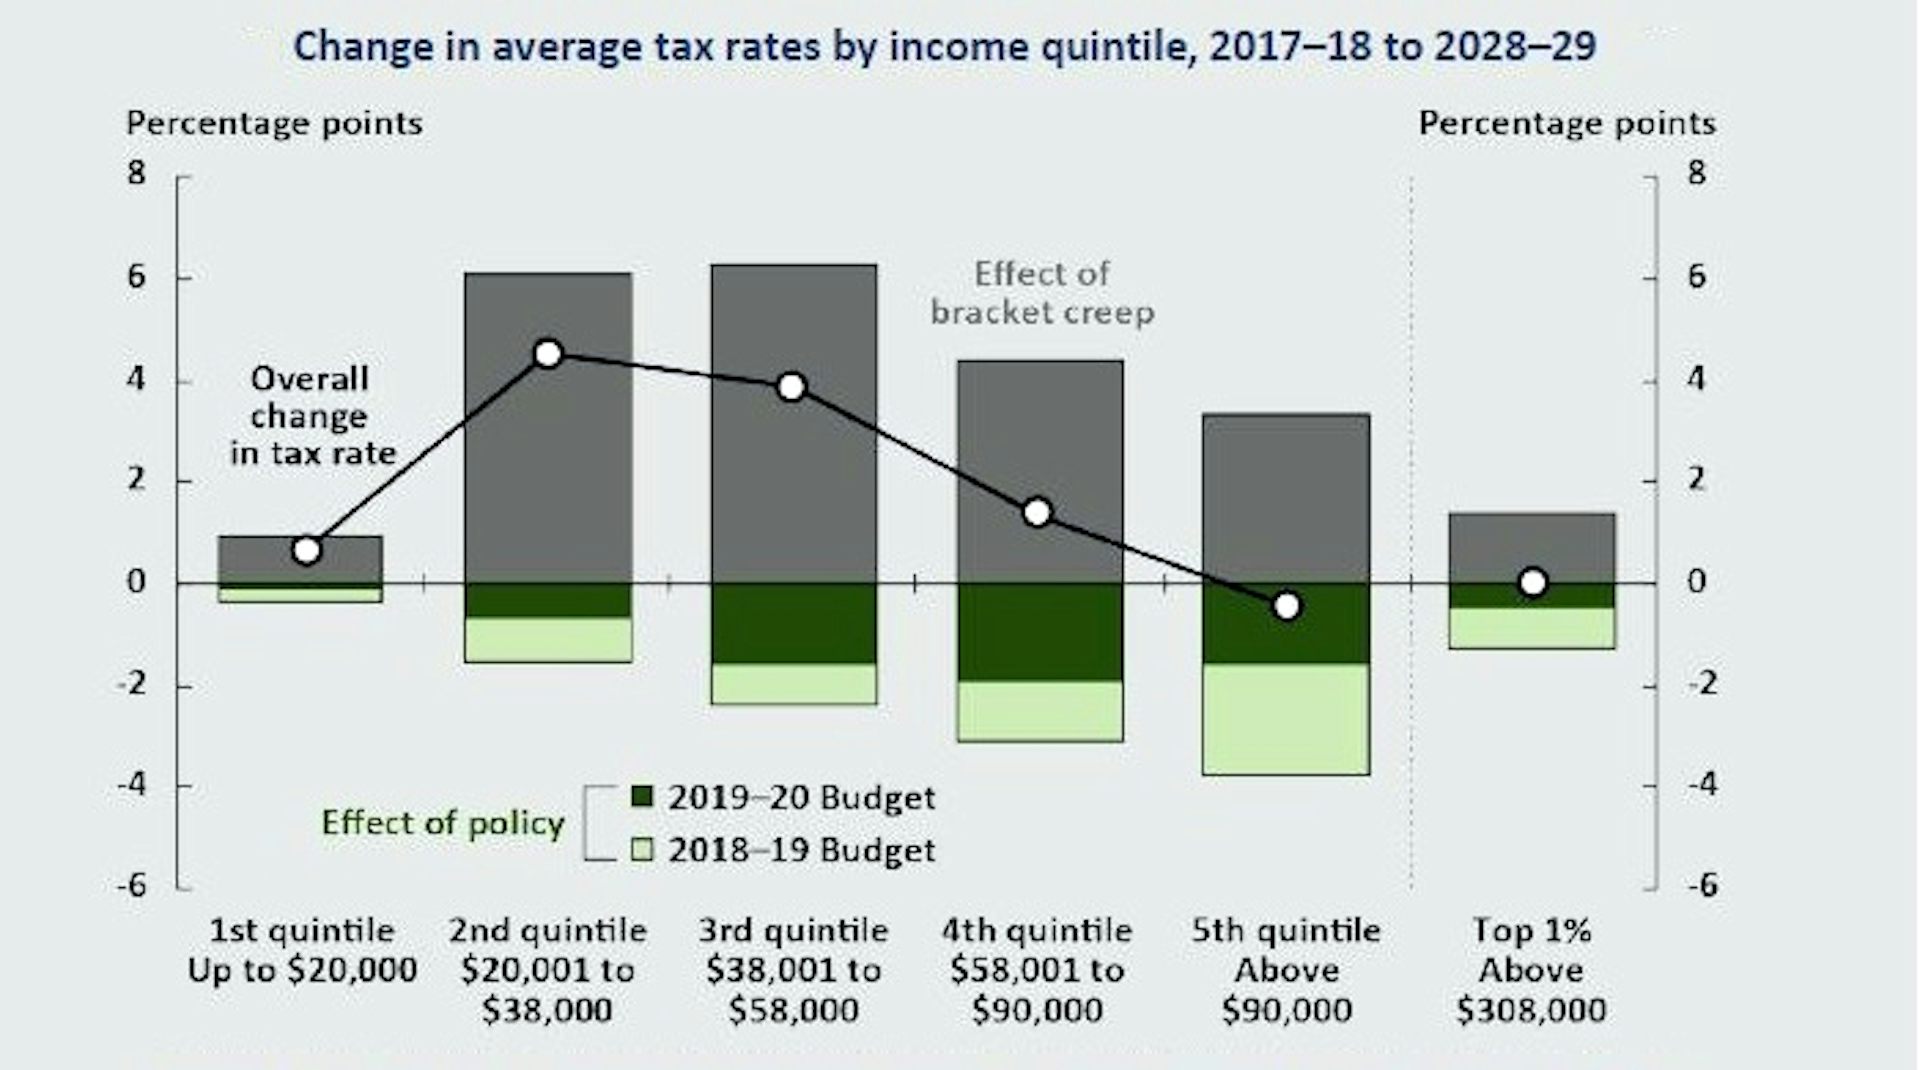
The middle fifth of earners will pay far more of their income in tax in ten years’ time under the government’s projections, according to the PBO’s calculations. Instead of paying 14.9% of their income in tax, by 2028-29 they will pay 18.8%.

That’s after taking into account the long-term tax cuts the government pushed through parliament in May and went to the election on.

Without those legislated tax cuts, they would have been paying an extra 6.3% of their income in tax. With the legislated cuts (and others pencilled in by the PBO to keep the government’s tax take within its promised ceiling) they will be paying an extra 3.9%.

Put another way, the government’s tax cuts will undo some of the damage caused by bracket creep as more of each pay packet climbs into higher brackets, but not most of it.

It’s the same for pattern for the second-lowest fifth of earners. They will move from paying 5.3% of their income in tax to 9.9%, a near doubling, which is taken is taken into account in the surplus projections.


Read more: Those future tax cut promises... they're nowhere near as big as you'd think


The second-highest fifth will move from paying 22% of their income in tax to 23.4%, even after the tax cuts. The bottom fifth, who don’t pay much tax, will move from paying 0.6% to 1.2%.

Highest earners escape

But workers in the top fifth, which at the moment is workers earning above A$90,000, won’t pay a cent more, at least not on average.

The government’s projections, as spelled out by the PBO, have them paying less of their income ten years from today than they do today.

Put another way, they are the only fifth of the population that won’t be expected to wear pain to keep the budget surplus.

There are other contributors to the budget surplus. One is a pretty hefty assumed decline in growth in government spending over the next decade, amounting to 1% of GDP, taking government spending from around 24.9% of GDP to around 23.9%.

Much of it is projected to come from tighter eligibility criteria for payments, and measures to constrain their growth, something the PBO believes might be difficult to maintain:

The spending restraint seen over the past few years may be increasingly difficult to maintain over coming years given the length of time over which restraint has been applied, the pressures emerging in some spending areas, and the potential need for fiscal stimulus, noting that the projected improvement in the budget balance is mildly contractionary.

What it is saying, gently, is that it the longer the government attempts to restrain spending (for instance by imposing tough conditions on access to benefits and using debt collectors to recover alleged overpayments), the harder it will get.

And it is saying the government might need to spend in ways it hasn’t accounted for, including on measures to support the economy in the event of a downturn.

Budget conventions to the rescue

The projections assume the opposite of a downturn.

No blame should attach to this government for them, but our rather odd budget conventions dictate that the worse the economy is, the better the budget’s projections for economic growth. That’s right: the weaker our current economic growth, the stronger the budget’s projections for future economic growth.

The thinking is that over the long term, the economy should grow at roughly its long-term average growth rate. To get there when the economy is weak, as it is now, the budget assumes several years of stronger than normal economic growth to catch up.


Read more: Their biggest challenge? Avoiding a recession


In this case it’s five years of stronger than normal economic growth.

The PBO contents itself with the observation that economic growth that was merely normal (or worse, remained weaker than normal) for some of those years would have a “significant and compounding effect on the budget position over time.”

The surplus is far from assured, and it shouldn’t be. The government might well find that it can’t and shouldn’t restrain spending on payments as much as is projected in the decade ahead, and it might find it needs to spend to support the economy.

It will almost certainly find that lifting the tax take on middle Australians from 14.9% of income to 18.8% is intolerable.The Conversation


Peter Martin, Visiting Fellow, Crawford School of Public Policy, Australian National University

This article is republished from The Conversation under a Creative Commons license. Read the original article.
Read more >>

Friday, September 20, 2019

It's Newstart pay rise day. You're in line for 24 cents, which is peanuts

Newstart recipients and other Australians on benefits get their half-yearly pay rise today (and also on March 20). This one is vanishingly small.

Announced very quietly by Social Services Minister Anne Ruston earlier this week, it amounts to just A$3.30 per fortnight for someone on the Newstart unemployment benefit.

That’s $1.65 per week, less than 24 cents per day.

It’s enough to buy about 36 peanuts – or more if you buy them in bulk.

More galling still for Australians on Newstart, age and disability pensions will increase by twice as much - $6.80 per fortnight, an increase the government was keener to highlight in its press release than the increase in Newstart.

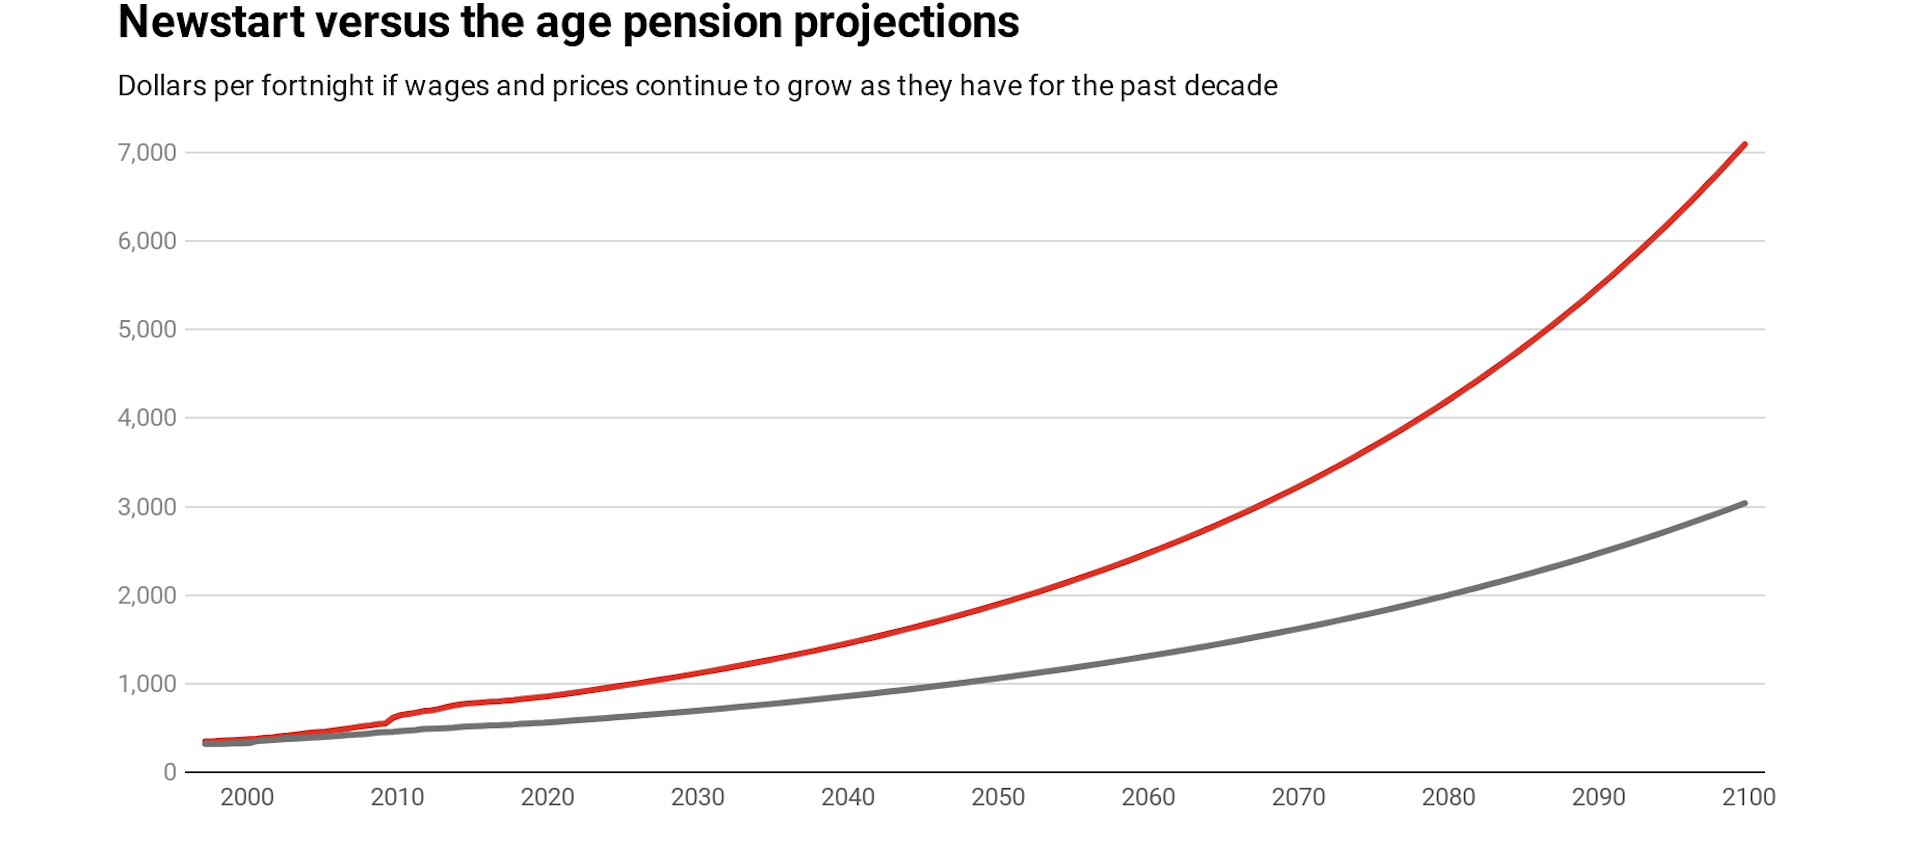
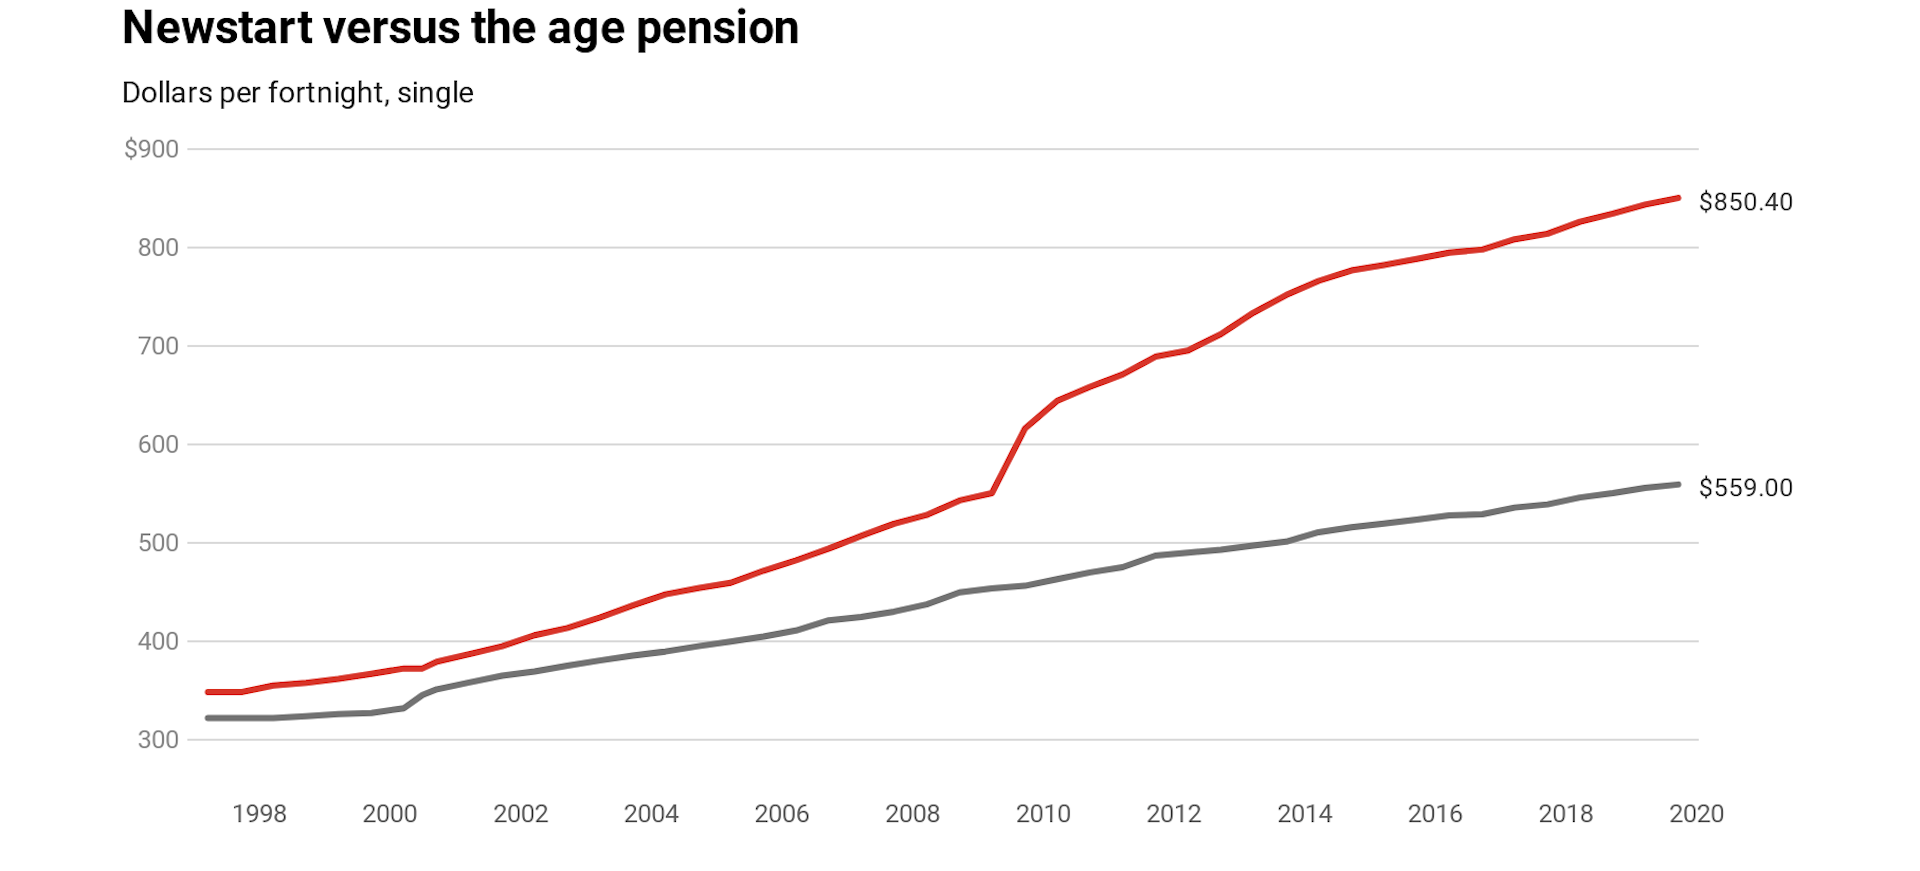
It is hard to comprehend how it could have come to this. Back in 1997 Newstart and the pension were about the same in dollar terms. Each was probably somewhat less than a single person needed to live on.

How did it come to this?

Then the Howard government effectively froze Newstart, forevermore increasing it only in line with inflation (which back then was typically 2.5% per year) while using a formula that lifted pensions in line with wage growth or inflation, whichever was the bigger (back then wages were growing by more than 3% per year).

The difference wasn’t big, but over the past two decades it has compounded. Prime Minister Kevin Rudd helped it along in 2009 by a one-off $64 per fortnight increase in the single pension, unmatched by an increase in Newstart.


It means that from today the single pension will be $850.40 per fortnight, while the single Newstart payment will be $559 – a mere two-thirds of the pension.

And it’ll get worse.

Because inflation is low, and each low increase is off what is now a much lower base than the pension, Newstart increases are small while pension increases are twice as big.


Read more: FactCheck: do 99% of Newstart recipients also receive other benefits?


If prices and wages continue to grow at the rates they have over the past decade (2.1% per year for prices, 2.7% for wages) by 2070 Newstart will be just half of the pension. By the end of the century it’ll be just two fifths of the pension.


If it can’t continue, it won’t

Herbert Stein was an economic advisor to US presidents Nixon and Ford. These days he is best remembered among economists for Stein’s Law, which says pithily:

If something cannot go on forever, it will stop.

It’s a warning against the dangers of extrapolations of the kind I have just done, and also a guide to the future. A Newstart rate of just two fifths of the pension, way below everyone else’s standard of living, would be intolerable.

The formula will change well before it gets that bad. It’ll have to.

John Howard himself said so last year:

I was in favour of freezing when it happened, but I think it has probably gone on too long.

The question is how it will change. Labor promised a review and an increase during the last election.

The Coalition is holding firm, although it can’t if it continues to remain in office.

A decade ago the Organisation for Economic Co-operation and Development warned that Newstart was low enough to raise “issues about its effectiveness in providing sufficient support for those experiencing a job loss, or enabling someone to look for a suitable job”.

The budget surplus will help

The Australian Council of Social Service wants the government to lift Newstart by $150 per fortnight to $709, still well short of the pension, and afterwards to lift it in line with the pension and wages, so that it never falls further behind.

It wants the same for Youth Allowance, Austudy, Abstudy, Sickness Allowance, Special Benefit, Widow Allowance and Crisis Payment, which all move in line with Newstart.

The hit to the budget would be $3.3 billion per year, small enough to be funded by projected surpluses.


Read more: Are most people on the Newstart unemployment benefit for a short or long time?


And it would get smaller. Deloitte Access Economics says that after some years about $1.5 billion per year would return to the budget in extra tax as Newstart recipients and the other beneficiaries spent what they were given and boosted economic growth.

They’d have to.The Conversation


Peter Martin, Visiting Fellow, Crawford School of Public Policy, Australian National University

This article is republished from The Conversation under a Creative Commons license. Read the original article.
Read more >>

Wednesday, September 04, 2019

GDP. Why we've the weakest economy since the global financial crisis, with few clear ways out

The Australian economy is tepid, with consumer spending the weakest in ten years, business investment shrinking, and economic growth too weak to cover population growth.

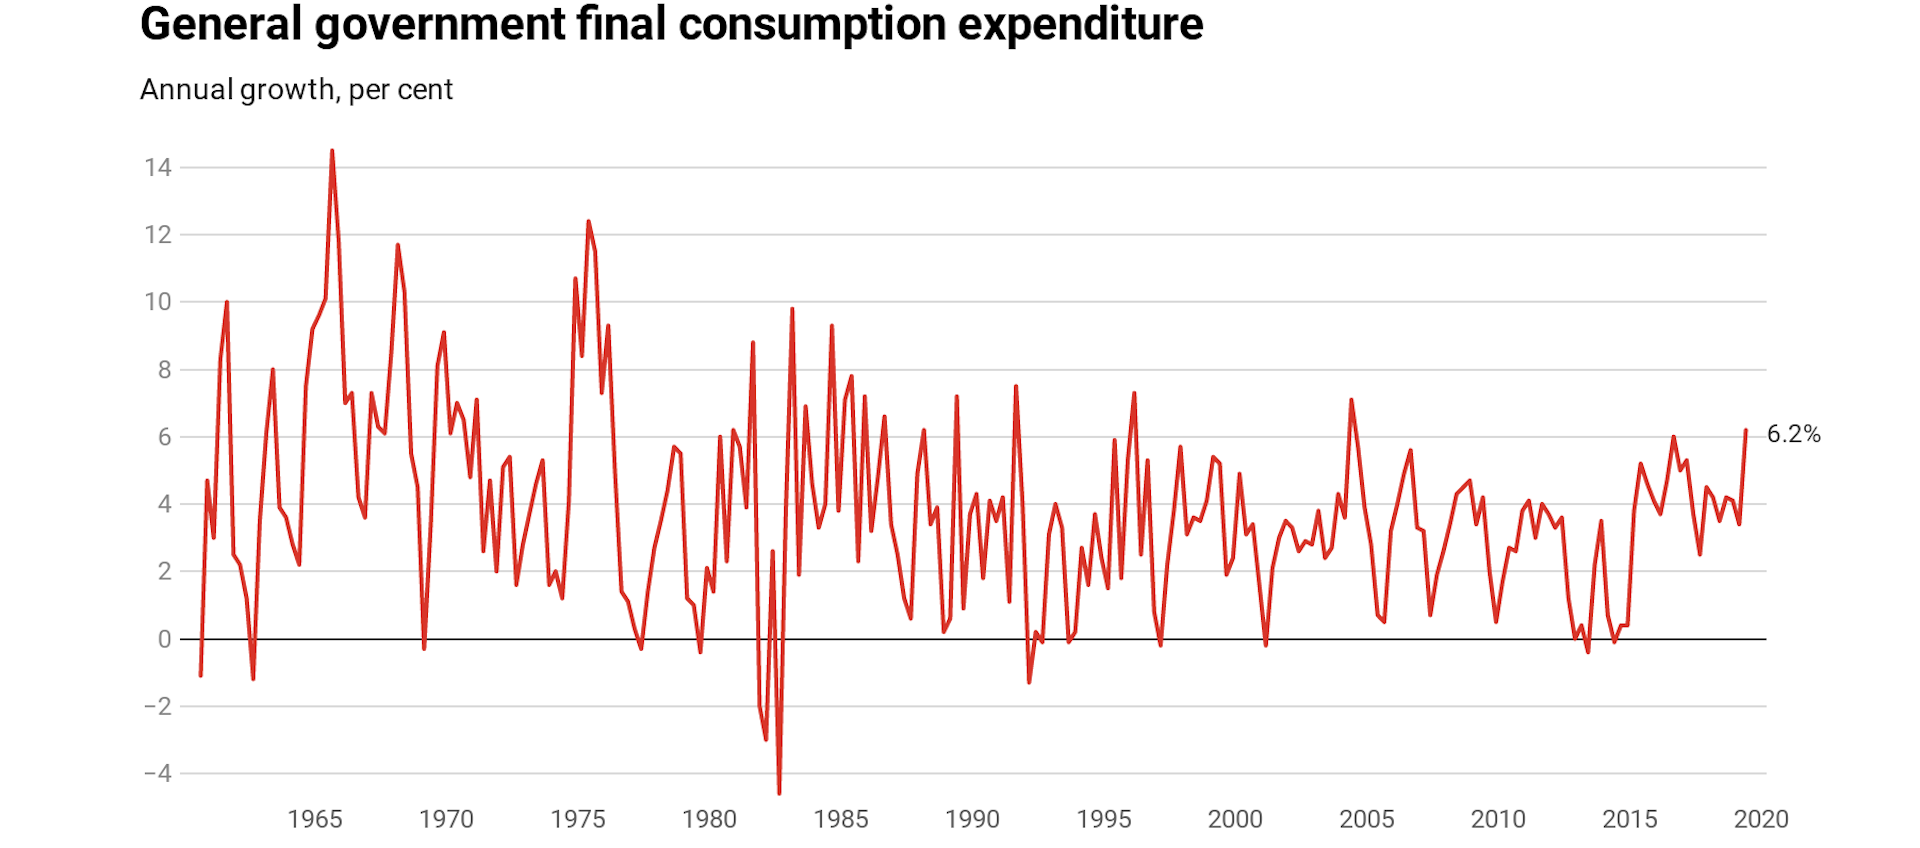
Were it not for very strong growth in export income and the biggest surge in government spending in 15 years, the economy would have shrunk.

The Treasury believes the Australian economy is capable of growing at a sustained annual pace of 2.75%. The growth rate in the past financial year of 1.4% reported on Wednesday is only half that.

Not since September 2009 has the gap between what the Australian economy is capable of and what it has been delivering been so wide. 2009 was the year of the global financial crisis.


Real GDP growth


Economic growth has rarely been as low as 1.4% outside of a recession.

When account is taken of population growth, income and production per citizen went backwards. The last time that happened was during the financial crisis. The last time before that was during the early 1990s recession.

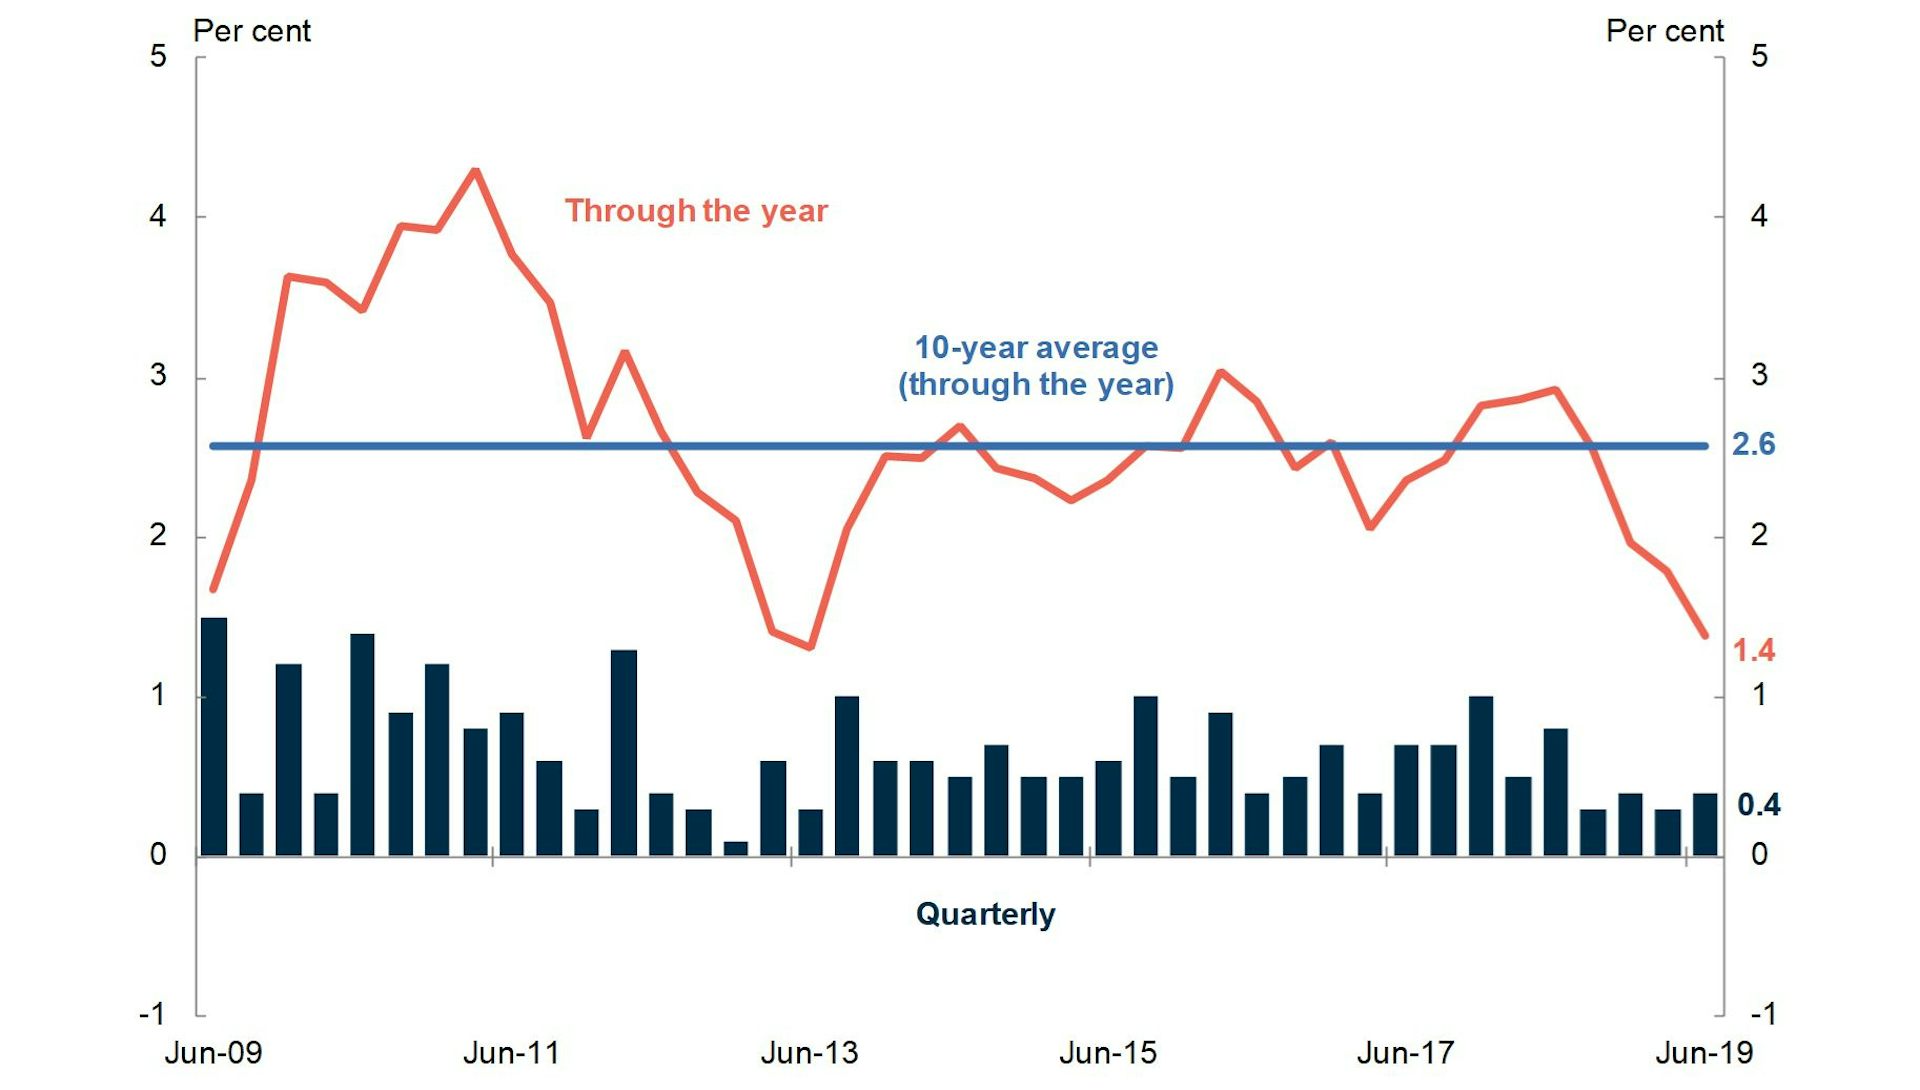
Household spending, which accounts for more than half of total spending, also failed to keep pace with population growth. The inflation-adjusted growth rate of 1.4% was also the lowest since the financial crisis.


Growth in household consumption


Other figures released on Tuesday show retail spending dipped a further 0.1% in July.

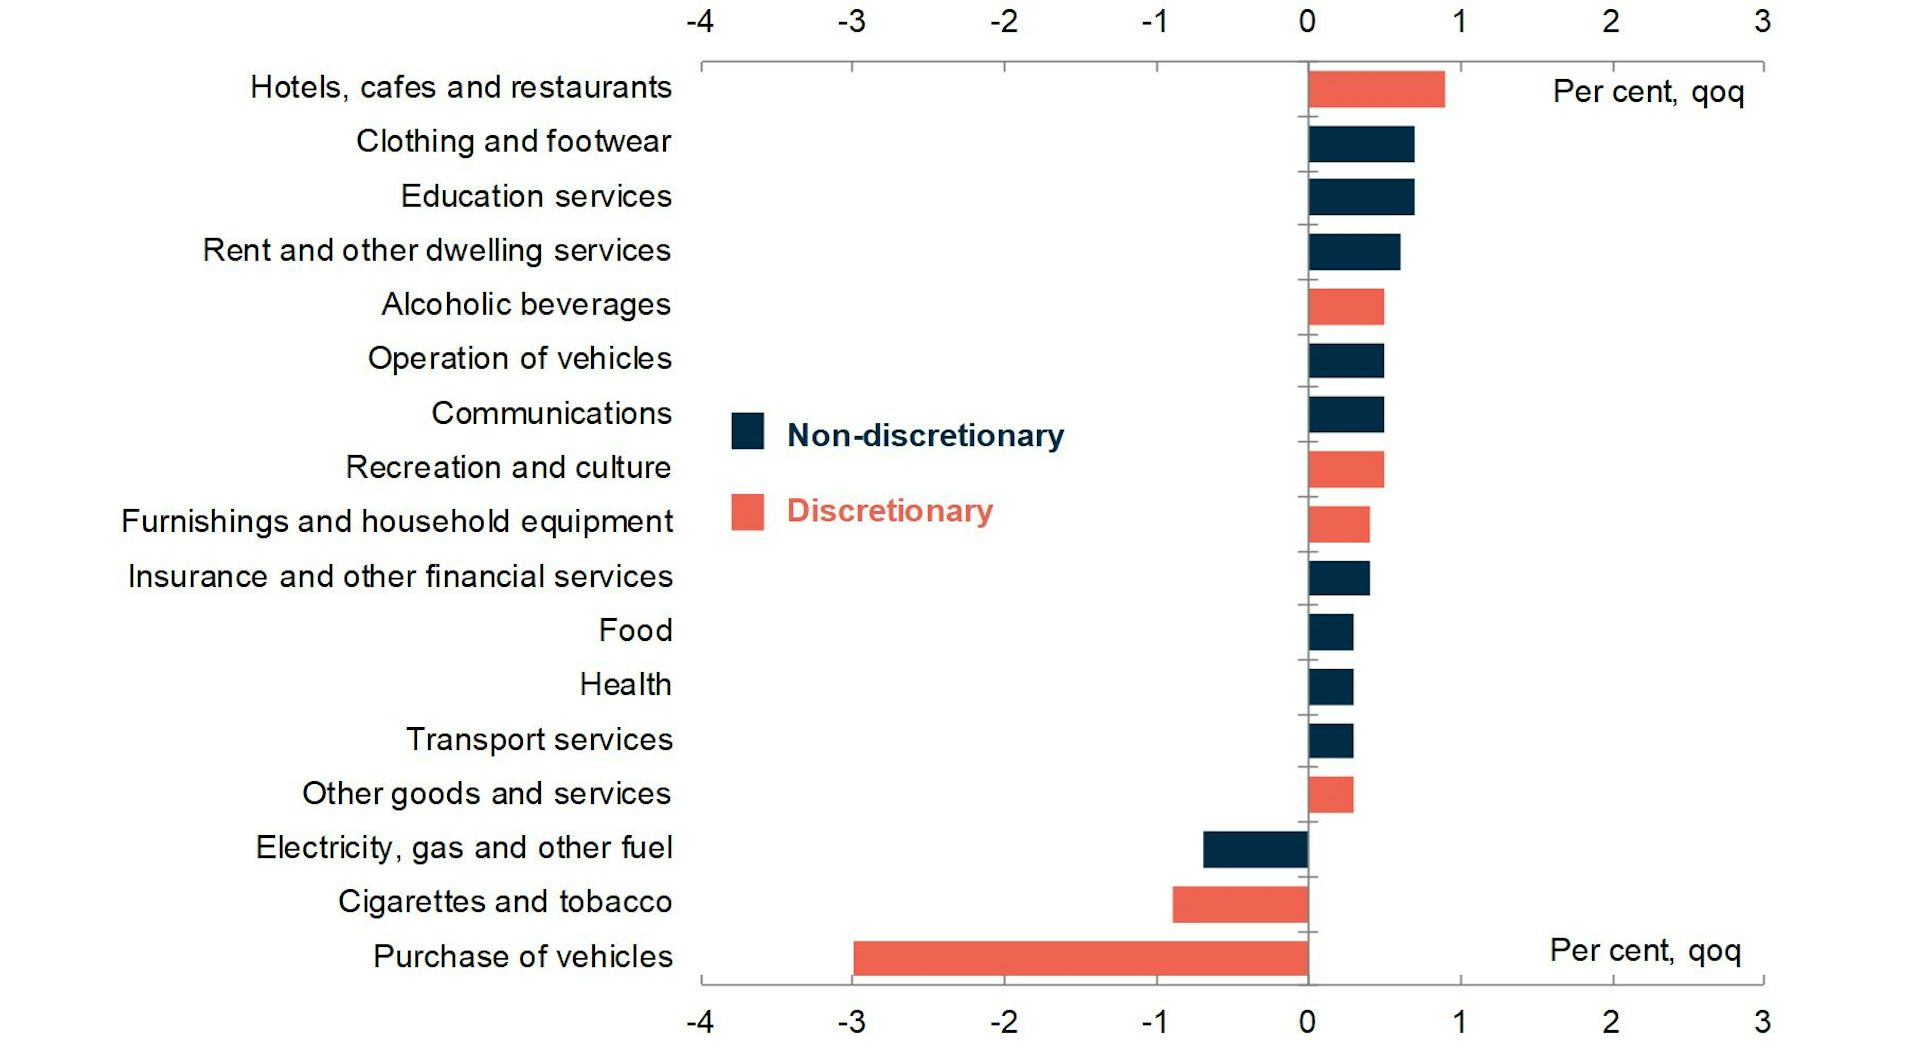
Hardest hit in the 2018-19 financial year was spending on cars. Updated figures released at the same time as the national accounts show sales of new cars down 10% over the year to August.

Treasurer Josh Frydenberg said he preferred to think that households were delaying rather than abandoning purchases of cars, waiting until the economic outlook was clearer.


Growth in consumption by category


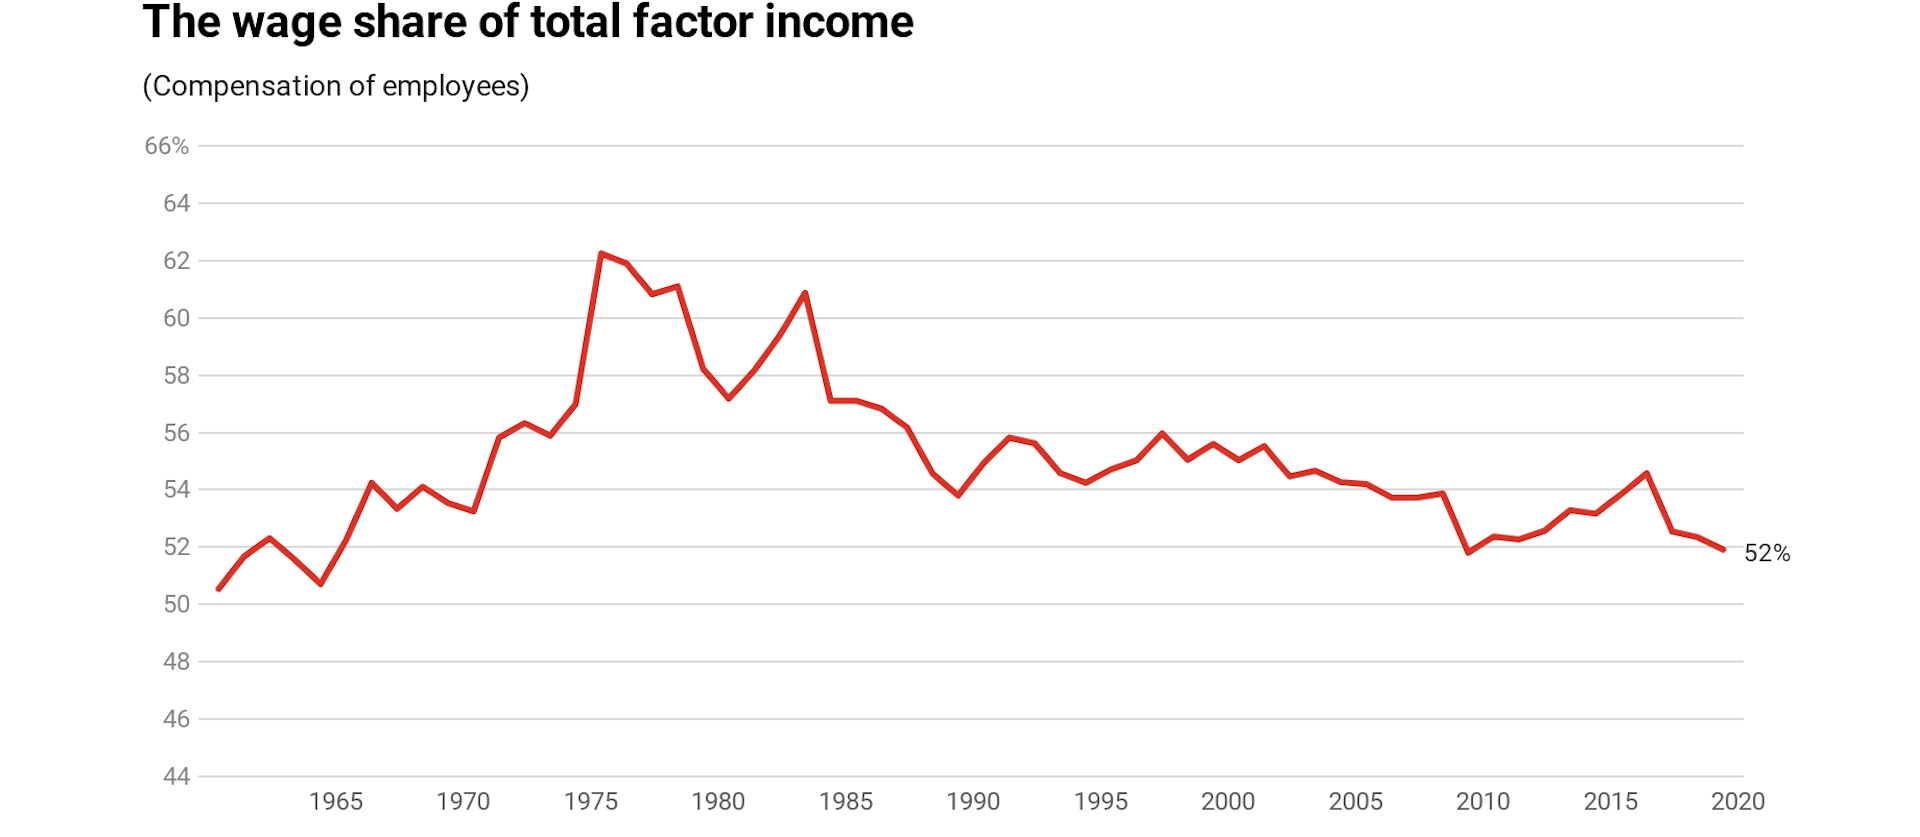
Weighing on consumers is an extended period of unusually low wage growth that the national accounts show has brought the share of national income paid out as wages down to just about its lowest point since 1964.

Although the wage and superannuation bill increased, climbing 5% over the year as employment grew, the share of national income paid out as wages and super fell to 52% – the lowest since the global financial crisis, and before that the lowest since the Beatles toured Australia and Donald Horne published The Lucky Country.


Also weighing on consumers has been housing. Investment in housing (including alterations and additions) was down 9.1% over the year. Business investment fell 10%.

Company profits grew 12.8%, but leaving aside mining companies, whose profits grew strongly on the back of higher prices and export volumes, other profits grew only weakly, climbing 1.8%.

Mining income pushed up nominal GDP (the raw dollars unadjusted for prices that drive nominal incomes) up a healthy 5.4%, probably delivering the government a budget surplus one year earlier than promised, in 2018-19. Frydenberg said he already knew the result and would unveil it in a fortnight. His smiles suggested it’s one he likes.


Nominal GDP growth


Mining income also pushed up what the Reserve Bank regards as the best measure of actual living standards, which (perhaps surprisingly) is not GDP per capita, which is going backwards, but a lesser known and purpose-designed measure known as “real net disposable income per capita”. It grew a healthy 2.65% over the year and a very healthy 1% over the quarter.

It is true that much of it was paid out in mining profits, but it is also true that it isn’t necessarily right to latch on to the cruder measure of GDP per capita and say that living standards are going backwards.

Helping maintain living standards was a very healthy growth in government spending, the highest for some time – not government infrastructure spending, that actually fell over the year as some state projects wound up, but day-to-day spending on things such as the National Disability Insurance Scheme.


Oddly, because of the way the national accounts work, economic growth was also helped by a slump in imports, down 2.8% over the year due largely to a slump in imports of consumer goods.

The economy is in a bad way. Aside from mining and government spending, the only real bright spot is employment growth, and as the Reserve Bank often points out, employment growth doesn’t tell us much about what’s going to happen.

It tends to lag everything else in the economy, by up to nine months. By the time it turns down, other things already have.

Few clear ways out

Frydenberg doesn’t seem too worried. For now he is banking on the tax cuts and the interest rate cuts in June and July to lift investment and spending.

The treasurer has two Plan Bs. One is an aggressive investment allowance for business. He spoke about introducing one last week, but on Wednesday he indicated that he wasn’t planning to do so until next year’s May budget. If needed, he could bring the date forward.

The other is another Reserve Bank rate cut, most likely at the board’s meeting on Melbourne Cup Day, by which time it will have before it an updated set of inflation figures.


Read more: 'Back yourself' Treasurer Frydenberg tells business. But it's not that simple


Frydenberg revealed on Wednesday that he is taking a close look at the government’s contract with the Reserve Bank, a formal written agreement which is renewed after each election.

He has asked the Treasury to look at it to see whether it needs to be tightened to make the bank more responsive to the state of the economy. This would mean more boldly cutting or pushing up rates.

In Britain, if inflation is 1 percentage point above or below the Bank of England’s target, it has to write to the government to explain why.The Conversation


Peter Martin, Visiting Fellow, Crawford School of Public Policy, Australian National University

This article is republished from The Conversation under a Creative Commons license. Read the original article.

Read more >>

Tuesday, September 03, 2019

After 44 years of deficits, we've a current account surplus. What went so right?

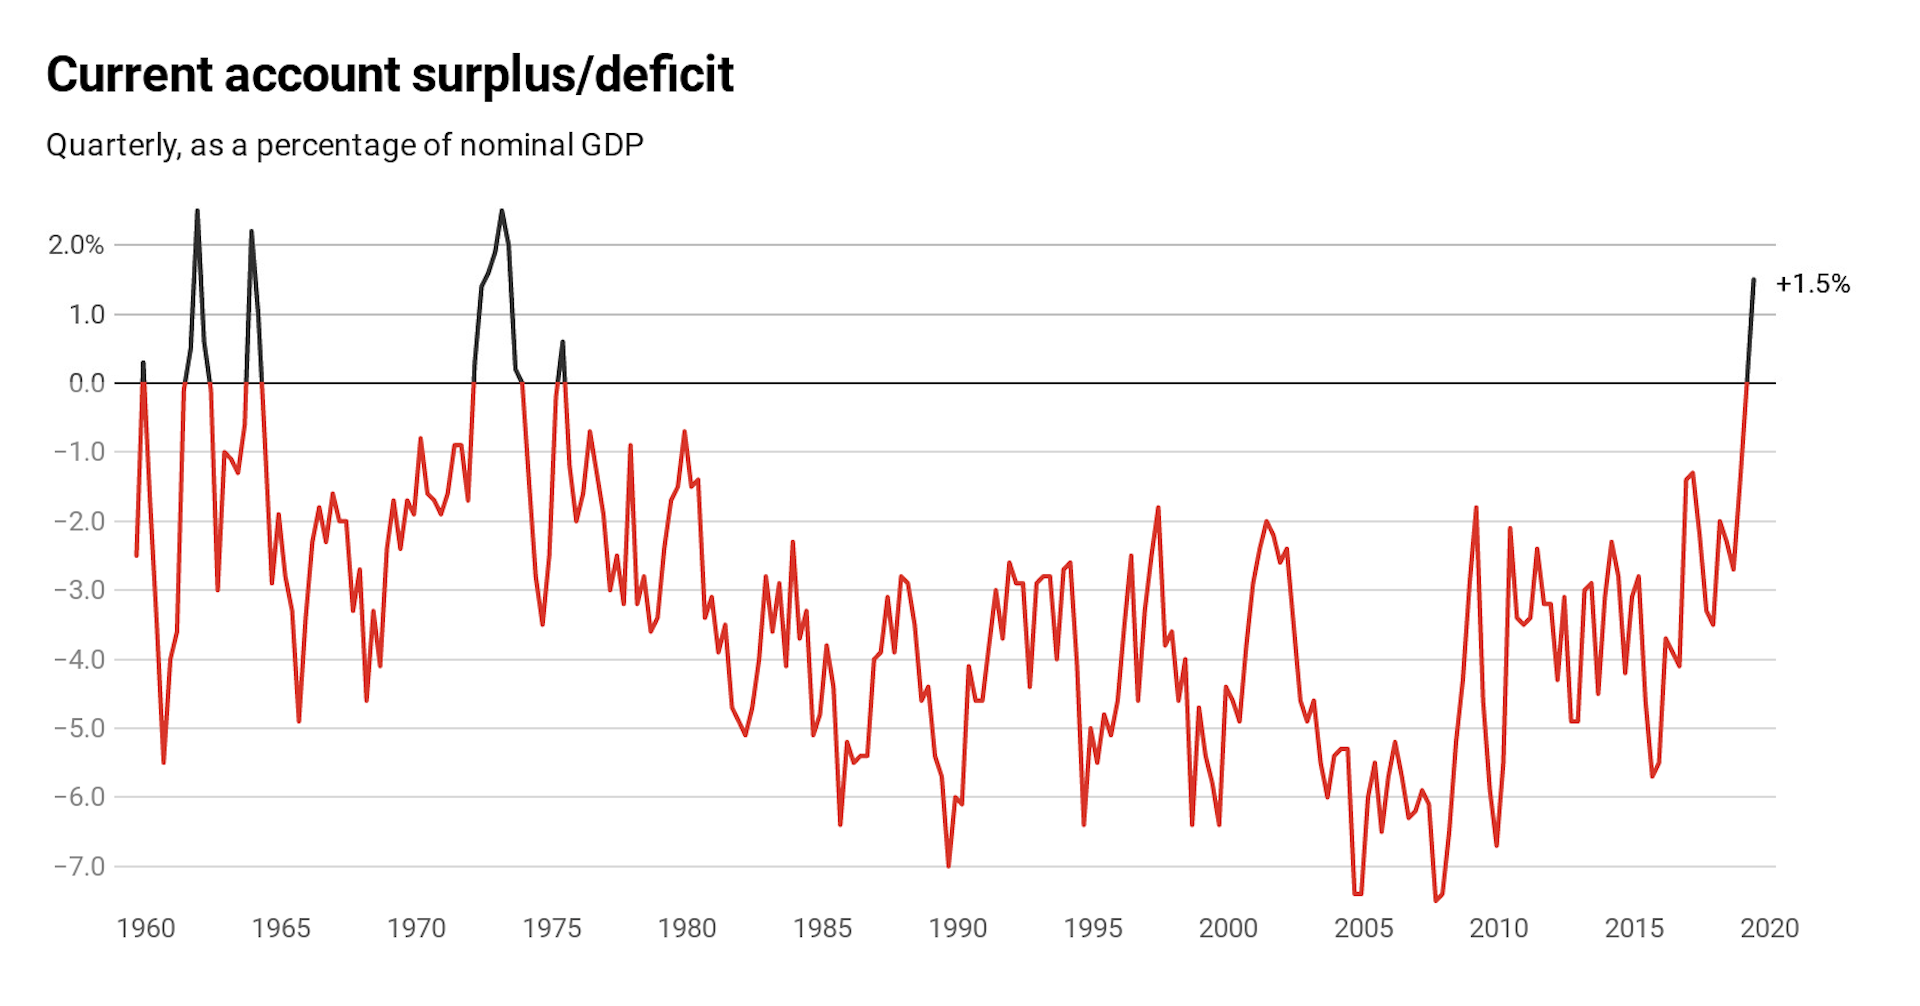
Australia has been in a current account deficit – paying more money out to the rest of the world than it took in – for 44 straight years, since September 1975.

Until today. The update from the Bureau of Statistics released on Tuesday shows that in the three months to June Australia actually took in more from the rest of the world than it paid out: A$5.9 billion more, after what for most Australians (most are under the age of 40) was a lifetime of paying out more.


Why has it happened, and how did we get away with doing the opposite for so long?

First, the long-term story. It couldn’t happen to an individual. No one person can get away with taking more in from the rest of the world than they pay out for long.

It was the idea that a nation is like an individual that allowed the then treasurer Paul Keating to spend a good deal of the 1980s arguing that Australia was living beyond its means.

As the drumbeat of a steadily growing current account deficit grew louder and it approached 5-6% of GDP, on May 14, 1986, he infamously told radio presenter John Laws that Australia was in danger of becoming a banana republic:

I get the very clear feeling that we must let Australians know truthfully, honestly, earnestly, just what sort of international hole Australia is in. It’s the prices of our commodities — they are as bad in real terms (as) since the Depression.

If this government cannot get the adjustment, get manufacturing going again, and keep moderate wage outcomes and a sensible economic policy, then Australia is basically done for. We will just end up being a third-rate economy … a banana republic.

To get spending down, and thus reduce the current account deficit, he tightened the budget and encouraged the Reserve Bank to push interest rates to stratospheric levels. The cash rate hit 18% before helping push Australia into recession .

And for what? The current account deficit continued. It averaged 4% of GDP throughout the 1990s and 2000s. But life went on. The economy recovered, the Bureau of Statistics stopped publishing monthly current account figures (moving to quarterly), the figures became little watched and the pundits and politicians turned their attention elsewhere.


Read more: Cabinet papers 1990-91: lessons from the recession we didn’t have to have


With the benefit of hindsight it is clear that the deficits weren’t because of any deficiency on the part of Australians. Reserve Bank deputy governor Guy Debelle explained last week that Australians weren’t spending an unusual amount compared to what they earned. They were “about on par with many other advanced economies”.

The current account deficits were largely the result of money flowing out as returns on investments in Australia. Australia had “a lot of profitable investment opportunities”. Foreigners either lent to Australian businesses or invested in Australian businesses and returns flowed out each month, as they should have.

It came to be known as the “consenting adults” theory of international finance. It’s practical message was: “nothing to see here, move along”.

So what’s changed?

In 2017 and 2018 the current account deficit shrank to around 2% of GDP. We now know that in the three months to June this year it moved into surplus.

Much of it is because we’ve been earning more from mining exports. We’re both exporting more tonnes and getting paid more for each one.

And just lately mining has helped in another way. The so-called mining investment boom is winding up. We are no longer importing enormously expensive machines to build gas terminals and the like.

And it’s more than mining. Export income from services such as education and tourism now accounts for 21% of all exports, up from 17% in the 1980s. Purists will complain that education and tourism aren’t actually exported, but as far as the national accounts are concerned, they are. Even though the teaching and hospitality takes place in Australia, it is paid for in foreign dollars that bring more money into the country relative to what is going out.

And there’s something else.

We are becoming like the US

As popular as Australia remains as a destination for foreign investment, since 2013 Australians have been investing even more in foreign businesses than foreigners have been investing in Australian businesses.

It is superannuation that’s done it: a record A$2.9 trillion worth.

Debelle put it this way:

This largely reflects the significant allocation to foreign equity by the Australian superannuation industry together with the fact that the superannuation sector is relatively large as a share of the Australian economy.

Australia has become a net foreign investor rather than a net recipient of foreign investment, almost certainly for the first time ever.

Debelle says it has made Australia come to resemble the United States. We receive more in dividends from overseas than we pay out in dividends to overseas share holders.

We’re still a magnet for foreign dollars

We are still a huge destination for foreign lending, increasingly in the form of lending to the Australian government rather than to Australian companies, as safety-conscious foreigners push locals out of the way to buy more and more Australian government bonds.

Foreign ownership of Australian government bonds has climbed from around 40% to 60% since the early 2000s.

The interest rate foreigners are prepared to accept in order to hold Australian 10 year bonds has fallen below 1% (which in its own way assists in keeping the current account deficit low).


Read more: Revisiting the banana republic and other familiar destinations


How long the current account surplus lasts will depend on the investment policies of our super funds (the better the prospects are overseas, the higher the surplus will be), the strength of our economy (the weaker is consumer spending, the higher our current account surplus will be) and export prices and volumes (which are mainly beyond our control).

Yes, we’ve current account surplus. It would have once been a cause for celebration. Now that we’ve got it, it’s not looking that special.The Conversation


Peter Martin, Visiting Fellow, Crawford School of Public Policy, Australian National University

This article is republished from The Conversation under a Creative Commons license. Read the original article.
Read more >>