Showing posts with label gdp. Show all posts

Tuesday, March 05, 2024

Prepare to hear about an ‘official recession’. Unofficially, we’ve been in one for some time

Australians are set to find out if we are on the edge of a so-called “official” recession.

Due out mid-Wednesday, the national accounts will either show spending, incomes and production continued to grow in the three months to December, or show they fell.

If they fell, it would be the first of the two strikes needed for what some people call an “official” recession. (Though surprisingly, there’s no such thing here in Australia, as I’ll explain later.)

The second strike would be a fall in the following three months, the so-called March quarter. If we get two quarters in a row, all manner of people – probably including the treasurer – will declare it a recession.

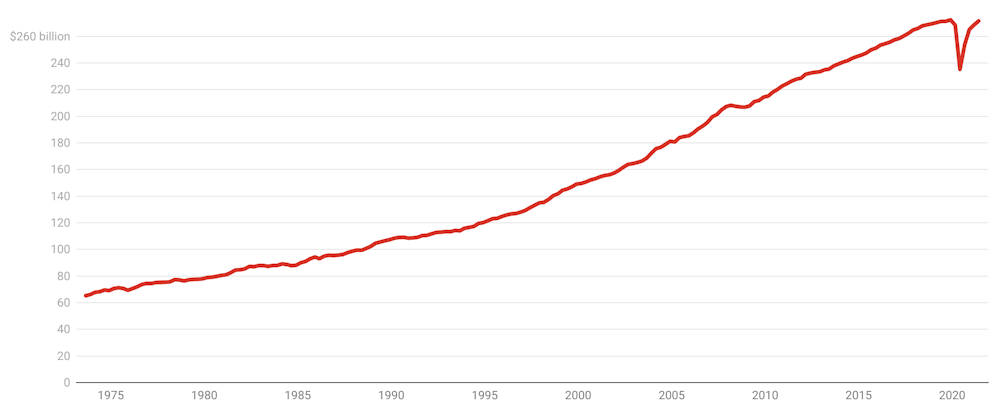
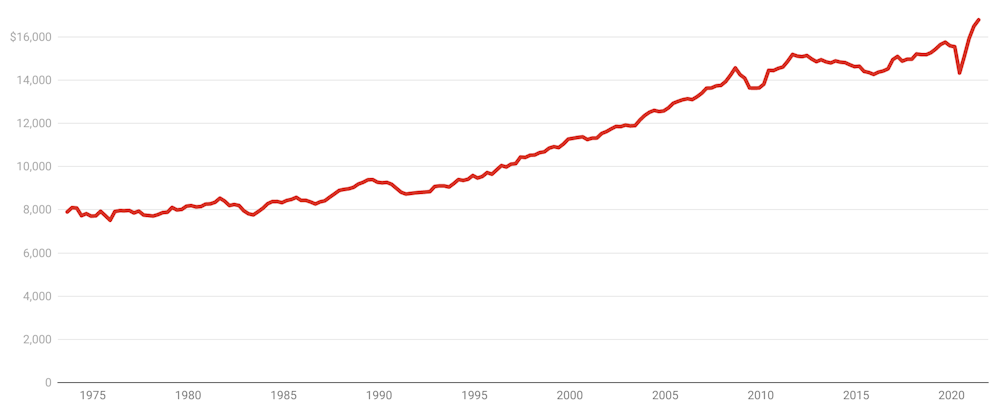
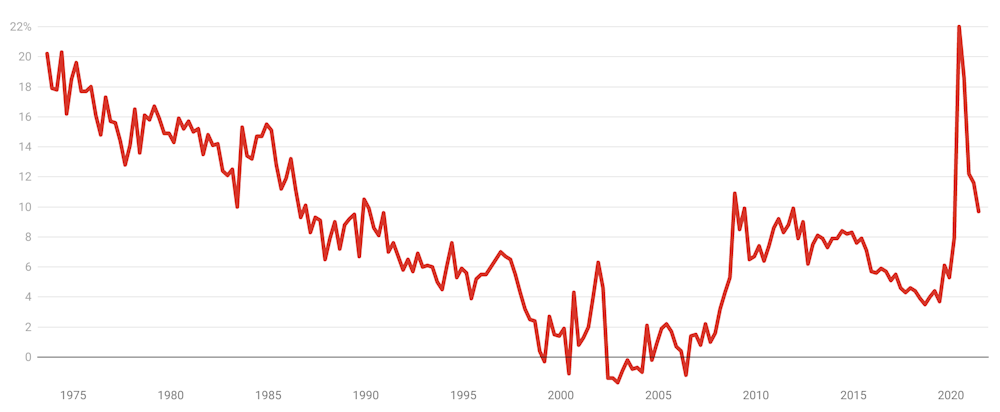
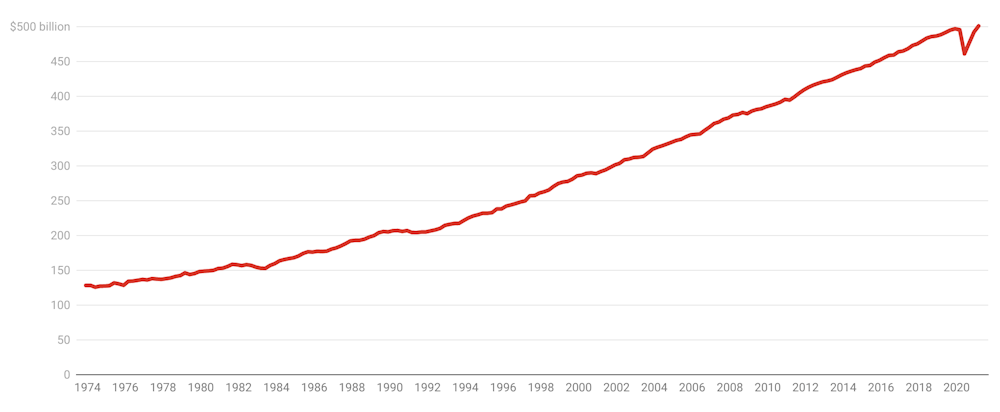
But whatever Wednesday’s data shows, the truth is we are already experiencing the biggest dive in living standards in half a century – and have been for two years.

How to spot a genuine recession

The figures due out on Wednesday will give us an indication of whether ordinary Australians are better or worse off, if we know where to look.

The first thing to do is to put to one side the headline increases or falls in gross domestic product (GDP). Those are spending, income and production over the entire economy each three months.

Those figures show GDP growth was weak before the pandemic, very weak during lockdowns (shrinking for two successive quarters), then strong as lockdowns ended. It’s been exceedingly weak since.


But this tells us little about spending and income per person, which is how each of us experiences daily life.

Adjusted for our current very high rate of population growth, GDP per person is extremely weak. It’s been falling, or barely growing, for three quarters now.


And even this doesn’t tell us enough.

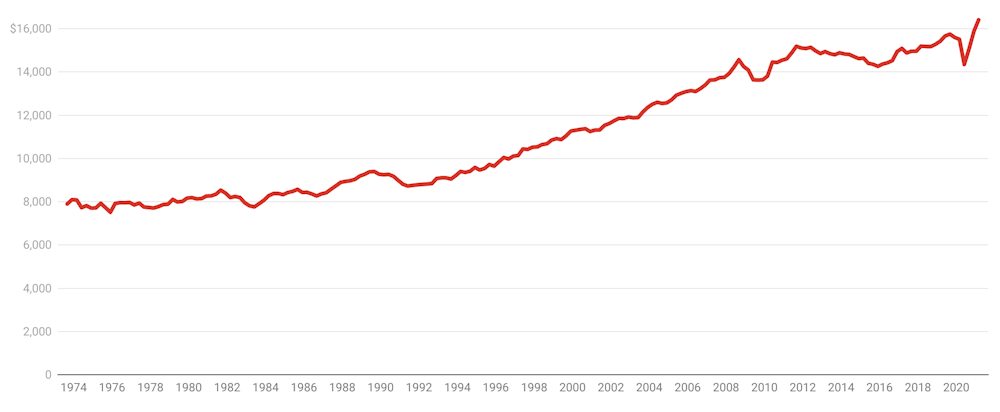
What matters most for each one of us – in the view of Chris Richardson, formerly of Deloitte Access Economics – is real household disposable income per capita.

Unfortunately, the bureau of statistics doesn’t display this on its website. But it’s easy enough to calculate from the bureau’s spreadsheets.

It’s the income accruing to households, adjusted for the prices paid by households, and then adjusted some more.

The bureau also subtracts taxes paid (which have climbed because of the expiry of the temporary tax offset in mid-2023). And it subtracts net interest payments, most of which are mortgage payments.


In his public presentations, Richardson says he refers to real household disposable income per capita as “living standards”, because that’s what it measures.

It shows weak spending, rising prices, a greater tax take, and much greater payments on mortgages have been shrinking living standards for two years.

That’s how it has felt for two years, even if the way the pain has been spread has been different than in the past.

The biggest dive in living standards in half a century

Previous dips in household disposable income per capita have been accompanied by high unemployment, concentrating the pain in the unlucky group looking for work at the time.

In contrast, this dip in living standards has been accompanied (so far) by low unemployment, pushing more of the burden onto working taxpayers.

Looked at through a longer-term lens (the longest the bureau’s spreadsheets allow) the latest dive in real household disposable income per capita is the biggest in half a century.


The broad picture is of fairly steady living standards until the mid-1990s, accelerating living standards during the 2000s mining boom, and then fairly flat (rising slowly) after the 2008-2009 global economic crisis.

They jumped for a bit during the COVID lockdowns, because of all the government assistance. But they’ve been diving since.

There’s no such thing as an official recession

Perhaps surprisingly, given how much we talk about “official” recessions, even the Reserve Bank of Australia says “there is no single definition of recession” here.

Many people talk about a recession meaning two quarters in a row of shrinking spending and income. This appears to date back to a 1974 New York Times article, written by a US business cycle expert Julius Shiskin.

He said two quarters of shrinking economic activity was one of the criteria you could use to decide whether or not an economy was in recession.

Shiskin’s pronouncement was subsequently latched on to by journalists all over the world, who made it the definition because it was simple.

But it has led to nonsensical conclusions.

How Australia and the US differ

Three decades ago, after the release of the September 1990 national accounts on November 29, Treasurer Paul Keating declared they showed Australia in recession.

Keating famously added:

the most important thing is this is the recession that Australia had to have.

Those words live on, but the so-called “recession” didn’t. It vanished soon after. What had been a small decline in economic activity, followed by a big decline, got revised to become a small increase, followed by a big decline.

How? The Australian Bureau of Statistics revises the national accounts as a matter of course, each time new information comes in.

Its revisions moved Australia’s early 1990s recession to the March and June quarters of 1991.

A “recession” even briefly appeared after revisions to the 2000 national accounts, under Prime Minister John Howard and Treasurer Peter Costello. Then it disappeared, after further revisions.

In the United States, they’re not nearly as mechanical. There, there isn’t an official recession until a committee of elders convened by the National Bureau of Economic Research says so. Its proclamations have broad support.

If Wednesday’s figures show Australia’s economic activity shrinking, we will hear a lot more about an “official” recession. But it will make little difference to Treasurer Jim Chalmers as he prepares this year’s May budget.

Just like the rest of us, he knows things are going backwards.The Conversation

This article is republished from The Conversation under a Creative Commons license. Read the original article.

Read more >>

Wednesday, December 01, 2021

GDP went backwards, but look at what’s to come

The most revealing graph presented in Wednesday’s September quarter national accounts is one showing what has happened just beyond the end of the September quarter, in the one we are in now.

Melbourne’s lockdown ended on October 27.

The graph uses anonymised bank account data to show what happened to spending in Victoria as soon as the lockdown was lifted.


Selected Victorian spending data

Aggregated bank data. Index for May 2020 = 100. ABS

Spending on clothing, furnishings, recreation, transport and restaurants and hotels surged.

As happened after last year’s lockdowns, Victorians returned to spending pretty much what they had before.

The September quarter national accounts released on Wednesday are a statement of their time – they show what things were like when NSW, Victoria and the ACT were locked down.

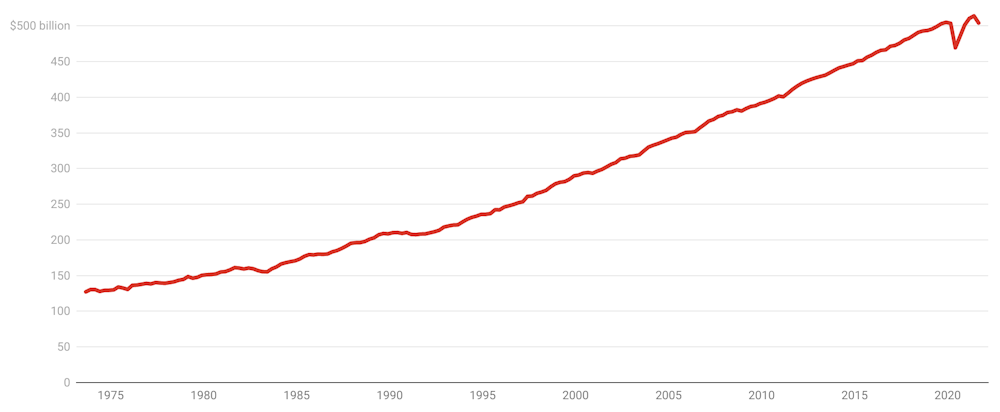
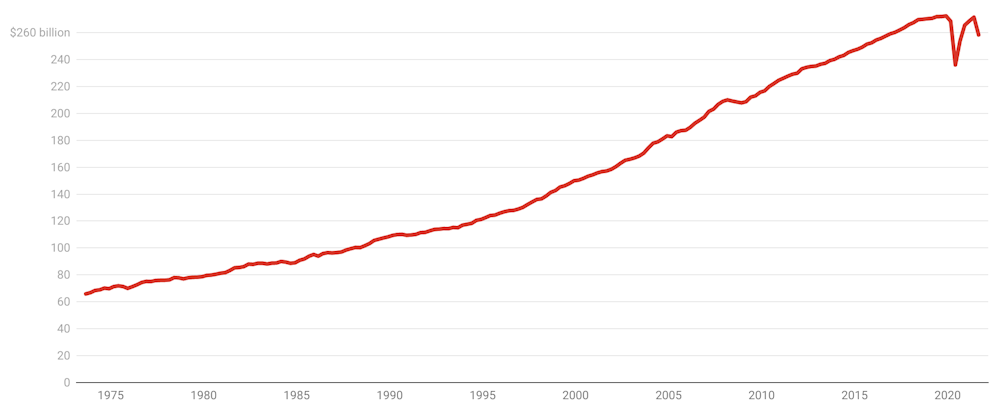
Australia’s gross domestic product shrank 1.9% in the three months to September, after climbing for four consecutive quarters following the record hit of 6.8% from the first wave of COVID and last year’s lockdowns.


Australian quarterly gross domestic product

Chain volume measures, seasonally adjusted. ABS

The biggest hit to GDP came from household spending, down 4.8% in the quarter.

National spending on hotels, cafes and restaurants fell 21.2%, spending on recreation and culture fell 11.8%, and spending on transport fell 40.8%.


Household final consumption expenditure

Chain volume measures, seasonally adjusted. ABS

But the decline was anything but national.

Whereas spending in hotels, cafes and restaurants collapsed 33% (or more) in each of the states that were locked down, in the states that weren’t, it barely suffered.

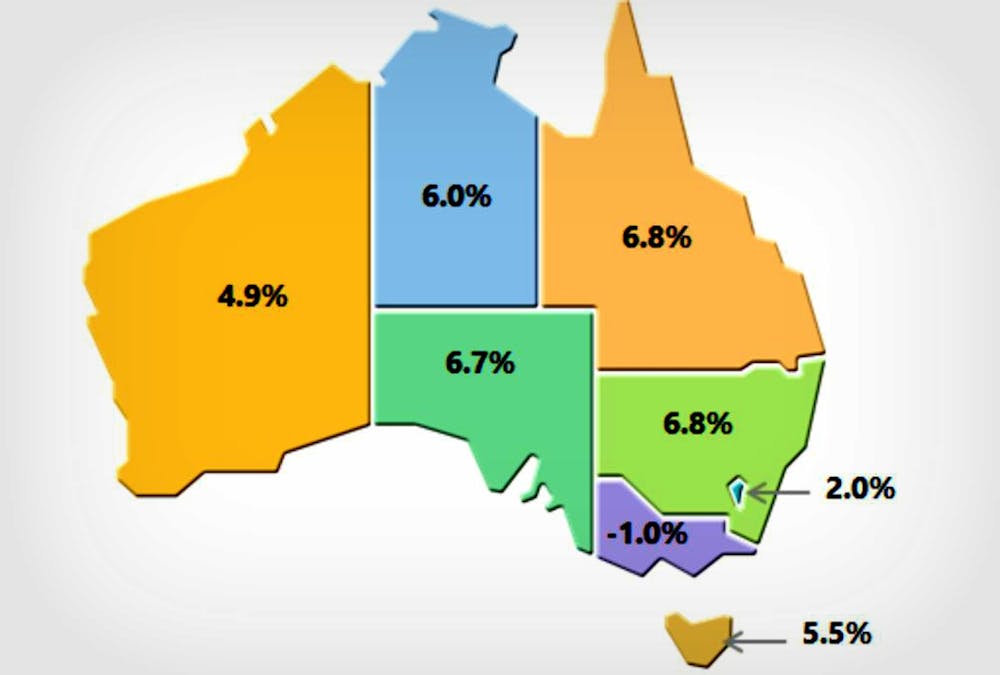
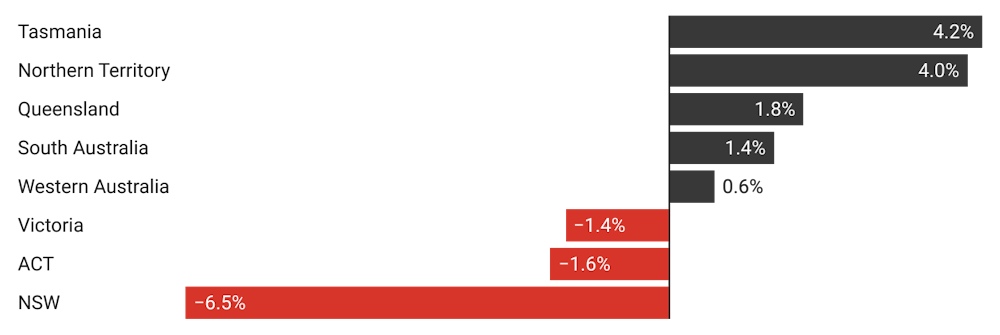
Aggregate spending shrank 6.5% in NSW, 1.4% in Victoria and 1.6% in the ACT, while climbing strongly in the states that weren’t locked down, surging an impressive 4% in the Northern Territory and 4.2% Tasmania.


State final demand, September quarter

Seasonally adjusted. ABS

Nationally, personal saving soared, with the jump centred in the lockdown states as those households whose income hadn’t taken a hit saved more because of concern about the future and fewer opportunities to spend.

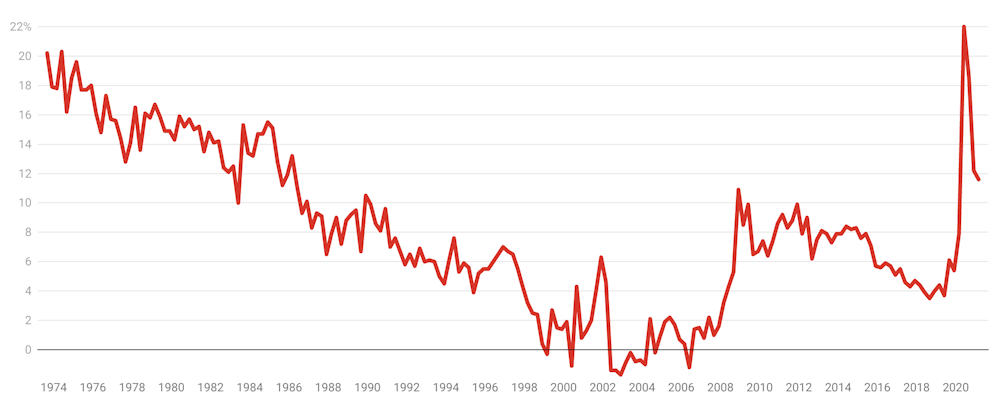
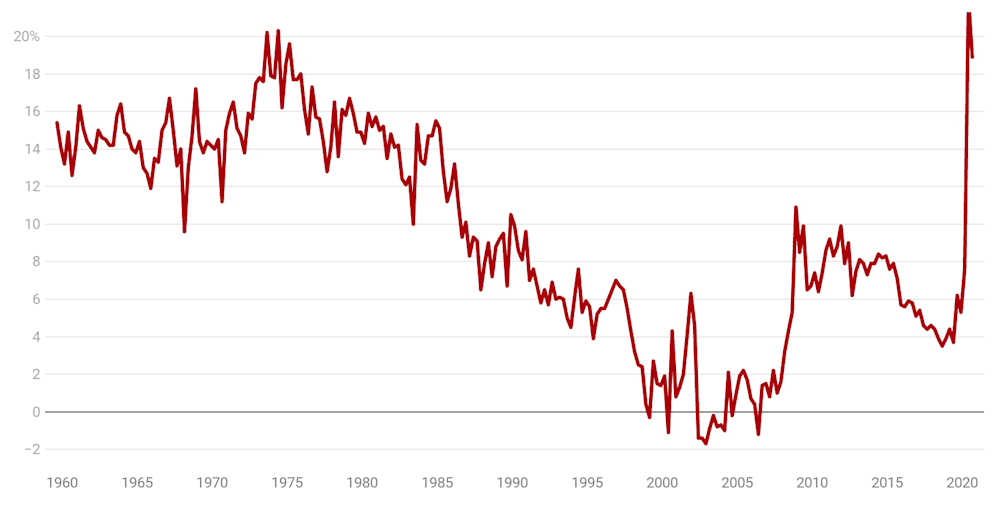
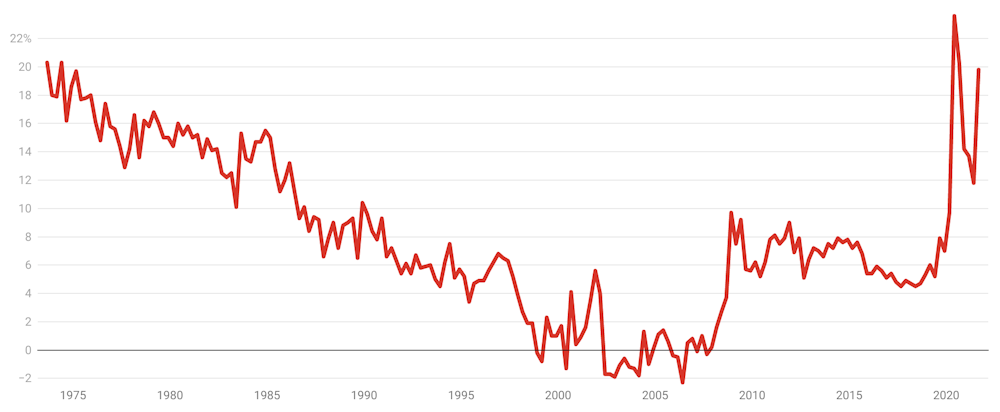
The national household saving rate bounded back up to an extraordinary 19.8% of household income from the 11.8% it fell to in March, after hitting an all-time high of 23.3% in the first wave of lockdowns.


Household saving ratio

Ratio of saving to net-of-tax income, seasonally adjusted. ABS

The bank-sourced data on post-lockdown spending in the lockdown states suggests household saving is already on the way down.

At his parliament house press conference, Treasurer Josh Frydenberg spoke of the unusually high saving rate as a source of future spending.

“Not all of it is going to be spent,” he said. “But it’s a lot of damn money that’s been accumulated”.

If household spending had been the only thing driving changes in gross domestic product, it would have been down 2.5%. Working in the other direction this quarter was a jump in net exports and a jump in government spending. Neither business investment nor housing construction changed much.

Organisation for Economic Co-operation and Development forecasts released late Wednesday have the Australian economy growing 4.1% in 2022, up from 3.8% this year, slipping back to 3% in 2023.

Sustained low unemployment forecast

The OECD Economic Outlook has Australia’s unemployment rate falling to 4.7% in 2022 and 4.3% in 2023. It says as inroads are made into unemployment, wage and price pressures will build, but are expected to “remain contained”.

The organisation welcomes Australia’s commitment to net zero emissions by 2050, but says the strategy should be “comprehensive, effective and inclusive”. Its report backs a call for an independent review of the Reserve Bank.

It forecasts global growth of 4.5% and 3.2% in 2022 and 2023.

Peter Martin, Visiting Fellow, Crawford School of Public Policy, Australian National University

This article is republished from The Conversation under a Creative Commons license. Read the original article.
Read more >>

GDP is like a heart rate monitor: it tells us about life, but not our lives

How much cash would you need to be paid to agree to live without a smartphone for a year?

If you are like the typical American, the answer is US$10,000 – which is far, far more than what we are actually charged for having and using smartphones.

How much would you need to be paid to live without a computer?

According to the same research, just published by Stanford University’s Hoover Institution, a typical American would want US$25,000 to live computer-free for a year.

For the GPS system that lets us map where we are on all our devices, the answer is US$3,000; for streaming services such as Netflix the answer is another US$3,000.

For refrigeration the answer is US$10,000; for air conditioning, another US$10,000; and for running water US$50,000.

The point of this study, by economist Tim Kane, is that if we add up the worth to us of everything the economy produces each year, we get much, much more than the gross domestic product – even though GDP is meant to be a summation of the prices paid each year.

Not a day goes by when we don’t get astounding value for money: on Kane’s estimate, about 20 times what we pay.

GDP monitors changes, not our lives

It’s a useful perspective to bear in mind ahead of the latest Australian gross domestic product figures, being released on Wednesday.

Those figures will show Australia spent less, earned less and produced less in the lockdown-affected September quarter months of July, August and September than in the three months before – about 3% less on private estimates.

It won’t be a “recession” because in Australia that’s generally taken to mean two consecutive quarters of those things going backwards. And we already know spending, earning and production all started climbing as soon as the lockdowns ended at the beginning of the quarter we are in now.

The GDP has the same relationship to life as a heart rate monitor has to health.

There’s more to GDP than you might think

Behind the headline figure you hear about are actually three different measures.

GDP(P) is a measure of everything that’s produced in the quarter. The Bureau of Statistics has the unenviable job of adding up most things that are produced at market prices (and having a stab at trying to infer market prices where they are not apparent) in industries as diverse as mining, financial services and education.

It tries to count each thing only once, which is difficult because some things are used as inputs to others. Its work is made harder by relying partly on surveys and partly on complete sets of data from organisations such as the Tax Office.

Ask whether it uses guess work, you will be told it uses “informed judgement”.

GDP(E) is a totalling of government and household expenditure to buy those products. After adjusting for imports and exports it ought to equal GDP(P), but imperfections in measurement mean it usually doesn’t.

Then there’s GDP(I), which is a measure of the income households and businesses get from working and selling those products. Again, it ought to equal the other two, but it usually doesn’t.

After trying to get the three measures nearer each other (perhaps there was something somebody missed) the technicians in the bureau simply average the three, producing GDP(A). That’s what goes up on the ABS website at 11:30am AEDT Wednesday, followed by a Treasurer’s press conference and loads of analysis.

It needn’t indicate an underlying condition

Just as a heart rate monitor needn’t tell us much about health, because even in healthy people hearts beat slower while sleeping and faster while awake, GDP needn’t tell us that much about the condition of our lives.

A lot of the economy went to sleep during this year’s and last year’s lockdowns and is now waking up. The GDP will show that, but at least on Wednesday it won’t tell us more than that.

As it happens, economic growth has been weakening over time. Annual GDP growth is no longer the 3-4% it typically was between the early 1990s recession and the 2008 financial crisis. In the decade leading up to COVID it has been much lower, rarely touching 3%.


Annual financial year GDP growth

Financial year on financial year growth, 2002-03 to 2018-19. ABS

Put starkly, for little-understood reasons unrelated to quarterly fluctuations or COVID, we are getting better off more slowly than we were.

There are always people who say this doesn’t matter, we should be happy with what we had (and as I noted, much of what we’ve had isn’t counted in the GDP).

There is an underlying condition nonetheless

But it matters a good deal, because ever since economic growth took off in the 1870s we’ve grown used to things continually getting better, and have come to expect it.

US economic historian Brad Delong uses an 1880s science fiction book to illustrate how much we’ve come to regard improving living standards as a birthright.

In Looking Backward, Edward Bellamy purports to look back from the year 2000.

At one point a hostess asks if he would like to hear some music. Instead of playing the piano, she merely touched one or two screws and “immediately the room was filled with the music of a grand organ”, one of four she could dial up by landline.

It appeared to him that

if we could have devised an arrangement for providing everybody with music in their homes, perfect in quality, unlimited in quantity, suited to every mood, and beginning and ceasing at will, we should have considered the limit of human felicity already attained, and ceased to strive for further improvements.

He got it wrong.

Peter Martin, Visiting Fellow, Crawford School of Public Policy, Australian National University

This article is republished from The Conversation under a Creative Commons license. Read the original article.
Read more >>

Wednesday, November 10, 2021

2022 looks like an ideal time for a government to land re-election

At the risk of being political – and politics is important, it will determine how we are governed for the next three years – economic conditions could scarcely be better for a government seeking re-election.

The economic things that matter most to most people are, in my view:

  • jobs – if employment is climbing rather than falling, most people are not at much risk of losing their job

  • economic growth and wages growth – if things are getting better rather than worse, even in small ways, people feel better about the future

  • the ability to buy a home – if it is getting hard, even for other people or for their children, they are concerned about what the future will become

  • mortgage rates – as long as rates stay low they know their own personal budget won’t go out of whack

Other things are said to matter, but I am less than convinced; among them are the state of the federal budget (whether it is “back in the black”), tax cuts (once granted they are forgotten – Julia Gillard gave back more than the carbon tax and wasn’t thanked for it) and esoteric concepts such as government debt.

Jobs aplenty

Earlier this year, just before the eastern states went into lockdown, more of Australia’s population was employed than ever before, more hours were worked than ever before and more jobs were on offer than ever before.

Total hours worked fell during the lockdown months. But in those states without long lockdowns (those other than NSW, Victoria and the ACT) hours worked kept climbing to still-higher all-time highs. It’s an indication of what’s likely in NSW and Victoria now their lockdowns are over, something the Reserve Bank says it can already see happening in NSW.

The proportion of those working who say they’re underemployed (working fewer hours than they want) dived to an eight-year low before the mid-year lockdowns.

I haven’t mentioned the unemployment rate (officially 4.6%) because at the moment the rate can’t be taken seriously.

It is that low mainly because to be counted as unemployed you need to be actively looking for work, and many workers stood down during the lockdowns and available to work were not searching, and also because of an oddity in the way the Bureau of Statistics counts non-resident workers.

Regardless, absent any lockdowns, in practical terms it is set to be easier to keep and find a job than it has been for a long time going into an election.

Wage growth climbing

Last year’s recession brought with it a collapse in wage growth as employers froze or cut wages, something that’s now being unwound as the economy picks up, albeit, as the Reserve Bank notes with apparent disapproval, “weighed down by more muted public sector wages growth”.

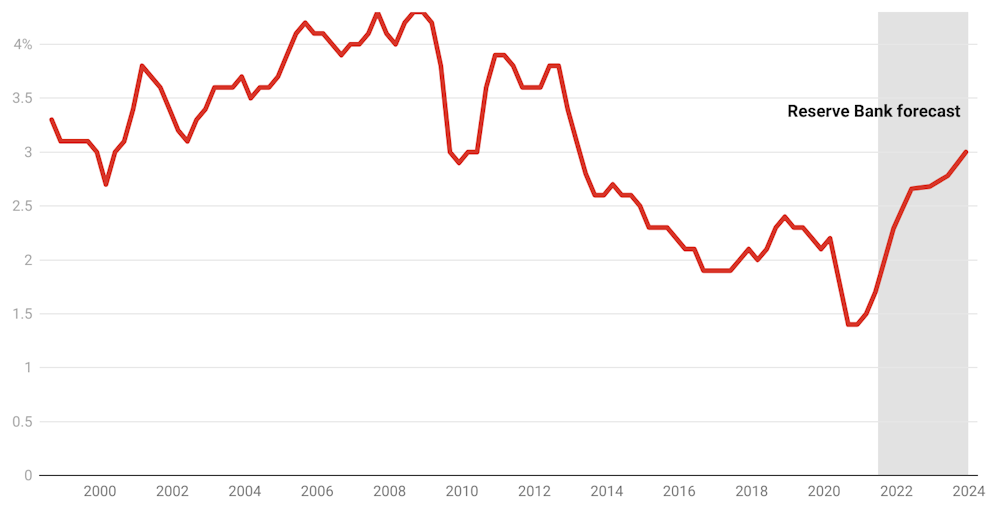
The bank’s latest forecasts, released on Friday, have wage growth climbing from 1.7% to almost 3% over the next two years, which will be the fastest growth in a decade.


Actual and forecast wages growth

Annual growth in ABS wage price index, excluding bonuses and commissions. RBA, ABS

Three per cent is still lower than the wage growth we had come to expect before it fell off a cliff with the end of the 2010s resources boom, and it’s still lower than the Reserve Bank needs to sustainably meet its inflation target.

But it holds out the prospect of an improvement at a time when private sector wages are already improving, which is what matters for the way people feel.

Forecasts have consequences

Economic growth – the catch-all measure for what’s happening in the economy – is set to climb out of the lockdown slump and accelerate throughout next year before settling back to the 2-3% that was common before the recession.

It also won’t be good enough, but it will be moving in the right direction, and accelerating strongly next May, at the time we are likely to be asked to vote.

These forecasts matter because similar ones (prepared by the Treasury instead of the Reserve Bank) will underpin the economic statement or budget released before the election and the Pre-election Economic and Fiscal Outlook released by departmental secretaries without political input during the campaign.

They will become the accepted narrative.

Easier home price growth

After soaring a frightening 21% in the past year to barely affordable highs, there’s every chance home prices will ease off. On Melbourne Cup Tuesday, the Reserve Bank withdrew its support for the near-zero three year bond rate that banks had been using to fund ultra-cheap fixed rate mortgages.

It’s no longer possible to get a three-year fixed rate mortgage for less than 2%.

A few weeks earlier the Australian Prudential Regulation Authority instructed lenders to refuse mortgages to borrowers who couldn’t withstand an increase in mortgage rates of three percentage points (such as an increase from 3% to 6%).

APRA expects the instruction to cut the maximum that can be borrowed by 5%. By election day price rises might have slowed or stopped.

And low rates for some time yet

Higher variable mortgage rates would unsettle Australians (even though many are finding it easier to make their payments than they have in years).

The good news is that on Friday the Reserve Bank nominated 2024 as the year it expects to begin to lift the record-low cash rate that sets the price of variable rate mortgages.

2024 is half a political cycle away.

Even if the first hike comes sooner (and financial markets expect it to come sooner) it won’t be imminent at the time we will be asked to vote.

All sorts of things determine election outcomes.

The economy is only one. But right now, next year’s economy is looking good.

Peter Martin, Visiting Fellow, Crawford School of Public Policy, Australian National University

This article is republished from The Conversation under a Creative Commons license. Read the original article.
Read more >>

Wednesday, September 01, 2021

Four GDP graphs that show how well Australia was doing – before Delta hit

Australia’s economy was performing exceptionally well in the lead-up to the Delta variant lockdowns, propped up by a barrage of government spending in the three months to June and impressive household spending.

The June quarter national accounts published on Wednesday show inflation-adjusted production, income and spending (gross domestic product) climbed 0.7% between March and the end of June, ahead of the NSW lockdown that began on June 26.

Were it not for a surge in imports and a weather-related decline in the volume of exports (each of which cuts measured GDP) gross domestic product would have climbed 1.7% in the June quarter.

Over the year to June economic activity grew a record 9.6%, as it climbed back from a record 7% slide in the three months to June in 2020.


Australian quarterly gross domestic product

Chain volume measures, seasonally adjusted. ABS

At a Parliament House press conference, Treasurer Josh Frydenberg was the first to concede the good news was historical — of “little comfort” to Australians under renewed lockdowns facing difficult days ahead.

The September quarter figures, to be released in three months’ time, were likely to show an economic collapse of at least 2% — the deepest dive since 1974, with the exception of last year’s COVID collapse.

But the starting point for the dive was better than any other developed country. Australia is the only developed country to have gone into this year’s Delta lockdowns with both GDP and employment higher than before COVID-19 struck early last year.


Read more: The four GDP graphs that show us roaring out of recession pre-lockdown


Propping up gross domestic product in the June quarter was a 7.4% surge in public infrastructure spending, driven by state and local governments, which by itself accounted for more than half of the growth in quarterly GDP.

A 1.3% increase in other government spending accounted for the other half.

But household spending accounted for almost as much, jumping 1.1% in the quarter as Australians took advantage of a relatively COVID-free autumn to boost spending on domestic tourism, on one measure by as much as 28%.


Household final consumption expenditure

Chain volume measures, seasonally adjusted. ABS

Australians were in a better position to spend than the published economic growth figures suggest.

A better measure of buying power is real net national disposable income per capita. This takes account of things such as high iron ore prices, which are excluded from the GDP. It shows buying power up 1.8% in the quarter to a new all-time high.


Real net national disposable income per capita

Chain volume measures, seasonally adjusted. ABS

Before the Delta lockdowns, households were continuing to wind back their record high savings rate, which peaked at 22% in June 2020. They saved 9.7% of their income in the June quarter of this year, compared to 11.9% in the March quarter.


Household saving ratio

Ratio of saving to net-of-tax income, seasonally adjusted. ABS

The lockdowns and the growing realisation they won’t have a clear end date, as they did last year, are likely to have already pushed the saving rate back up.

For months to come, today’s good economic news is set to be as good as it gets.The Conversation

Peter Martin, Visiting Fellow, Crawford School of Public Policy, Australian National University

This article is republished from The Conversation under a Creative Commons license. Read the original article.
Read more >>

Wednesday, June 02, 2021

The four GDP graphs that show us roaring out of recession, pre-lockdown

Back in the first three months of this year when we had JobKeeper, enhanced unemployment benefits and no lockdowns, Australia roared out of recession.

The GDP figures released on Wednesday tell us that in the months leading up to the end of JobKeeper and the coronavirus supplement at the end of March Australians spent, earned and produced an impressive 1.8% more than in three months to December, which was itself more 3.2% more than the three months to September, which was itself 3.5% more than the three months before that.

It’s growth of more than 8%, described by Treasurer Josh Frydenberg as the most over three quarters since 1968.

But it followed a collapse in gross domestic product of 7% – by far the worst since the Bureau of Statistics began compiling records in 1959.

The net result over the year to March growth of 1.1%, an extraordinary result which means that, at least until Victoria’s (just extended) lockdown, we were producing, earning and spending more than before the COVID recession.

On the graph it’s not much more, not the two or so per cent of normal growth the Reserve Bank had been expecting before the recession, but it means that almost alone among developed nations (along with South Korea and probably New Zealand whose figures aren’t yet out) we are better off after the COVID recession than before it.


Australian quarterly gross domestic product

Chain volume measures, seasonally adjusted. ABS

And we are better off than that bald GDP figures suggest.

In accordance with what is normally good statistical practice those figures are adjusted down for upward movements in prices.

We’ve had a monster upward movement in the price of iron ore over the past year which has enriched Australians through channels including company profits, tax revenue and a higher dollar that aren’t fully reflected in gross domestic product.

That’s why the bureau publishes a separate measure that measures buying power called real national disposable income per capita.

The graph shows it has climbed well above where it was to a new record high.

We ended the recession with 5.8% more buying power than before it began.


Real national disposable income per capita

Chain volume measures, seasonally adjusted. ABS

But we’ve been reluctant to fully use that buying power.

While consumer spending has bounced back to where it was before the recession, in terms of what it buys it is no higher.

In March 2021 we were buying no more than we were in March 2020 — more goods, less services, and more essential items, fewer discretionary items, but no more than we did a year earlier.

Zero growth in buying at a time of substantial growth in buying power can be seen as either disturbing, a sign of understandable caution, or a sign that the best is yet to come.


Household final consumption expenditure

Chain volume measures, seasonally adjusted. ABS

At his press conference Frydenberg painted the caution to date as something that would support economic growth in the months to come as we unwind our record-high household saving rate.

But the unwinding slowed in the three months to March.

In the December quarter the saving rate plunged from 18.6% of after tax income to 12.2%. Before that it had plunged from the record-high 22% to 18.6%.

But in the March quarter it barely fell, inching down from 12.2% to 11.6%, perhaps reflecting the imminent end of JobSeeker and the coronavirus supplement.


Household saving ratio

Ratio of saving to net-of-tax income, seasonally adjusted. ABS

The subsequent spread of coronavirus in Victoria, and the reluctance to date of the federal government to reinstate JobKeeper in Victoria will give Australians to keep saving rather than spending their money for some time to come.

Frydenberg told the national accounts press conference he was open to further assistance of another kind and would speak to Victoria’s Treasurer as soon as he could.


Read more: Frydenberg spends the bounty to drive unemployment to new lows


Business investment in buildings and equipment surged 5.3% in the March quarter (enough to account for nearly all of the economic growth over the past year) aided by investment incentives which were renewed in the May budget.

Australia’s rigorous approach to compiling the national accounts means the ones released Wednesday are out of date.

Although much will have improved since then, the spread of coronavirus and the lockdown in Victoria means much is suddenly worse.

Our future is about as uncertain as it has ever been.

Peter Martin, Visiting Fellow, Crawford School of Public Policy, Australian National University

This article is republished from The Conversation under a Creative Commons license. Read the original article.

Read more >>

Wednesday, March 03, 2021

GDP is V-shaped, but not yet good. These three graphs tell the story

There’s one graph that sums up both the good and not-yet-as-good detailed by Treasurer Josh Frydenberg at Wednesday’s national accounts press conference.

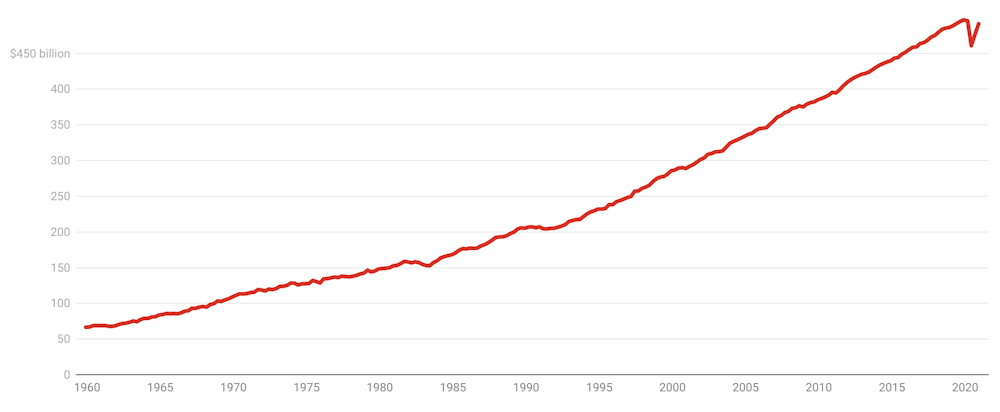
It’s a graph of the level of Australia’s gross domestic product – how much is produced and earned each three months in Australia – adjusted for inflation.


Australian quarterly gross domestic product

Chain volume measures, seasonally adjusted. ABS

It shows Australia’s economy getting bigger and bigger over almost all the past 80 years with only two readily-apparent slowdowns; one in the early 1980s recession, and one in the early 1990s recession.

Until COVID. Last year’s recession wasn’t a slowdown like the other two – it was a collapse, so big you could see it on any scale, even one that went back to when modern records began.

And it was V-shaped.

As soon as the economy collapsed – by 7% in the three months to June, the most since the Great Depression - it bounced back 3.4% in the three months that followed and (we now know) a further 3.1% in the three months that followed that.

It’s actually more like the beginning of a V

But, as I suggested last time (and as the graph shows) the gain of 3.1% and the gain of 3.4% don’t anything like offset the dive of 7% because a percentage increase in a small number does less than a percentage dive in a bigger number.

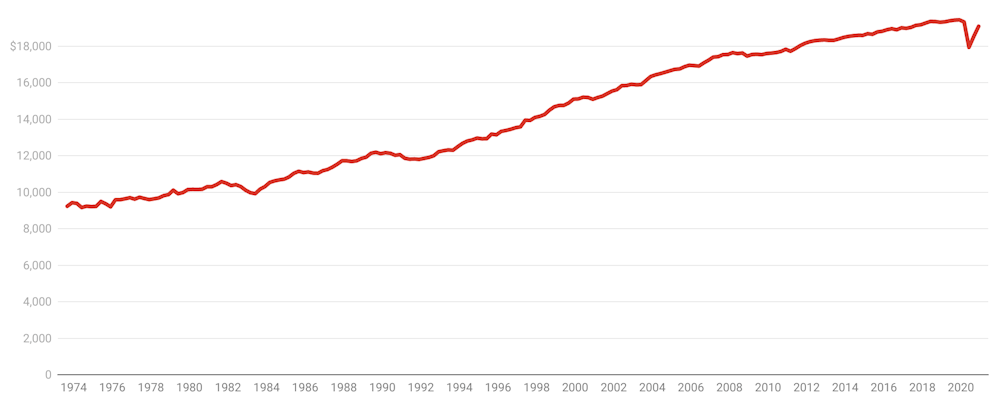
It’s reasonable to think that population-fuelled GDP is irrelevant to our lives, that what matters is GDP per head - the amount earned per person.

It shows much the same pattern: a V so clear you can see it on the widest possible scale, which is the one I have presented:


Per capita quarterly GDP

Chain volume measures, seasonally adjusted. ABS

The economy is 1.1% smaller than it was at the start of last year and 3.3% smaller than it would have been had economic growth continued, an extraordinarily good outcome given what Frydenberg described as the “economic abyss” forecast just five months ago in the October 2020 budget.

Government support has turned into private spending

Driving the recovery has been a continuing rebound in consumer spending. It dived 12.3% in the June quarter, climbed 7.9% in the September quarter and in the three months to December when Victorians became freer to spend, a further 4.3%.

We’ve funded it in part by cutting what had been an extraordinarily high household saving ratio.

Household saving has slid from a record high 20% of net-of-tax income in the June quarter to a more welcome 12% in the December quarter.


Household saving ratio

Ratio of saving to net-of-tax income, seasonally adjusted. ABS

Unable to spend much on travel, we are spending on the things we can. In the three months to December our spending on motor vehicles jumped a dizzying 31.8%, putting it up 22.2% over the year.

Our spending in hotels, cafes and restaurants rebounded 17.5% in the months to December, although with overseas and much interstate travel restricted, it was still down 29.8% over the year.

With the help of low interest rates and incentives, housing investment climbed 4.1% in the quarter (Homebuilder) and business investment in plant and equipment climbed 8.9% (instant asset write-off).

There are no guarantees

Farm production soared an astounding 26.8% in the quarter – the biggest jump since 2008 – on the back of the second-best winter crop on record.

If the economy continues to recover at this pace and the “V” turns into an upward tick we will make big inroads into unemployment and the coronavirus recession will look like a blip, an aberration.

But there are no guarantees. The JobKeeper employment subsidy ends on March 28 and the sharp upticks in business investment and farm production are unlikely to continue.


Read more: Josh Frydenberg has the opportunity to transform Australia, permanently lowering unemployment


Much will depend on the May budget, which comes out before the next update.

Among the budget decisions that will matter are how it will deal with the funding requirements of the aged care royal commission, whether and how it proceeds with the legislated increases in compulsory superannuation, and how quickly and to what extent it withdraws support from the economy.

There’s a case for keeping support high in order to extend the rebound in GDP and make big inroads into unemployment right up until the point we return to meaningful inflation. There’s a case for going for growth.

Peter Martin, Visiting Fellow, Crawford School of Public Policy, Australian National University

This article is republished from The Conversation under a Creative Commons license. Read the original article.
Read more >>

Wednesday, December 02, 2020

We're not really out of recession, as these graphs show

It’d be wrong to say that we are out of recession, although that’s how the graph of Wednesday’s GDP numbers makes it look.

Gross domestic product (the measure of everything produced and earned and spent) fell 7% between the March and June quarters after slipping 0.3% between the December and March quarters, and then rebounded 3.3% between the June and September quarters.

It was the biggest bounce since 1976, after the biggest fall on record.


Quarterly percentage change in gross domestic product

ABS National Accounts

But it hasn’t anything like got us back to where we were.

When the levels rather than the changes in GDP are graphed, it is clear that, as Treasurer Josh Frydenberg put it, we have “a lot of ground to make up”.


Quarterly real gross domestic product

ABS National Accounts

At first sight the graph of quarterly gross domestic product looks odd. Surely if GDP fell 7% and then rebounded by half that much it should have got back half its losses.

But 3.3% of a small number is much less than 7% of a bigger number. We’ve regained only two fifths of what we lost.


Read more: 6 things to watch for as Australia crawls out of recession


And we’ve lost more than that. Had the economy grown as the Reserve Bank forecast before the coronavirus crisis, we would have spent and earned A$509 billion in the September quarter instead of $476 billion.

It’s consumer spending that’s bounced

What drove the bounce was a rebound in consumer spending after months in which we were confined to quarters, and here the news is better than it seems.


Quarterly change in household final consumption expenditure

ABS Australian National Accounts

Nationwide, household spending jumped 7.9% after falling 12.5%, but excluding locked-down Victoria (which will have its own delayed bounceback) household spending in the rest of the country rebounded 11% after falling 12%.

And it bounced back in exactly the places it collapsed while we were locked down; in services such as tourism and hospitality.


Household spending by category

National, percentage change between June quarter and September quarter. Australian Treasury

Victoria’s economy literally went backwards.

Spending in Victoria continued to fall while spending everywhere else bounced back.

In only one category, home alcohol consumption, did spending in Victoria advance while spending in other places retreated.


State and territory final demand, September quarter

ABS Australian National Accounts

Consumers financed the extra spending by saving less, but even so, Australia’s household saving ratio remained alarmingly high.

In the June quarter Australian households saved a record (upwardly revised) 22.1% of what they earned. In the September quarter that fell to 18.9%, which is still far too high.

In good times, less-worried Australians save less than half that.


Household saving ratio

ABS Australian National Accounts

Frydenberg put the best spin he could on the extraordinarily high amount of saving by saying it would provide “ongoing support for the economic recovery in the new year as confidence continues to build”.

Australia was as well positioned to recover as “any nation on earth”. Over the past year its economy has contracted less than Britain, France, Germany and Japan.

Exports, business investment continue to fall

Much of that success is due to Australia’s achievement in getting on top of the virus and the success of JobKeeper in keeping Australians in work until conditions improved. The Reserve Bank believes it saved 700,000 jobs.

Working against that has been the forth consecutive quarterly fall in export income (something set to worsen unless relations with China improve) and the sixth consecutive fall in business investment.

In a quarter when consumer spending recovered, non-mining business investment fell a further 3% on top of a fall of 8.6% in the previous quarter.

The US National Bureau of Economic Research defines a recession as

a significant decline in economic activity spread across the economy, lasting more than a few months, normally visible in real GDP, real income, employment, industrial production and wholesale-retail sales

On that basis Australia is still in one. Employment, income and production remain well down on where they were a year ago. GDP is down 3.8% on where it was a year ago.

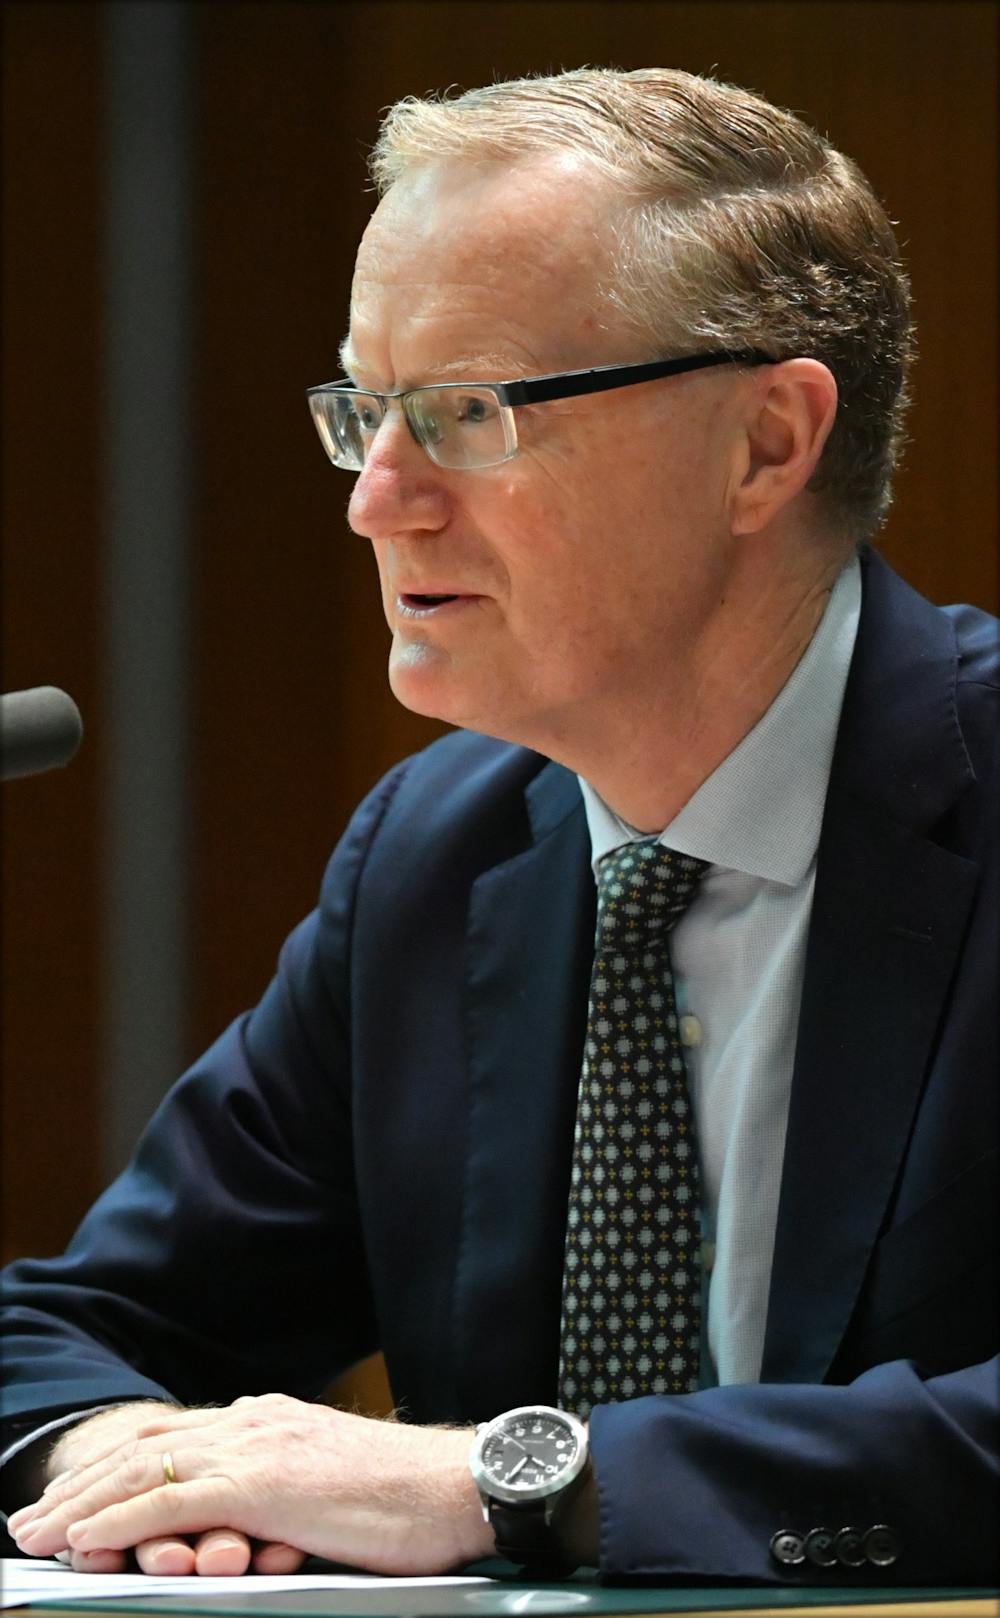
Speaking as the national accounts were being released, Reserve Bank Governor Philip Lowe said he expected Australia’s unemployment rate to remain above 6% for the next two years.

Annual wage growth would remain less than 2%

It was possible the economy could do better.

His forecasts assume no widespread vaccination against coronavirus until late next year. They also assume international travel restrictions until 2022.

But it was also possible things could be worse.

Just three months ago that many were hailing a robust bounce-back in Europe.

Now, Europe’s economy is expected to sink again in the December quarter as member states struggle to contain the virus.

Australia was on a different path, but there was “no guarantee we will remain so”.The Conversation

Peter Martin, Visiting Fellow, Crawford School of Public Policy, Australian National University

This article is republished from The Conversation under a Creative Commons license. Read the original article.

Read more >>