Wednesday, July 28, 2021

What’s in the CPI and what does it actually measure?

So you don’t believe the official inflation figures. Why would you? They show prices climbing at an annual rate of 1.1%

On Wednesday the update for June quarter is likely to show prices climbing at an annual rate three times as high — somewhere between 3% and 4%, which will probably be another reason you won’t believe them.

(As it happens, most of the “jump” will be because of a different starting point. The 1.1% figure reports what happened after the three months to March 2020. The update will report what’s happened since the three months to June 2020, when coronavirus restrictions triggered a plunge in petrol prices and a temporary childcare subsidy cut the price of most care to zero.)

Most of us don’t believe 1.1% or anything like it because it doesn’t accord with our experience. We see petrol prices climbing. We are presented with bills for electricity, gas and rates we find hard to pay.

But here’s the thing. As hard to believe as we find it, electricity, gas and petrol don’t cost us that much over the course of a year.

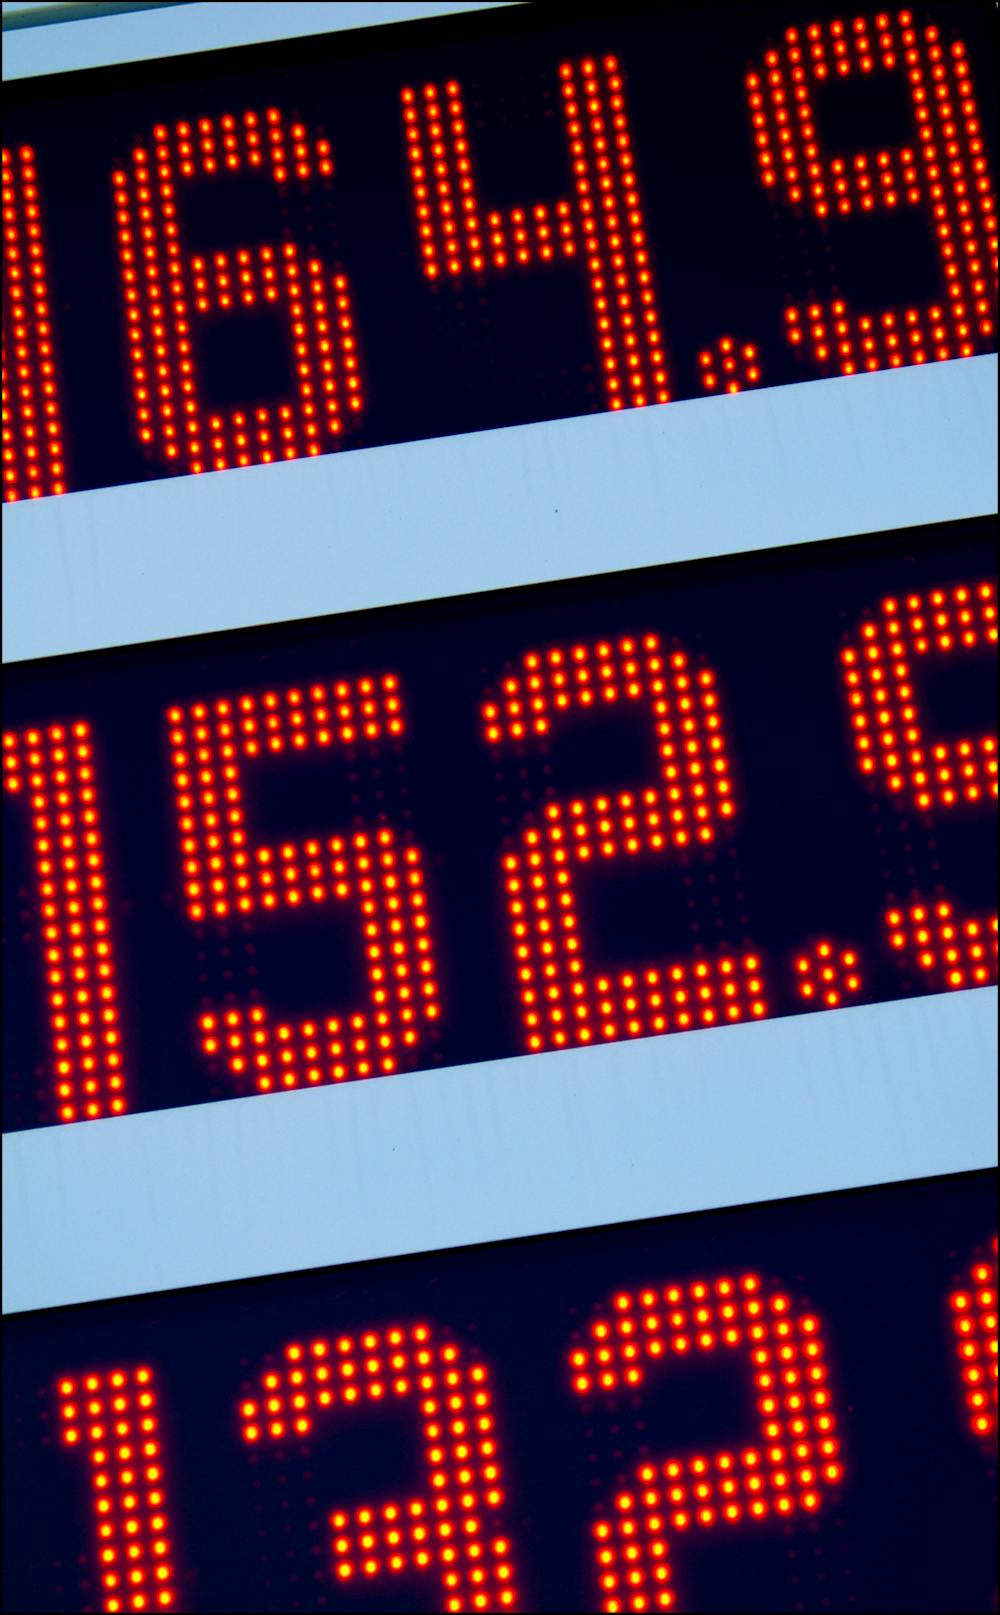
We notice petrol prices because they are displayed clearly on well-lit signs of a specified size, as is required by law. We notice electricity bills because they are large and usually arrive only four times each year.

And because we don’t like them. We pay less attention to spending we like.

Every few years the Bureau of Statistics surveys 10,000 households to determine what they spent over the course of a fortnight, and for less frequent expenses over the course of a year.

It uses what results to create a “basket” of representative goods and services, weighted according to actual expenditure.

Food accounts for the bulk of the basket — 17.3%. Alcohol accounts for another 5.3%. That’s right, 5.3%.

Compare the 5.3% of the basket we spend on alcohol to the 3.2% of it we spend on petrol, or the 3.8% on electricity and gas taken together.

Alcohol and food big ticket items

We spend almost as much on alcohol as on health, and more than on clothes.

If you reckon that’s not your household, fair enough. The basket represents the average household, as does the consumer price index (CPI) which measures the prices of the goods and services in the basket in the proportions they are in the basket.

And if your reckon you’d never admit to spending that much on alcohol, you’re also right. Alcohol and tobacco are two of the rare instances where the bureau nudges up what people report to take account of what’s actually sold.


Contrary to a widely-believed myth, the cost of housing is in the index, both in the form of rents and in the cost of building houses, rather than the cost of land (that’s regarded as an investment, as is the ownership of shares which are also not included in the index).

Most things included, though not illegal drugs

Some things aren’t the index but should be — superannuation management fees (the bureau is working on it) and recreational drugs and prostitution, which are excluded because it is “very difficult and indeed dangerous to obtain estimates of prices and expenditures, or to measure quality change”.

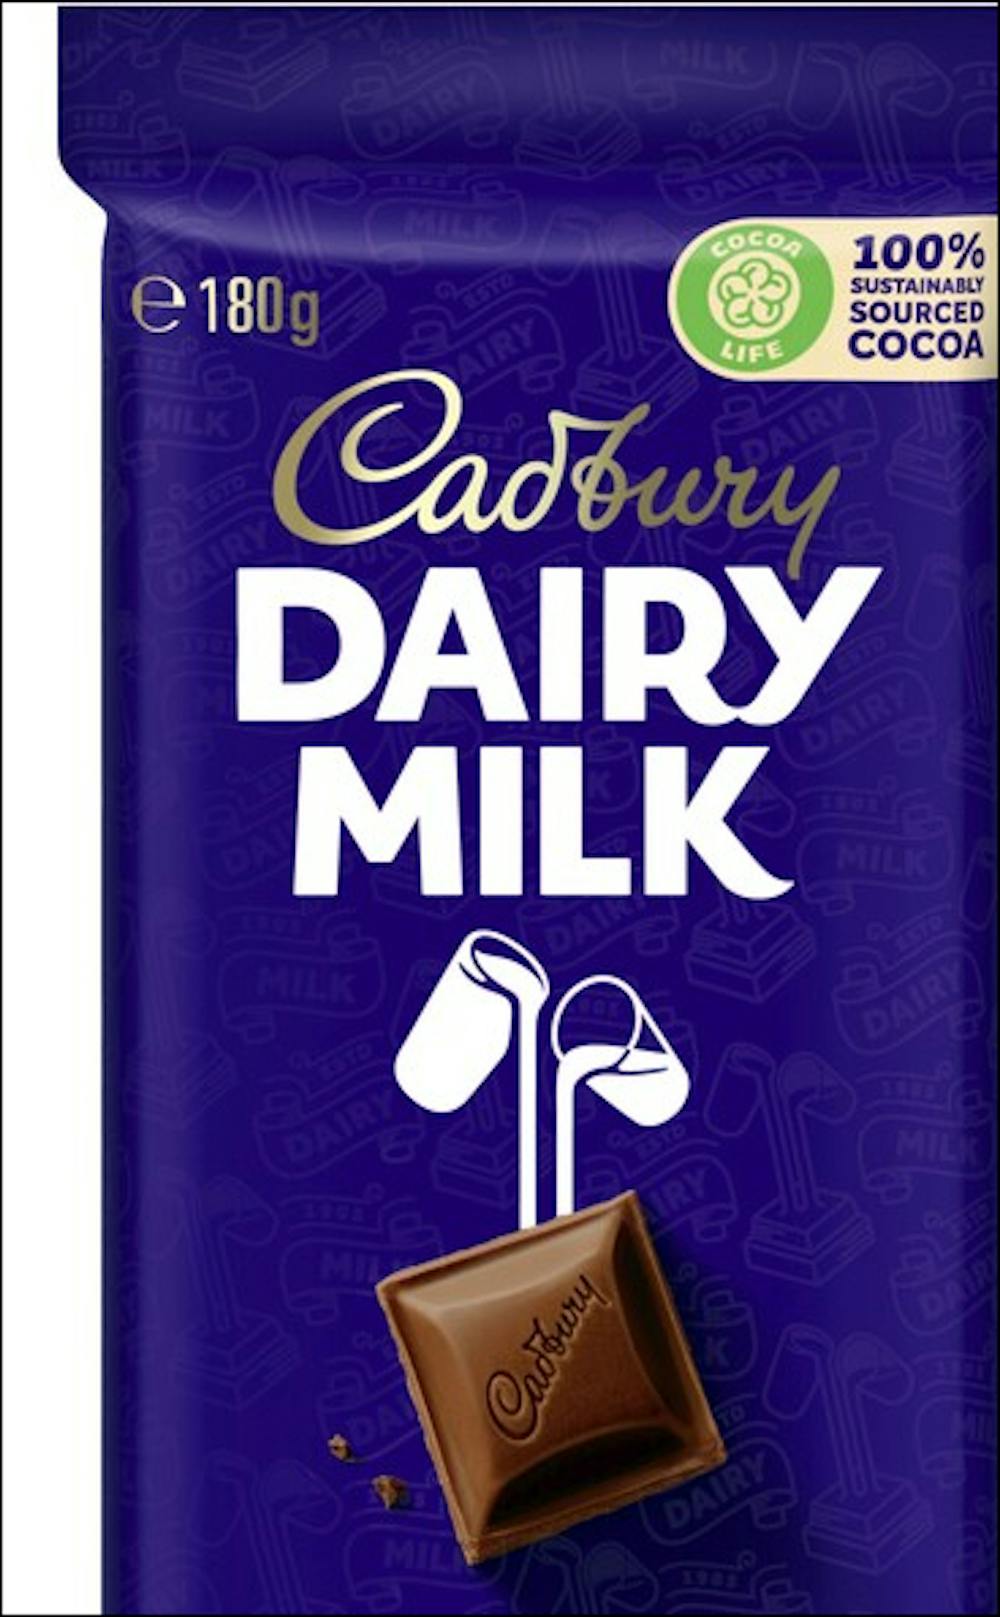
Quality matters. When Cadbury shrank its large blocks of chocolate from 250g to 200g a few years back and then to 180g, it wouldn’t have been right to merely record the price change.

The bureau adjusted up the recorded price to take account of the fact that people were getting less chocolate. But other changes are less straightforward. What do you do when VB reduces the strength of its beers (as it did) or the new model laptop has twice as much memory as the one it replaced?

For computers the bureau adjusts down the recorded prices of new models in line with a US formula.

For cars — which these days have features not previously dreamed of — it consults a panel of experts.

For other changes it lets improvements go through to the keeper, leaving recorded prices unadjusted even though the are getting better.

Beneath the hood, the CPI is changing

The bureau used to record prices using handheld devices in supermarkets and by ringing up suppliers and getting quotes. In the last few years it has moved to getting almost everything electronically — stores hand over data from checkout scanners, petrol stations report when prices have changed and upload sales data, and the bureau “scrapes” advertised prices from the web.

With those changes has come a revolution in what it is able to do. It used to collect prices in only a small number of representative outlets (which is why the index was limited to capital cities) and it used to record only the prices of “representative” items.

The stand-in for bread was the average price of a sliced white 650-750g loaf.

Better still, for the first time the bureau has information on how much is bought of each product at each price each quarter. This enables it make real-time adjustments to weightings in accordance with actual behaviour.

In 2011 when Cyclone Yasi destroyed banana crops in Queensland, the price of “fruit” recorded in the consumer price index surged to an unprecedented high. But the prices actually paid for fruit didn’t surge. Shoppers bought other fruits or canned fruit instead.

Next time that happens the CPI will scarcely move.

It’s making the index more of a cost of living index and less of a “cost of a fixed basket” index. It is happening for petrol too. The bureau is reporting the prices people actually pay, instead of the prices on offer.

None of this is to say that the CPI is perfect, but it would be wise to take the figure to be released on Wednesday seriously. It probably does a better job of recording changes in our cost of living than we’d do ourselves.

Peter Martin, Visiting Fellow, Crawford School of Public Policy, Australian National University

This article is republished from The Conversation under a Creative Commons license. Read the original article.

Read more >>

Wednesday, July 21, 2021

When COVID is behind us, we're going to have to pay more tax

The biggest unstated message from the intergenerational report released during the lull between lockdowns is that we will need more tax.

Not now. At the moment it’s a matter of throwing everything we’ve got at getting on top of the COVID outbreaks and worrying about how to (and the extent to which we will need to) pay for it later.

But when the economy is healthy again, taxes are going to have to rise, big time.

That the intergenerational report doesn’t say so explicitly might be because the government is sticking with its arbitrary and implausible guarantee that tax collections will never climb above 23.9% of GDP, which is the average between the introduction of the goods and services tax and the global financial crisis.

Or it might be because what’s needed sits oddly with legislated high-end tax cuts likely to cost $17 billion per year from 2024-25.

Among the drivers of increased government spending identified by the report is spending on health, at present 4.6% of gross domestic product, and on the report’s projections set to climb to 6.2% over the next 40 years.

We’ll want better health

To fund that alone the government will need to collect 6% more tax in 2061 than had spending on health stayed where it was as a proportion of GDP.

Perhaps surprisingly, most of the extra spending on health won’t be a direct result of the population ageing. It’ll be because health technologies are getting better and becoming much, much more expensive (à la the COVID vaccines). And because incomes are rising.

Rising incomes, the report explains, are the largest driver of government spending on health internationally.

That’s because for some things, including the provision of hospitals, private spending can’t cut it, no matter how well off you are.

After billionaire Kerry Packer suffered a massive heart attack while playing polo in 1990, he was rushed to Sydney’s Liverpool Hospital.

When the ANU election survey began in 1990, 54% of Australians surveyed regarded health as “extremely important” in determining their vote. It’s now 70%. In 1990 11% regarded health as “not very important”. It’s now just 2%.

The intergenerational report has spending on aged care climbing from 1.2% to 2.1% of GDP, which by itself means the tax take will have to be 4% higher than otherwise, but it was prepared ahead of the government’s final response to the aged care royal commission.

The interim response had 14 (mostly expensive) recommendations subject to “further consideration”.

The National Disability Insurance Scheme already accounts for one in 20 tax dollars collected and is set to overtake Medicare.

The report says the government’s response to the royal commission into disability care presently underway is likely to place “additional pressure” on costs.

We’ll need to spend more than projected

None of this extra spending is bad if it delivers value for money, and it’s what the public wants. But it is hard to reconcile with official projections in the report showing government spending climbing only 2.5% per year in real terms over the next 40 years, compared to 3.4% per year in the past 40.


Read more: Intergenerational report to show Australia older, smaller, in debt


The report gets there in part by an outrageous sleight of hand. It says JobSeeker and other payments will become tiny as a proportion of GDP because they will only climb with inflation (which is typically low) rather than wage growth or GDP growth (which is typically higher, and lines up with how the pension grows).

A moment’s reflection would show that if that actually happened for 40 years — which is what the treasury’s report assumes — JobSeeker would fall from 70% of the single age pension to a hard-to-justify 40%.


JobSeeker and age pension as projected in intergenerational report

Payment for a single, dollars per fortnight. JobSeeker indexed to IGR inflation projections, pension indexed to IGR wage projections.

We know it won’t happen because it hasn’t happened.

JobSeeker was boosted this year after only 20 years rather than 40 in order to make sure that sort of thing wouldn’t happen.

And we know there’s nothing to stop an intergenerational report using more realistic assumptions.

The 2015 report, released at a time when the Abbott government planned to adjust the pension in line with the more miserly JobSeeker formula, relaxed the assumption after 13 years because if it left it in place the pension would slide untenably below community expectations.

We’ll easily be able to afford more tax

There’s nothing wrong with paying more tax if it’s for things we want, like better health care, better aged care, better disability care and benefits we can live on.

The intergenerational report has government spending climbing by four percentage points of GDP between now and 2061. But it also has real GDP per person almost doubling, climbing 80%.

Even if that’s an overestimate and GDP per person grows by, say, 50%, and the need for tax grows by more than four points, we’ll easily be able to afford the extra tax, and we’ll want what that tax will buy. Expectations climb with income.

The present government will be long gone by the time the tax to GDP ratio reaches its “cap” of 23.9% of GDP (which the report expects in 2035).

The finance minister who came up with the cap, Mathias Cormann, is now head of the Organisation for Economic Co-operation and Development, in which the average tax take is 34% of GDP.

An obvious place to look for the tax is high-income senior citizens, at present enjoying tax-free super, refundable franking credits and special tax offsets.

Grattan Institute calculations suggest an older household earning $100,000 pays less than half the tax of a working-age household on the same amount.

Like the households of less well-off seniors, those households are highly likely to use the services tax provides.

To say we’ll need more tax is not to say the government needs to fund all of its spending with tax.

It is projecting budget deficits for the next 40 years. Budgets have been in deficit for all but a few of the past 100 years.

But it will need to cover much of it with tax to keep the economy in check. If we want what tax provides, we’ll be prepared to pay it.

Peter Martin, Visiting Fellow, Crawford School of Public Policy, Australian National University

This article is republished from The Conversation under a Creative Commons license. Read the original article.

Read more >>

Saturday, July 03, 2021

The intergenerational horizon that recedes each time we approach it

On Monday, Treasurer Josh Frydenberg homed in on the real problem identified by his government’s intergenerational report – about the only real problem expounded on in the report.

It’s that by 2061 we will have far fewer people of working age for each person of traditional retirement age. Right now, Frydenberg explained, we have four people of working age for each Australian aged over 65.

Forty years ago we had 6.6. But in 40 years’ time, we will have just 2.7.

That’s a good deal fewer people to cut our hair, fix our computers, look after our needs in nursing homes.

It belongs to that unusual class of problems that money can’t fix, despite Frydenberg saying the financial implications are “sobering”.

Collecting more tax to spend on retirees or having them squirrel away more superannuation to spend in retirement isn’t going to create more people of working age.

This demographic issue exists because the large number of Australians born in the postwar baby boom are in or approaching retirement, and aren’t dying any time soon.

Four will become 2.7 whatever we do, unless we have more babies or attract more migrants and temporary workers. The only other factor would be if this generation died sooner.

The man who set up Australia’s system of five-yearly intergenerational reports and delivered the first two, the Coalition’s then treasurer Peter Costello, was fond of saying that while demographic change is slow, “demography is destiny”.

Every five years since he left office, his successors, Wayne Swan, Joe Hockey and Josh Frydenberg, have reissued the same sort of projections and graphs, and every five years they’ve sounded surprised.

Joe Hockey said Australians would “fall off their chairs” when they discovered their government wouldn’t “get anywhere near being able to reduce spending over the medium-term to the same level that exists today”, which was hardly the point.

If Australians had been paying attention, what might have surprised them more was how much less worrying the projections had become over time.

In 2007 Peter Costello said the number of working-age Australians for each Australian over 65 would shrink from five to 2.4 in 40 years’ time.

Wayne Swan’s projection, in 2010, was for the number to shrink to a less scary 2.7, and not until five years later than Costello’s warning. Hockey’s projection was less scary still – to 2.7, but a further five years out again.

Frydenberg’s projection this week was still 2.7, but a further five years out, to 2061. The demographic event horizon has receded each time we’ve approached it.

Doing the work of holding back the transition has been massive and unexpected immigration. Costello’s first intergenerational report in 2002 assumed net overseas migration of 90,000 people a year for 40 years. By 2010, net overseas migration had more than doubled to 244,000 people a year, and the intergenerational report assumed 180,000 a year for 40 years.

The 2015 report assumed 215,000 a year, and Frydenberg’s assumes 235,000 a year after borders reopen.

Migrants are young, as are temporary workers and foreign students. Eight in 10 are aged under 35 when they arrive. Although they themselves age, most bolster the working-age population for decades. Many work in nursing homes.

Ask John Piggott, director of the Centre of Excellence in Population Ageing Research at UNSW Sydney, whether this means migration is a something of a Ponzi scheme, with a continual flow of new migrants needed each year to stop the age structure collapsing, and he’ll tell you it’s the same for births. Each newly born Australian also ages, but from the time they enter the workforce they bolster the working-age population for decades to come.

And the divide between workers under 65 and retirees over 65 is losing its meaning, in part because the Rudd Labor government lifted the pension age to 67 and the Abbott government tried to lift it to 70, an idea that will doubtless be revisited.

At the time of the first intergenerational report in 2002 only 10 per cent of men and 3.5 per cent of women aged 65 and older were in paid work or making themselves available for paid work. Twenty years on, it’s close to 20 per cent and 11 per cent, proportions that grew through the coronavirus crisis.

If we really do become short of workers of traditional working age, we are likely to become more accepting of workers in their 70s. The increases in not just lifespans, but healthy lifespans, and a shift to service-sector and part-time jobs, will mean more people in their 70s will take work.

The financial problems spelled out in Frydenberg’s report are both less severe and more severe than Frydenberg acknowledged.

It says by 2060-61 healthcare will become the largest component of government spending, eclipsing social security and taking up 26 per cent of the budget. Government spending on health per person will more than double.

Yet what it also says is that most of the increase will be non-demographic – the government will spend more on healthcare for Australians of all ages, because treatments are becoming more expensive (and presumably better) and because we want them.

The report points to a budget problem. By 2061 government spending will exceed government revenue by 2.5 per cent of gross domestic product (GDP), and by 5 per cent on a less optimistic set of assumptions, but that’s only because of a self-imposed decision not to let the tax take climb.

For completely political reasons, the Coalition imposed an arbitrary cap on the tax-to-GDP ratio of 23.9 per cent of GDP a few elections back, a cap that will be reached in about 15 years.

“Some might suggest an easy way to paint a more optimistic picture of the budget position would be to remove the tax-to-GDP cap,” Frydenberg said on Monday. “But as we know, you can’t tax your way to prosperity.”

Prosperity, in the sense of being able to afford to pay increased tax, shouldn’t be much of a problem. The report says by 2061 real GDP per person is expected to be almost twice as high as it is now. We shouldn’t find it too difficult to shell out an extra few per cent of GDP in tax.

But other costs aren’t acknowledged. The report includes a chapter headed “environment” that refers to the costs of climate change and its impacts on agriculture and the resources sector, but includes not one financial measure of that impact.

The NSW intergenerational report, released just three weeks earlier, said more frequent and severe natural disasters could cost the state an extra $17 billion a year.

In the 2016 election. Labor was castigated for its failure to cost its climate change policy. Frydenberg has failed to cost the Coalition’s in 2021.

And there’s another big thing the report fails to acknowledge. Yes, the number of Australians of working age for each Australian of traditional working age will drop from four to 2.7 and yes, this will be a problem, but old people aren’t the only dependents.

Children are also dependents, and as the proportion of the population who are older dependents has been growing, the proportion who are younger dependents has been shrinking.

The total dependency ratio – the number of Australians of working age per Australian either over 65 or under 15 – was acknowledged in earlier intergenerational reports. It is unacknowledged in this one, but is expected to slip from 1.8 to 1.6 – a drop, but a less alarming drop than the aged-dependency ratio.

It’s also less alarming because we’ve been there before. During the 1960s, a time generally regarded as pretty pleasant, Australia had 1.6 people of traditional working age for each Australian either over 65 or under 16. There were a lot of children about in the 1960s but we managed to care for them.

A key difference, identified by tax and transfer specialist Miranda Stewart at the University of Melbourne, is that children are more likely to be cared for off-budget, especially off the Commonwealth’s budget, and so don’t force their way into the intergenerational report.

Much of their care is provided privately, either by the private payment of childcare fees and school fees or by parents, mainly mothers, doing it unpaid.

As with the resource costs identified in Frydenberg’s report, these resource costs are real. The point is, we’ve coped with them before.

This article was first published in the print edition of The Saturday Paper on Jul 3, 2021 as "Demography is destiny".

Read more >>

Thursday, July 01, 2021

Economy will be weak and in need of support after pandemic, say top economists in 2021-22 survey

Australia’s economy will limp along after recovering from the pandemic, failing to regain the growth it had either in the years leading up to the crisis or the much higher growth in the decades before.

That’s the consensus of the 23 leading Australian economists assembled to take part in The Conversation’s July 1 forecasting survey — a panel that includes former Treasury, Reserve Bank and International Monetary Fund officials and modellers and policy specialists from 13 Australian universities.

On balance, the panel expects year-average economic growth (the measure reported in the budget) to slide from 4% this financial year to just 2.2% by 2024-25, well below the average of 2.6% assumed in this week’s intergenerational report.

The panel forecasts much weaker business investment than does the budget and lower household spending, but higher wage growth and lower unemployment. It expects a flat share market, and slower growth in house prices.

Weaker economic growth

During the decade leading up to the COVID-19 crisis, economic growth averaged 2.6% per year. During the 27 years between the early 1990s recession and the crisis, it averaged 3.2%.

The panel’s average forecast of 2.2% by the end of the four-year budget forecasting horizon is lower than both the budget forecast of 2.5% and the 2.6% in the intergenerational report.


Economic modeller Janine Dixon expects growth of just 1.7%. She says after Australia has soaked up unemployment, its future economic growth can only be driven by population growth or improved productivity.

With population growth expected to be weak for several years, GDP growth will be weak unless dwindling productivity growth rebounds.


Read more: Intergenerational report to show Australia older, smaller and more in debt


Forecasting veteran Saul Eslake says on the other hand, for as long as borders remain closed Australia should enjoy an “artificial boost” to domestic spending of more than A$50 billion per year from Australians who can’t spend abroad.

The two most optimistic forecasts of 3% growth, from Angela Jackson and Sarah Hunter, are contingent on borders reopening and tourism and immigration restarting.


The panel expect extraordinarily strong growth in the United States of 5.2% throughout 2021 on the back of what panelist Warren Hogan calls massive government stimulus and a full-vaccination rate approaching 50%.

China’s growth is forecast to rebound to 7.9%, but will come under pressure from what panelist Mark Crosby describes as an attempt by some of China’s customers to diversify the sources of supply away from China.


Support from iron ore

The panel expects actual living standards to be higher than the bald economic growth figures suggest.

This is because high iron ore prices boost Australians’ buying power (by boosting the Australian dollar) and boost company profits in a way that isn’t fully reflected in gross domestic product.

In recent months, the spot iron ore price has been at a record US$200 a tonne, a high the budget assumes will collapse to near US$63 by April next year as supply held up in Brazil comes back online.


Read more: The four GDP graphs that show us roaring out of recession pre-lockdown


The panel is expecting the iron ore price to stay high for longer than the Treasury — for at least 18 months, ending this year near a still-high US$158 a tonne.

There’s agreement that at some point the unusually high price will fall, with one panelist saying there might be “one more year to ride this wave, then who knows”.


Because the panel expects a higher iron ore price than the government in the year ahead, it expects a greater rise in nominal gross domestic product — the measure of cash pouring into wallets. The panel forecasts an increase of 5% this financial year compared to the budget forecast of 3.5%.

But it expects consumer caution to limit growth in household spending to 4.2%, much less than the budget forecast of 5.5%.


Unemployment to fall quickly

The panel expects unemployment to fall more quickly than the government does, to 4.7% by mid-2022, a low the budget didn’t foresee until mid-2023.

The unemployment rate is already 5.1%, something the May budget didn’t expect for a year. However, it is to some extent artificially assisted because jobs that used to go to temporary foreign workers and were not counted in the employment statistics are now being taken by domestic workers who are counted.

As foreign workers return to Australia, the process will unwind, putting upward pressure on the recorded unemployment rate.


Wage growth better than budget

The May budget forecast wage growth of just 1.5% in 2021-22 (less than forecast price growth), followed by only 2.25% in 2022-23 (merely matching price growth), in part because of legislated increases in employers’ super contributions.

The forecasting panel is more optimistic for the year ahead, being able to take account of the Fair Work Commission’s 2.5% increase in award wages announced in June.


Read more: Australia's top economists oppose the next increases in compulsory super


Warren Hogan calls 2.5% the new “baseline”, with some labour shortages forcing some employers to offer more.

Even so, the panel’s average wage growth forecast for 2021-22 is 2.2%, only marginally above expected price inflation of 2.1%.


Slower home price growth

The panel expects weaker home price growth in the year ahead, with the CoreLogic Sydney price index climbing 6.4% after a year in which it soared 11.2%.

Melbourne prices should climb a further 5.2% after a year in which they gained 5%.

The panelists say much will depend on how long mortgage rates remain at their record lows, what action authorities take to restrain lending and when immigration restarts.


Low rates for some time

Over the past year, the bond rate at which the Commonwealth government can borrow for ten years has jumped from 0.9% to 1.5% in accordance with moves overseas.

The panel expects further increases to a still-low 1.8% by the end of this year and to 2.2% by the end of next year.

Even so, the panel expects no increase in the Reserve Bank’s cash rate — the one that drives variable mortgage rates — for almost two years, until April 2023.


Former Reserve Bank head of research Peter Tulip, now with the Centre of Independent Studies, says the bank meant it when it said it said it wouldn’t lift the record-low cash rate of 0.1% until actual inflation was “sustainably within” its 2-3% target range, something that wasn’t likely until 2024.

Other panelists, including economic modeller Warwick McKibbin, believe those criteria might be met sooner, some as soon as mid-2022.


The Conversation, CC BY-ND

No take-off in investment

The panel doesn’t buy the government’s bold prediction of a jump in non-mining business investment in response to budget tax measures.

The budget predicts year-on-year growth of 12.5% in 2022-23 after 1.5% in 2021-22.

Instead, the panel predicts 3.7% in 2021-22 and 5.8% in 2022-23, citing low population growth and the likelihood that most investment that could have been brought forward by tax measures has already been brought forward.


Read more: Bounce-back in investment holds open possibility of good news


Former IMF official Tony Makin also points to the relatively high tax rates facing foreign investors and the increasingly restrictive approach of the Foreign Investment Review Board.

Other panelists cite lack of clarity about the rules governing investment in renewable energy and growing shortages of labour and materials as reasons to expect only restrained growth in business investment.


Markets steady

On balance, the panel expects the US-Australia exchange rate to stay where it is at around 76 US cents as it has for years, noting that much will depend on the iron ore price and the strength of the US economy.

On average, it expects no change in the Australian share market after 12 months in which the ASX200 has soared 24%.

The average hides sharp differences. Some panelists expect the ASX200 to climb a further 10%, while others expect it to fall 10%. One panelist, economic modeller Stephen Anthony, expects a collapse of 55%, saying it “smells like a blood bath is coming”.


Deficits forevermore

This year’s budget forecast is for a deficit of 5% of GDP after last year’s near-record 7.8% of GDP.

Asked at what point over the next four decades the budget deficit would shrink to 1% of GDP, three panelists replied “never”.

Six others said not before 2030. Only four nominated the decade ahead.


Read more: Intergenerational report to show Australia older, smaller and more in debt


Angela Jackson said any improvements in the budget position delivered by a better-than-expected iron ore price would be spent.

Saul Eslake saw no appetite for either the tax increases or spending cuts that would be needed to eliminate the deficit, adding that, fortunately, there was no “urgent requirement to do so”.


Unexpected times

Forecasts often don’t come to pass. This time last year, mid-pandemic in a rapidly evolving situation, the panel forecast unemployment of 8.8%, no share market growth and ultra-low wage growth of just 0.9%.

That these things didn’t happen was in part due to the role of such forecasts in persuading the government to respond in an unprecedented fashion, a point made by Treasurer Josh Frydenberg launching the intergenerational report on Monday.


Read more: No big bounce: 2020-21 economic survey points to a weak recovery getting weaker, amid declining living standards


This year’s forecasts, prepared in a less-hectic environment, might have more staying power. They point to a weak recovery and an economy reliant on government support for some time to come.


Participants

PDF OF RESULTS

Peter Martin, Visiting Fellow, Crawford School of Public Policy, Australian National University

This article is republished from The Conversation under a Creative Commons license. Read the original article.

Read more >>