Showing posts with label intergenerational report. Show all posts

Monday, August 21, 2023

With one exception, the Intergenerational Report is far less scary than you’ve heard

What if nearly everything that’s been written about this month’s Intergenerational Report is wrong?

I’ll explain. But first, here’s a sample of the headlines: “Young Australians at risk of a poorer future”, “Fewer workers to shoulder soaring income tax”, “Ageing population driving $140 billion blowout in spending”, and so on.

On radio it was worse. One ABC presenter referred to a “ticking tax bomb”.

The picture painted is one of a future in which (old) dependants have far fewer people of working age to care for them, in which tax climbs dramatically to pay for the care of the elderly, and in which the next generation is poorer than this one is.

And to be fair to the people who’ve said these things, some of the language in the Intergenerational Report is like that, but not the numbers.

Each report less scary than the one before

Let’s start with the most fundamental problem identified in the report: that in 40 years’ time (each Intergenerational Report looks forward 40 years) there will be many fewer Australians of traditional working age for each Australian aged 65 and over – what the report calls the “old-age dependency ratio”.

Back in 2002 the government’s first intergenerational report found that whereas there were 5.3 Australians of working age for each Australian aged 65 and over at the time, by 2042 there would be only half as many – just 2.5.

This latest report finds that whereas there are now 3.7 Australians of such age for each of us aged 65 and over, by 2063 there will be 2.6. While not quite as dramatic as the fall projected in first report, and happening two decades later, this is still a big stepdown.

Except that ratio is not a useful guide to the ratio of people of working age to the people they’ll need to support. That’s because young people need support too.

Australia will be older, but also less young

Whereas old people need aged care workers, young people need child care workers; and they both need workers to make the goods and services they use. What matters is the total dependency ratio: old and young combined.

Examining only half the ratio (the half that look worse as the population ages) without also examining the other half (the half that looks better as the population ages) is hard to justify – unless the argument is that the Commonwealth is responsible for aged care and the states for schools.

But that ought not be relevant when talking about the supply of workers.

Australia will need more aged care workers as a proportion of the population in 40 years’ time, but it is also going to need fewer teachers.

What will matter is the ratio of potential workers to all people aged (say) under 15 as well as aged 65 and older, both old and young.

That total dependency ratio also told a dramatic story in the first report. The number of Australians of traditional working age to those aged either under 15 or 65 and older was set to slide from 2 to 1.55.

But the slide isn’t big as this time. The ratio is set to slip from 1.82 (which we are finding manageable) to 1.57, but over 40 years.

Old people will find it easier to find jobs

One of the reasons why the “fewer workers to dependents” story has much less sting than it was going to is we have had many more migrants than we were going to, and the migrants and students we have let in are nearly all aged 15 to 64.

Another, and this would have happened regardless of migration, is that as people of traditional working age become more scarce, people of non-traditional age (65 and over) are taking up and staying in paid work. Back at the time of the first report, only 5% of Australians aged 65 and older were employed. Now it’s 11.5%.

Partly this is because of a rule change (the pension age is now 67), partly it is because work is less physically demanding (an awful lot of us have office jobs) and partly it is because employers are no longer as prejudiced – they’ve had to accept applications from older workers and have discovered they are not too bad.

On present projections we will be much, much richer

As for the idea that young Australians face a poorer future, that’s unlikely to be the case if we do indeed run short of workers (and have to pay them more) and it certainly isn’t what’s projected in the Intergenerational Report.

The report has living standards, as measured by real GDP per person, an extraordinary 57% higher in 2042, even with lower-than-previously-assumed productivity growth.

That’s right, although things won’t be the same for everyone, on average the report has future generations better off materially than present generations, just as they are better off materially than generations 40 years earlier.

It ought to be noted that the first intergenerational report in 2002 predicted an even bigger growth in living standards, and this one says climate change could trim its projections, although the numbers in the report are woolly and the Treasury is still building up the capacity to properly model climate change.

But 57% – or even 50% or 40% – is still an enormous increase in living standards.

On the numbers in the report, intergenerational inequity will be the opposite of what’s usually claimed: the next generation will be so much better off financially it will be easily able to stump up a few more dollars in tax.

We will easily be able to stump up extra tax

And the extra tax the next generation is asked to stump up won’t be “soaring”, despite what the headlines say.

The projections in the report suggest we might have to pay an extra 3.9% of GDP in tax to fund the things we will need, but not all at once, and not the full amount until 2063. By that time (as mentioned) GDP per person will be much higher.

Most of the extra projected government spending (60%) is unrelated to ageing. A lot of it is to fund the cost of new and better health treatments, of the kind we’re pretty certain to want given our higher living standards.

I’ve read the 300-odd pages of the report pretty carefully, and (with the exception of the section on climate change) I’m yet to find anything particularly alarming.The Conversation

This article is republished from The Conversation under a Creative Commons license. Read the original article.

Read more >>

Wednesday, July 21, 2021

When COVID is behind us, we're going to have to pay more tax

The biggest unstated message from the intergenerational report released during the lull between lockdowns is that we will need more tax.

Not now. At the moment it’s a matter of throwing everything we’ve got at getting on top of the COVID outbreaks and worrying about how to (and the extent to which we will need to) pay for it later.

But when the economy is healthy again, taxes are going to have to rise, big time.

That the intergenerational report doesn’t say so explicitly might be because the government is sticking with its arbitrary and implausible guarantee that tax collections will never climb above 23.9% of GDP, which is the average between the introduction of the goods and services tax and the global financial crisis.

Or it might be because what’s needed sits oddly with legislated high-end tax cuts likely to cost $17 billion per year from 2024-25.

Among the drivers of increased government spending identified by the report is spending on health, at present 4.6% of gross domestic product, and on the report’s projections set to climb to 6.2% over the next 40 years.

We’ll want better health

To fund that alone the government will need to collect 6% more tax in 2061 than had spending on health stayed where it was as a proportion of GDP.

Perhaps surprisingly, most of the extra spending on health won’t be a direct result of the population ageing. It’ll be because health technologies are getting better and becoming much, much more expensive (à la the COVID vaccines). And because incomes are rising.

Rising incomes, the report explains, are the largest driver of government spending on health internationally.

That’s because for some things, including the provision of hospitals, private spending can’t cut it, no matter how well off you are.

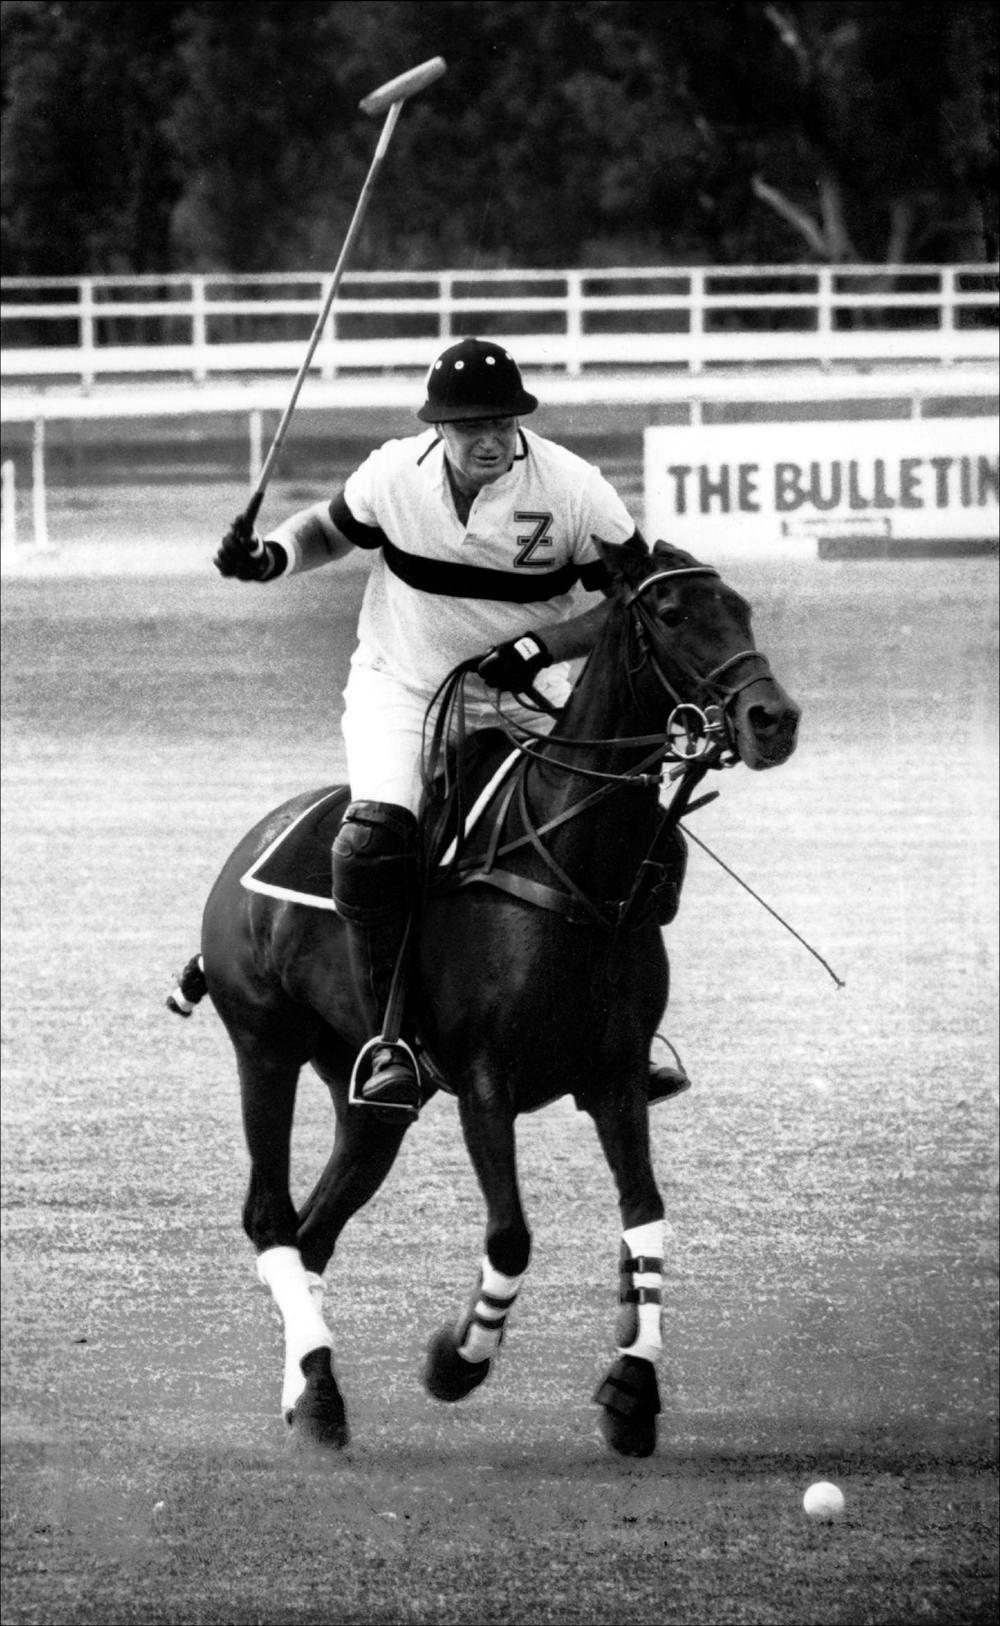
After billionaire Kerry Packer suffered a massive heart attack while playing polo in 1990, he was rushed to Sydney’s Liverpool Hospital.

When the ANU election survey began in 1990, 54% of Australians surveyed regarded health as “extremely important” in determining their vote. It’s now 70%. In 1990 11% regarded health as “not very important”. It’s now just 2%.

The intergenerational report has spending on aged care climbing from 1.2% to 2.1% of GDP, which by itself means the tax take will have to be 4% higher than otherwise, but it was prepared ahead of the government’s final response to the aged care royal commission.

The interim response had 14 (mostly expensive) recommendations subject to “further consideration”.

The National Disability Insurance Scheme already accounts for one in 20 tax dollars collected and is set to overtake Medicare.

The report says the government’s response to the royal commission into disability care presently underway is likely to place “additional pressure” on costs.

We’ll need to spend more than projected

None of this extra spending is bad if it delivers value for money, and it’s what the public wants. But it is hard to reconcile with official projections in the report showing government spending climbing only 2.5% per year in real terms over the next 40 years, compared to 3.4% per year in the past 40.


Read more: Intergenerational report to show Australia older, smaller, in debt


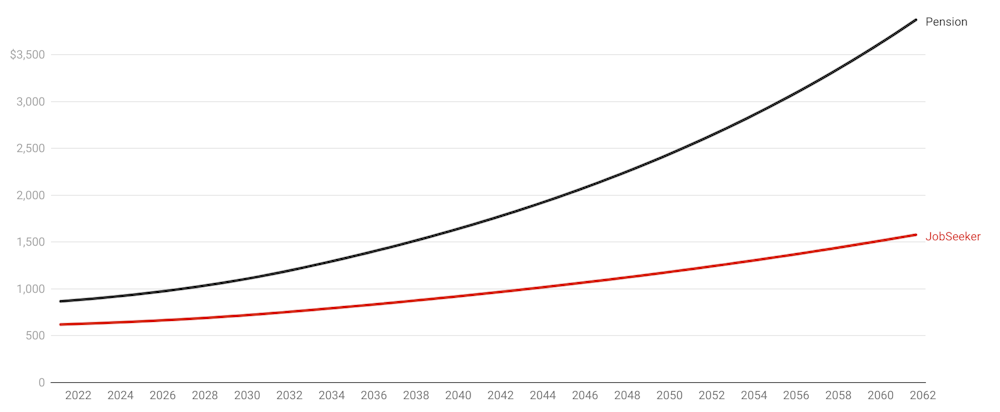
The report gets there in part by an outrageous sleight of hand. It says JobSeeker and other payments will become tiny as a proportion of GDP because they will only climb with inflation (which is typically low) rather than wage growth or GDP growth (which is typically higher, and lines up with how the pension grows).

A moment’s reflection would show that if that actually happened for 40 years — which is what the treasury’s report assumes — JobSeeker would fall from 70% of the single age pension to a hard-to-justify 40%.


JobSeeker and age pension as projected in intergenerational report

Payment for a single, dollars per fortnight. JobSeeker indexed to IGR inflation projections, pension indexed to IGR wage projections.

We know it won’t happen because it hasn’t happened.

JobSeeker was boosted this year after only 20 years rather than 40 in order to make sure that sort of thing wouldn’t happen.

And we know there’s nothing to stop an intergenerational report using more realistic assumptions.

The 2015 report, released at a time when the Abbott government planned to adjust the pension in line with the more miserly JobSeeker formula, relaxed the assumption after 13 years because if it left it in place the pension would slide untenably below community expectations.

We’ll easily be able to afford more tax

There’s nothing wrong with paying more tax if it’s for things we want, like better health care, better aged care, better disability care and benefits we can live on.

The intergenerational report has government spending climbing by four percentage points of GDP between now and 2061. But it also has real GDP per person almost doubling, climbing 80%.

Even if that’s an overestimate and GDP per person grows by, say, 50%, and the need for tax grows by more than four points, we’ll easily be able to afford the extra tax, and we’ll want what that tax will buy. Expectations climb with income.

The present government will be long gone by the time the tax to GDP ratio reaches its “cap” of 23.9% of GDP (which the report expects in 2035).

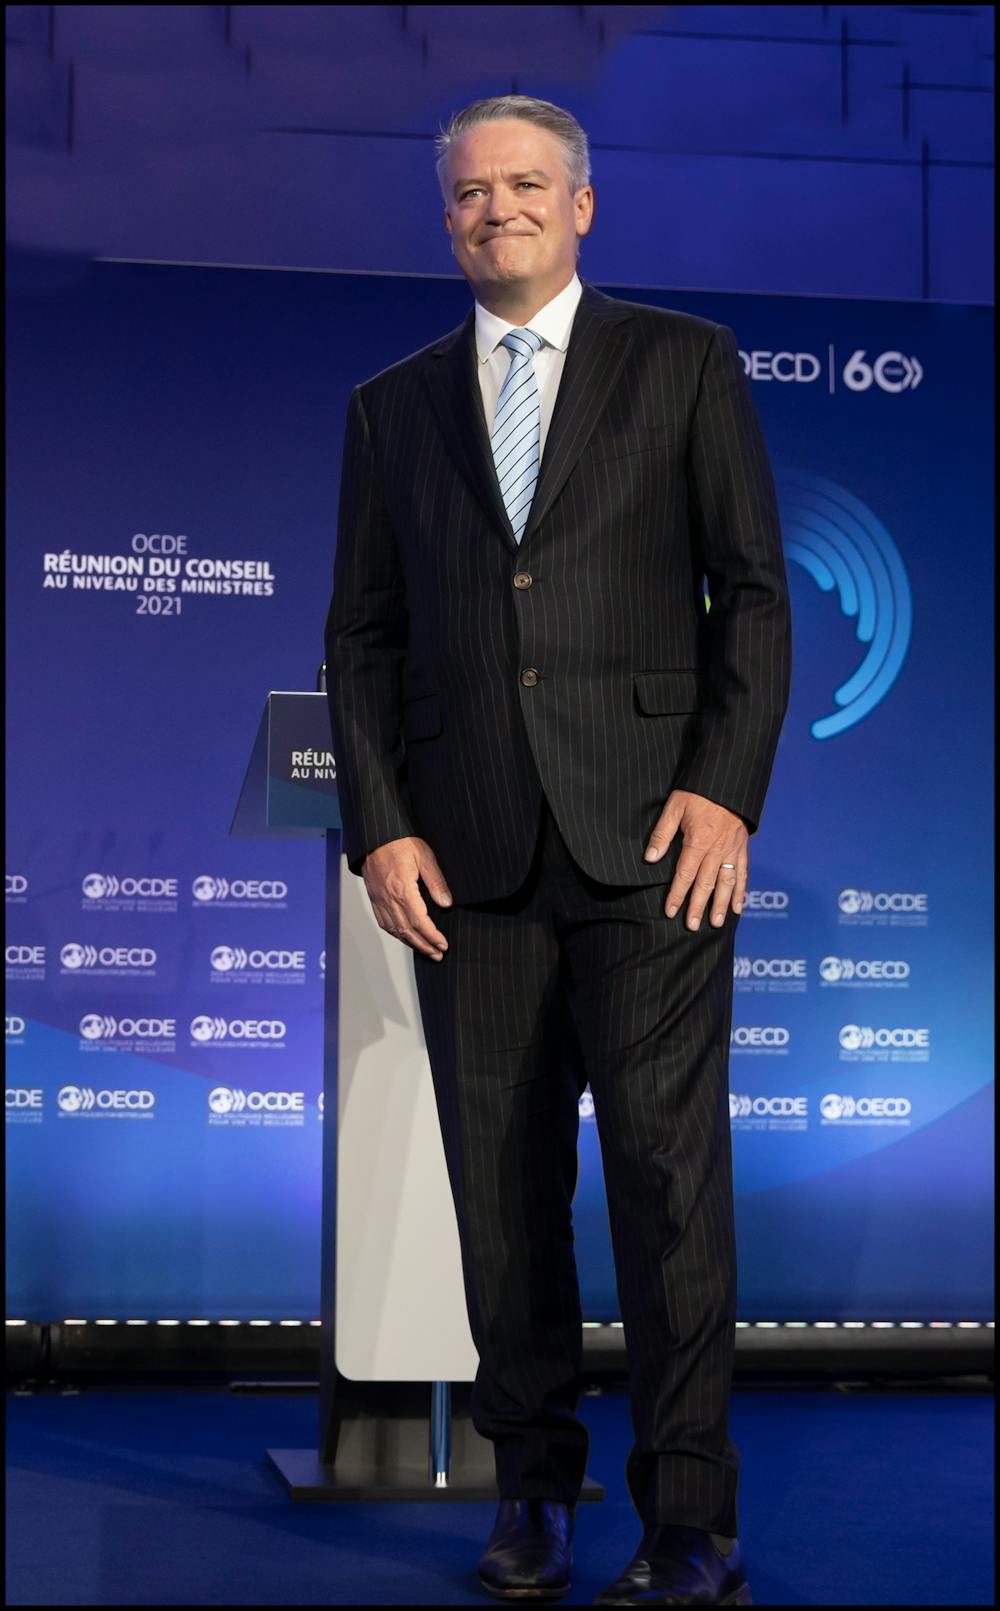
The finance minister who came up with the cap, Mathias Cormann, is now head of the Organisation for Economic Co-operation and Development, in which the average tax take is 34% of GDP.

An obvious place to look for the tax is high-income senior citizens, at present enjoying tax-free super, refundable franking credits and special tax offsets.

Grattan Institute calculations suggest an older household earning $100,000 pays less than half the tax of a working-age household on the same amount.

Like the households of less well-off seniors, those households are highly likely to use the services tax provides.

To say we’ll need more tax is not to say the government needs to fund all of its spending with tax.

It is projecting budget deficits for the next 40 years. Budgets have been in deficit for all but a few of the past 100 years.

But it will need to cover much of it with tax to keep the economy in check. If we want what tax provides, we’ll be prepared to pay it.

Peter Martin, Visiting Fellow, Crawford School of Public Policy, Australian National University

This article is republished from The Conversation under a Creative Commons license. Read the original article.
Read more >>