Showing posts with label cpi. Show all posts

Tuesday, January 23, 2024

Why Australian workers’ true cost of living has climbed far faster than we’ve been told

Why is Prime Minister Anthony Albanese suddenly so keen to deliver extra cost-of-living relief – keen enough to summon Labor members of parliament to Canberra for a briefing on Wednesday, followed by a National Press Club address on Thursday?

One immediate reason is he is keen to make sure Labor wins the upcoming byelection in the outer-Melbourne electorate of Dunkley on March 2.

But the cost of living wouldn’t matter much for Dunkley – and it wouldn’t matter much for the rest of us – unless it was really biting.

And despite what the treasurer himself has been trying to tell us, it is biting.

Treasurer Jim Chalmers has been pointing out that in the June quarter and the September quarter (the three months to June and to September) real wages grew for the first time in years. By that he means that the wages index compiled by the Bureau of Statistics began growing faster than the consumer price index.

It’s better than growing more slowly, but it tells us next to nothing about what’s happening to buying power. Here’s why.

Why CPI understates today’s living costs

Way back in the late 1990s, more than a quarter of a century ago, the consumer price index (CPI) used to actually reflect the cost of living. It included all of the big costs incurred by households, including – importantly – mortgage interest payments. At the time, mortgages accounted for an average of $5 of every $100 each wage earner spent.

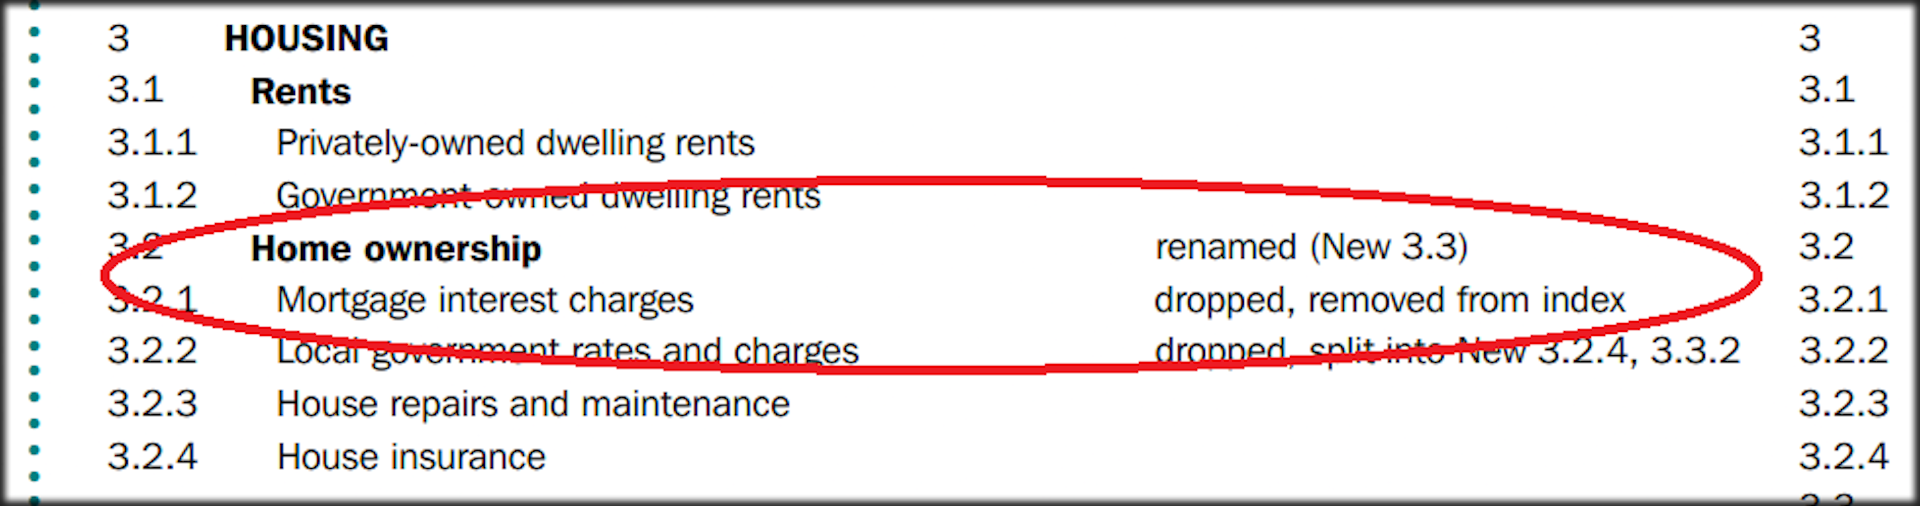
Then in September 1998, in response to representations from the Reserve Bank and the Treasury, the bureau changed the way it calculated the index. It excluded mortgage and other interest payments, in a decision it acknowledged would make the index worse at measuring living costs.

It still carries the warning on its website, saying the consumer price index is

not the conceptually ideal measure for assessing the changes in the purchasing power of the disposable incomes of households.

The index actually does a pretty good job of measuring changes in living costs at times when mortgage rates aren’t much changing. But at times when they are tumbling, it’ll overestimate living costs. And when mortgage rates are soaring – as they have been lately – it will way understate what’s happening to living costs.

We know by how much. For years, the bureau has also published a separate set of measures it pointedly calls “living cost indexes”. These do include mortgage and other interest charges, and for households headed by employees (for whom the buying power of wages matters) they are substantial.

Living costs are up 9%, rather than 5.4%

While the consumer price index (the one quoted by the treasurer) increased 5.4% in the year to September, the living cost index for households headed by wage earners climbed 9%.

For these working households, the price of food climbed 4.8% in the year to September, the price of electricity 14.5% and the price of mortgage interest charges 68%.

It’s the increases in mortgage rates that have made the increases in the other prices hurt so much.

The overall increase in prices faced by wage-earners – 9% – is way above the typical wage increase of 4%.

Bill Mitchell of the University of Newcastle points out that on this measure, the correct one, the buying power of wages has been falling for two and a half years. He says it puts the treasurer’s comments in a wholly different light.

Why we should distrust the CPI

Working Australians are right to distrust the consumer price index, which is something the Australian Council of Social Service warned the bureau about when it made the change.

Each month, the Melbourne Institute asks Australians whether their family finances have deteriorated over the previous year. Usually, about one-third of those surveyed say they have.

But for more than a year now, around 50% of those surveyed have been saying their finances have got worse. That’s a peak not seen since the global financial crisis, and one that has lasted longer.


Asked about family finances over the next 12 months, more than 30% say they’ll worsen further. It’s usually 20%.


Looked at from today’s perspective, the arguments put forward in 1997 for weakening the consumer price index as a measure of living costs are unimpressive.

Back then, the Treasury noted that many welfare recipients didn’t have mortgages and that a consumer price index that excluded them would better reflect their living costs.

The Reserve Bank argued interest rates were “conceptually different from other prices”. In any event, it wanted them excluded because it found it hard to use higher interest rates to bring down inflation if those higher rates pushed the measure of inflation up.

The change attracted little attention at the time, because mortgage rates weren’t moving much. By the time they did, the change had been bedded down.

But here’s some good news

For most of the time since the change, mortgage rates have either increased gradually or been cut, meaning the difference between what the consumer price index has been telling us and what’s been happening to us hasn’t been too stark. It’s been stark lately because interest rates have been rising quickly.

The good news – and there is good news – is that financial markets expect rates to begin falling this year, with the next move down.

Inflation as measured by the consumer price index (inflation excluding mortgage rates) is already falling.


We get the next official update on the consumer price index next week (and the update for the lesser-known living cost indexes a week after that).

It makes now a particularly good time to announce measures to address the cost-of-living crisis. We need them because we really are in something of a crisis. Things are a lot worse than the official index suggests.

And there’s a chance that soon they’ll begin to get better, allowing the prime minister to claim a win.The Conversation

This article is republished from The Conversation under a Creative Commons license. Read the original article.

Read more >>

Wednesday, July 28, 2021

What’s in the CPI and what does it actually measure?

So you don’t believe the official inflation figures. Why would you? They show prices climbing at an annual rate of 1.1%

On Wednesday the update for June quarter is likely to show prices climbing at an annual rate three times as high — somewhere between 3% and 4%, which will probably be another reason you won’t believe them.

(As it happens, most of the “jump” will be because of a different starting point. The 1.1% figure reports what happened after the three months to March 2020. The update will report what’s happened since the three months to June 2020, when coronavirus restrictions triggered a plunge in petrol prices and a temporary childcare subsidy cut the price of most care to zero.)

Most of us don’t believe 1.1% or anything like it because it doesn’t accord with our experience. We see petrol prices climbing. We are presented with bills for electricity, gas and rates we find hard to pay.

But here’s the thing. As hard to believe as we find it, electricity, gas and petrol don’t cost us that much over the course of a year.

We notice petrol prices because they are displayed clearly on well-lit signs of a specified size, as is required by law. We notice electricity bills because they are large and usually arrive only four times each year.

And because we don’t like them. We pay less attention to spending we like.

Every few years the Bureau of Statistics surveys 10,000 households to determine what they spent over the course of a fortnight, and for less frequent expenses over the course of a year.

It uses what results to create a “basket” of representative goods and services, weighted according to actual expenditure.

Food accounts for the bulk of the basket — 17.3%. Alcohol accounts for another 5.3%. That’s right, 5.3%.

Compare the 5.3% of the basket we spend on alcohol to the 3.2% of it we spend on petrol, or the 3.8% on electricity and gas taken together.

Alcohol and food big ticket items

We spend almost as much on alcohol as on health, and more than on clothes.

If you reckon that’s not your household, fair enough. The basket represents the average household, as does the consumer price index (CPI) which measures the prices of the goods and services in the basket in the proportions they are in the basket.

And if your reckon you’d never admit to spending that much on alcohol, you’re also right. Alcohol and tobacco are two of the rare instances where the bureau nudges up what people report to take account of what’s actually sold.


Contrary to a widely-believed myth, the cost of housing is in the index, both in the form of rents and in the cost of building houses, rather than the cost of land (that’s regarded as an investment, as is the ownership of shares which are also not included in the index).

Most things included, though not illegal drugs

Some things aren’t the index but should be — superannuation management fees (the bureau is working on it) and recreational drugs and prostitution, which are excluded because it is “very difficult and indeed dangerous to obtain estimates of prices and expenditures, or to measure quality change”.

Quality matters. When Cadbury shrank its large blocks of chocolate from 250g to 200g a few years back and then to 180g, it wouldn’t have been right to merely record the price change.

The bureau adjusted up the recorded price to take account of the fact that people were getting less chocolate. But other changes are less straightforward. What do you do when VB reduces the strength of its beers (as it did) or the new model laptop has twice as much memory as the one it replaced?

For computers the bureau adjusts down the recorded prices of new models in line with a US formula.

For cars — which these days have features not previously dreamed of — it consults a panel of experts.

For other changes it lets improvements go through to the keeper, leaving recorded prices unadjusted even though the are getting better.

Beneath the hood, the CPI is changing

The bureau used to record prices using handheld devices in supermarkets and by ringing up suppliers and getting quotes. In the last few years it has moved to getting almost everything electronically — stores hand over data from checkout scanners, petrol stations report when prices have changed and upload sales data, and the bureau “scrapes” advertised prices from the web.

With those changes has come a revolution in what it is able to do. It used to collect prices in only a small number of representative outlets (which is why the index was limited to capital cities) and it used to record only the prices of “representative” items.

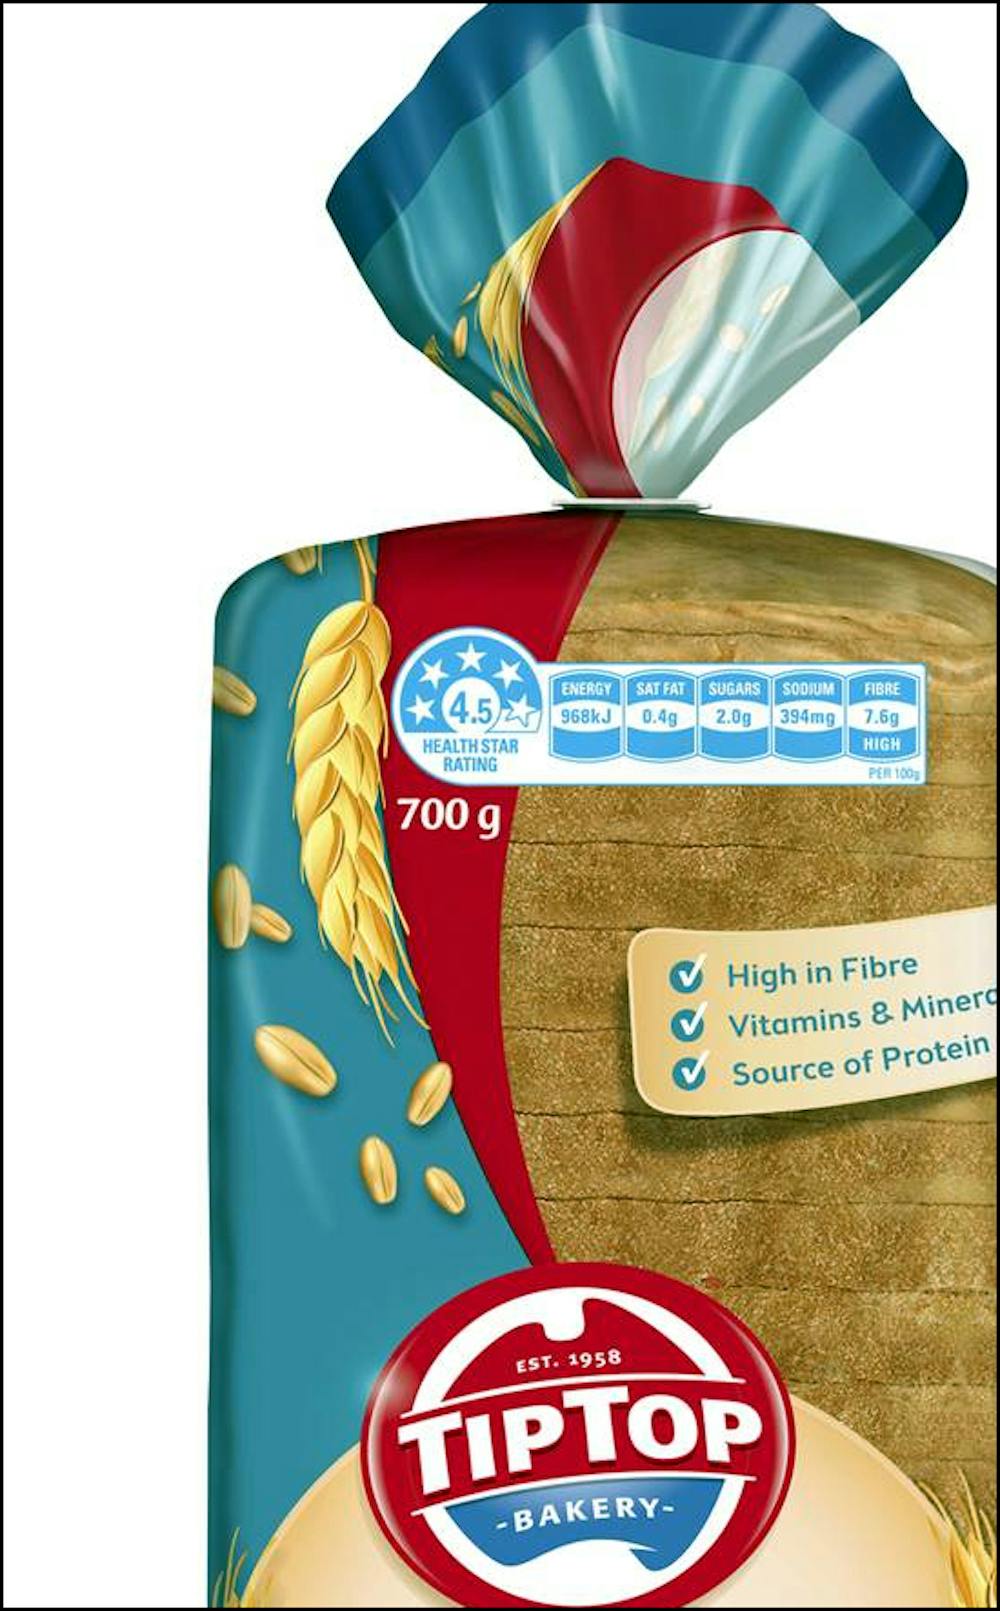
The stand-in for bread was the average price of a sliced white 650-750g loaf.

Better still, for the first time the bureau has information on how much is bought of each product at each price each quarter. This enables it make real-time adjustments to weightings in accordance with actual behaviour.

In 2011 when Cyclone Yasi destroyed banana crops in Queensland, the price of “fruit” recorded in the consumer price index surged to an unprecedented high. But the prices actually paid for fruit didn’t surge. Shoppers bought other fruits or canned fruit instead.

Next time that happens the CPI will scarcely move.

It’s making the index more of a cost of living index and less of a “cost of a fixed basket” index. It is happening for petrol too. The bureau is reporting the prices people actually pay, instead of the prices on offer.

None of this is to say that the CPI is perfect, but it would be wise to take the figure to be released on Wednesday seriously. It probably does a better job of recording changes in our cost of living than we’d do ourselves.

Peter Martin, Visiting Fellow, Crawford School of Public Policy, Australian National University

This article is republished from The Conversation under a Creative Commons license. Read the original article.

Read more >>