Showing posts with label hilda. Show all posts

Tuesday, July 30, 2019

There's a reason you're feeling no better off than 10 years ago. Here's what HILDA says about well-being

During the election campaign then-opposition leader Bill Shorten repeatedly claimed that everything was going up.

“Childcare is up 28%, out of pockets to see the doctor up 20%, specialists … up nearly 40%,” he said. And then the punchline: “everything is going up, except your wages.”

Statistically, it wasn’t true. The official rate of inflation was just 1.3%. The official rate of wage growth was 2.3%.

I haven’t asked him, but I wouldn’t be surprised if he kept saying it because his focus groups told him that’s what people felt.
Today’s release of the 17th wave of Australia’s Household, Income and Labour Dynamics Survey (HILDA) tells us that despite the official statistics, people were right to feel they were going backwards.

Funded by the Australian government and managed by the Melbourne Institute of Applied Economic and Social Research, HILDA is one of the most valuable tools Australian social researchers have.

It examined the lives of 14,000 Australians in 2001 and then kept coming back to them each year to discover what had changed. By surveying their children as well, and in future surveying their children, it will be able to build up a long-term picture of how circumstances change over the course of lives and generations.

It can be thought of as Australia’s Seven Up!, the British TV series that keeps going back for updates on the lives of 14 children it first examined when they were seven. Except that HILDA’s results have statistical significance, and the questions are detailed, asking among other things about depression and anxiety, work-life stress, stress in relationships, and illicit drug use.

We are right to feel no better off…

The Australian Bureau of Statistics does indeed find that wages are climbing faster than prices, as they almost always have, but because it doesn’t examine what happens to a particular household over time it can tell us little about whether an individual’s experience of things is getting better or getting worse.

HILDA gets a handle on each household’s disposable income by asking each member of the household about their gross income from wages, benefits, investments and other sources and then deducting its estimate of taxes. It gets a handle on the real (inflation-adjusted) changes by adjusting its totals for changes in the consumer price index.

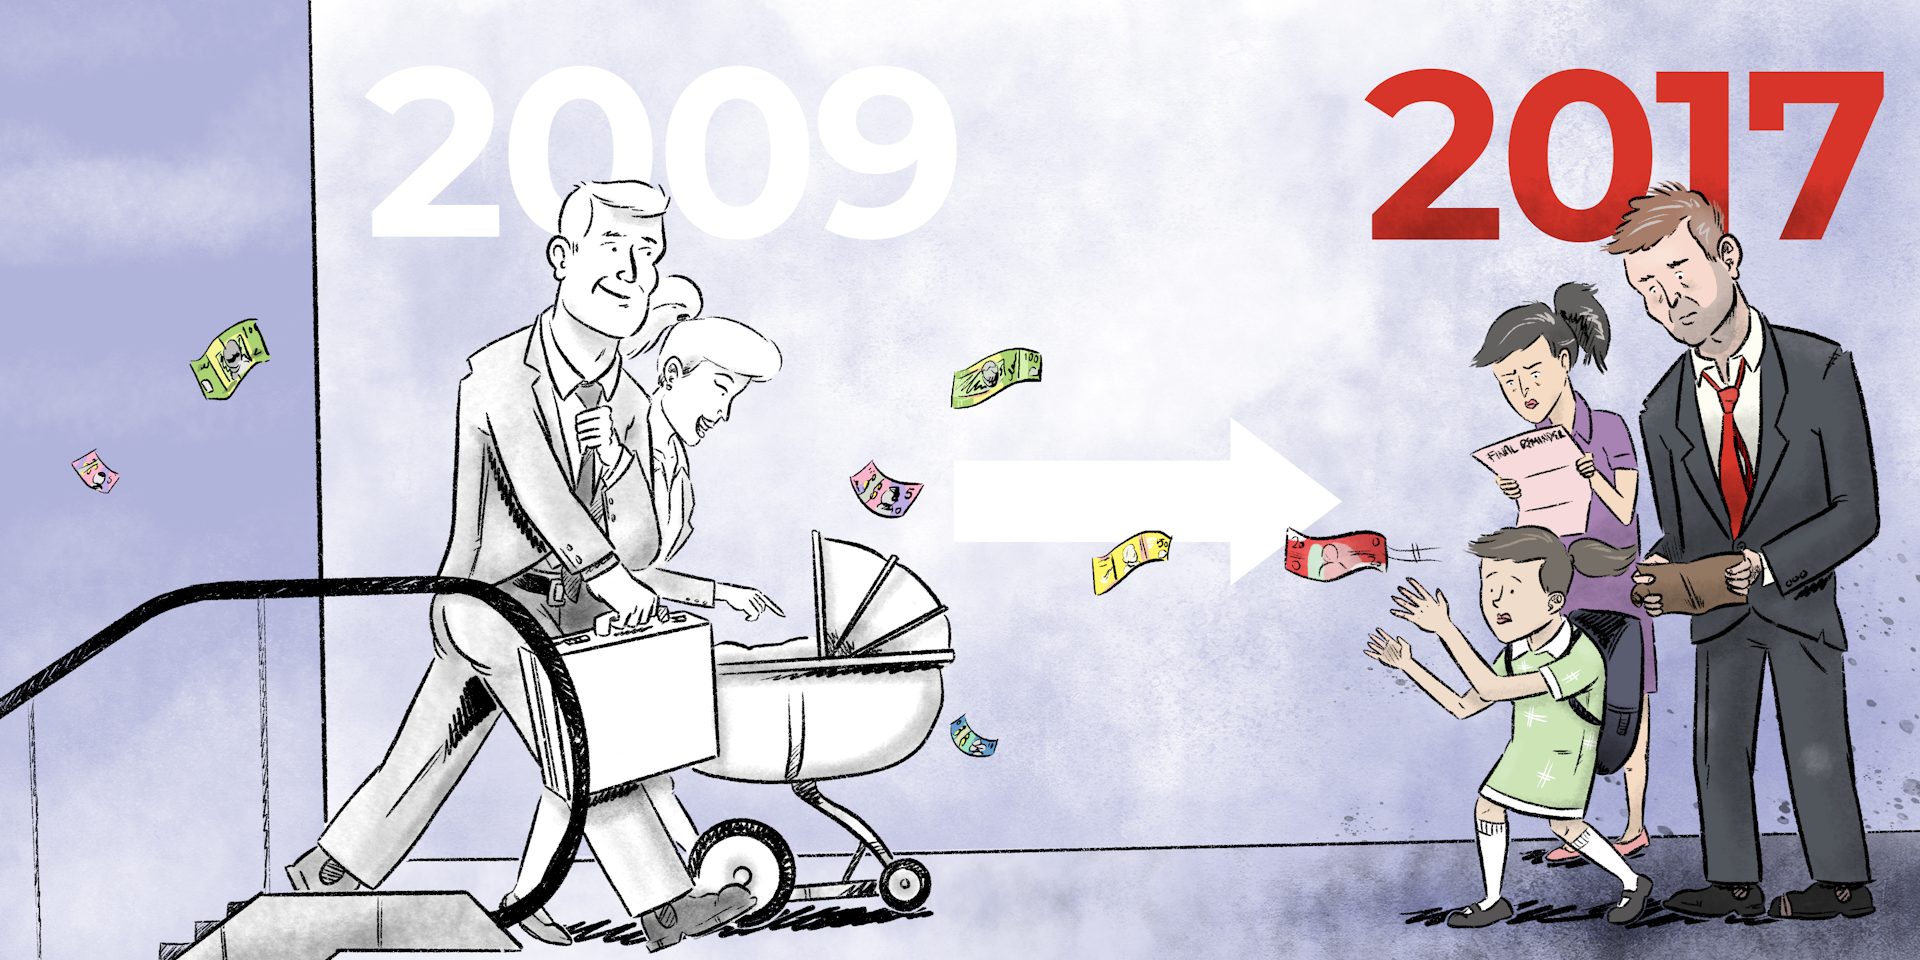
It finds that for the thousands of households it interviewed, real disposable income grew strongly during the first nine years of the survey, between 2001 and 2009. Then, after the global financial crisis, for the eight years between 2009 and the 2017 results released today, that growth stalled.


Expressed in today’s dollars, the average annual real disposable income of those households climbed by A$19,773 between 2001 and 2009, about $2,472 per year.

But most of the growth was during the mining boom that stretched from 2003 to 2009 when the average annual real disposable household income climbed about $3,000 per year, as did the income of the more representative median (or middle) household.

Since 2009 and the global financial crisis, the average and the median have moved in different directions.

The average houshold’s annual real disposable income has climbed a further $3,156. The median (or typical) household’s income has fallen $542, although not steadily. The graph shows it falling between 2009 and 2011, climbing in 2012, and changing little thereafter.

…and as if it’s harder to get ahead…

It has also become harder to “get ahead”, in the phrase used often by the prime minister.

Between 2001 and 2005, 40% of the households in the bottom fifth of earners (the bottom qunitile) moved out of it into a higher one. In more recent years, between 2012 and 2016, a lower 38.5% moved up.

Between 2001 and 2005, 44% of the households in the top qunitile had to move down to let other households take their place. In more recent years, between 2012 and 2016, only 41.5% have moved down.

Getting a long way out of the income circumstances you were born in is a long-shot, according on HILDA’s early attempt at measuring intergenerational mobility.

People who were 32-34 years old in 2015-17 are highly likely to be in the same household income quintiles as those people found themselves in when they were 15-17 back in 2001-03.


There’s only a one in ten chance of moving from the bottom quintile as a teenager to the top quintile in your early thirties. There’s a 37% chance you’ll stay put.

Even among teenagers who grew up in the middle quintile, there’s only a 17% chance of making it to the top, along with a 19% chance of moving one rung up.

Interestingly, women turn out to be more tied to the income their families had when they were children than men, and both men and women tend to stay more closely tied to their mother’s income than their father’s.

…yet we are less reliant on welfare, even pensions…

When HILDA began in 2001, 39% of Australians aged 18 to 64 were living in a household that received government welfare of some kind. By 2017, that proportion had fallen to 31%, but almost all of the drop happened before the global financial crisis in 2009.

Most of us are still in households that have received something from the government over a 10-year period: 58% of working age Australians in 2017, down from 64% in 2010.

Among older Australians aged 65 and over, reliance on the age pension and other benefits for more than half of income needs has dropped from 60% to 51%.

Among new retirees aged 65 and over, the proportion receiving the age pension has fallen from 76% of men and 74% of women to just 60% of men and 55% of women.


Read more: More people are retiring with high mortgage debts. The implications are huge


But while the growth of compulsory superannuation is likely to be part of the story, almost all of the decline happened before the financial crisis in 2009, suggesting that the destruction of wealth in the crisis kept people on the pension who otherwise might not have needed it.

…and gender roles are changing

Before the financial crisis, almost three quarters (73%) of men of traditional working age were employed full-time. After the crisis, the rate slipped to a much lower 67% and stayed there.

Female full-time employment was also hit by the crisis but has since almost totally recovered to be just a fraction below its pre-crisis peak of 39.6%.

Women’s hourly earnings are also climbing faster than men’s, up 24% between 2001 and 2017, compared to 21% for men’s.

While women have always been more likely than men to be employed casually, since the crisis male casual employment has climbed while female casual employment has declined.

The two are now as close as they have ever been, with women now only six percentage points more likely than men to be employed causally.


Read more: HILDA findings on Australian families' experience of childcare should be a call-to-arms for government


In dual-earner male-female couples, the proportion in which the woman earns more than the man has climbed from 22% to 25%.

The woman being the main breadwinner is more common in couples that aren’t legally married and don’t have children. It is also far more common in the regions than in cities and among couples in which the man doesn’t have a university degree.

Men in predominantly female breadwinner households are somewhat less happy with their lives and with their relationships, as (perhaps surprisingly) are women.

Fathers tend to agonise more about work-family conflict than mothers, notwithstanding the much greater amount of housework and childcare work performed by mothers. The men who worry the most work long hours, have irregular shifts and very young children. A mother working the same hours as a father will typically be more conflicted.


Read more: Language of love: a quarter of Australians are in inter-ethnic relationships


Most parents suffering high work-family conflict get out of it within a year or two, often by managing things better and sometimes by changing jobs. Those suffering high work-family conflict are 50% more likely than others to separate the next year.

HILDA’s great strength is that it will be able to follow those parents and their children and all the other families it surveys and tell us what happens next. Rather than being an Australian version of Seven Up!, it might be better described as Australia’s never ending story. Its co-director Roger Wilkins says its design allows it to be “infinitely lived”.


Read more: Australian city workers' average commute has blown out to 66 minutes a day. How does yours compare? The Conversation


Peter Martin, Visiting Fellow, Crawford School of Public Policy, Australian National University

Wes Mountain/The Conversation, CC BY-ND

This article is republished from The Conversation under a Creative Commons license. Read the original article.

Read more >>

Thursday, August 03, 2017

Why we're suddenly concerned about inequality. Things have stopped getting better

Bill Shorten's on to something. Not the pointless debate over inequality – whether it's rising or not depends on what you measure – but the truth that lies beneath the debate.

It's that, unusually, life is getting harder.

In every year since the turn of the century the Melbourne Institute's Household Income and Labour Dynamics survey has asked the same 7000 households a raft of questions designed to establish whether things are getting better or worse. HILDA is a statistical version of Seven Up.

In all but four of the past 15 years, things were getting better.

Two of those four years followed the global financial crisis. The other two were the two most recent years for which we have data: the first two full years of the Abbott-Turnbull government.

It means that whereas before the election of Tony Abbott, a typical Australian family took home about what it did in 2009, it now takes home less, after adjusting for inflation.

It's unusual, absent a recession. But it's been bearable because interest rates have been falling. When they climb, as they have just started to for some borrowers, it'll become painful.

As Shorten put it in a speech that purported to be about inequality but was actually about declining real incomes, "It feeds that sense, that resentment, that the deck is stacked against ordinary people, that the fix is in and the deal is done."

We didn't get that sense when ordinary incomes were rising, even though inequality was widening. Only now, when real incomes are slipping, do we feel resentful.

And it's mainly men who are resentful. Female earnings are trending up, especially those of women employed full-time. Male earnings are trending down.

University graduates earn much less than their predecessors used to ($1023 a week, down from $1468) and they are much less likely to be in full-time jobs four years later (73 per cent, down from 91 per cent).

Australians with only a high school qualification are even worse off. When the survey started, 81 per cent of them were employed full-time within four years. Now it's 62 per cent.

The survey's custodian, Roger Wilkins, notes dryly that this suggests the payoffs from university education have not deteriorated "relative to the alternatives".

As more and more of us work in part-time rather than full-time jobs, an increasing proportion are combining part-time jobs in order to work full-time. This means that part-time jobs are more common than the Bureau of Statistics survey suggests and that full-time jobs are harder to get.

Home ownership rates for the under-40s have collapsed. In 2002 when the survey began, 32.5 per cent of 18- to 39-year-olds owned a home. It's now 24.9 per cent.

The proportion of men in their early-20s living with their parents has jumped from 43 per cent to 60 per cent. The proportion of early 20s women staying at home has jumped from 27 per cent to 48 per cent.

Those who can buy houses find it hard to pay them off. The average mortgage taken out by a young homebuyer has almost trebled – jumping from $120,813 to $330,687. Going back to the same homeowners year after the year the survey finds that in most years the amount owed climbs as a substantial minority of young homeowners refinance or redraw or fall behind on their loans.

Wilkins says if they continue like this – using their mortgages to fund day to day expenses – there will be "real implications for future aged pension liabilities".

Australians are working longer without waiting for the pension age to rise. The typical retirement age has climbed from 62 to 66 for men, and for 61 to 64 for women. And retirement is less likely to be a one-off event. Thirteen per cent of men who retired between the ages of 60 and 64 find themselves back at work within a year, up from 9 per cent. Seven per cent of the women who retired between 60 and 64 find themselves back at work in a year, up from 4 per cent.

Even now, a quarter of a century after the introduction of compulsory superannuation and 15 years after compulsory contributions of around 9 per cent, the balances of retirees are surprisingly low.

Thirty per cent of men retire without super, and 29 per cent of women.

The men who do have super retire with a typical balance of $325,200; the women with $110,952. That typical balance is the median, meaning half of the retirees will have more, and half less. The mean (average) is much higher, pushed up by very big retirement balances at the top.

Retirees with low balances are highly likely to use them to pay off debts, obliterating 58 per cent of their super (men) or 70 per cent (women) in one go.

Wilkins says a significant proportion of people with relatively low balances are making the decision "not to use their superannuation to help fund their retirement".

Australia remains a wealthy country. But it isn't absolute wealth (or even relative inequality) that matters most when it comes to our feelings. It's whether or not things are getting better. HILDA suggests they are getting worse.

In The Age and Sydney Morning Herald
Read more >>

Tuesday, August 01, 2017

Better under Rudd: Household finances in reverse

The typical Australian family takes home less today than it did in 2009, when Kevin Rudd was prime minister.

The shocking finding, in the latest latest wave of the Household Income and Labour Dynamics survey, helps explain a growing political divide about inequality, even though the survey itself provides mixed evidence on whether things are getting worse.

Unique among Australian surveys, HILDA has been conducted every year since 2001 by returning to the same households and tracking changes in their lives.

Funded by the Department of Social Services and managed by the Melbourne Institute, it is able to reveal what the census and other mass surveys cannot: how the life circumstances of individuals change over time.

More than 7000 households have been surveyed each year. Another 2000 have been added in recent years, bringing the total number of people surveyed up to 17,300, including 5000 children.

The survey finds that real household disposable income (net of tax) peaked just before the global financial crisis at $77,411.

It fell sharply in 2010 and 2011 to $73,531 and then climbed back to $77,143 before sliding in 2014 and 2015 to $76,225.

The figures are medians, meaning half of Australia's households would have earned more than $76,225 and half less.

A measure of inequality, the Gini coefficient, shows little change in household inequality over the entire 15 years of the survey.

But when only earnings from paid work are examined on an individual basis, the survey finds inequality has worsened since 2008, by about 7 per cent for men and 9 per cent for women.INTERACTIVE

Over 15 years the typical inflation-adjusted household income has climbed from $58,956 to $76,225.

Sydney experienced the weakest growth of any region, with the typical household income adjusted for size climbing just $5182.

The typical Melbourne income climbed $9785. Perth household incomes grew $19,276.

The relatively weak performance of Sydney has changed the league table, with Perth now the highest-earning Australian state capital, with a typical real household income of $56,073, up 52 per cent after adjusting for inflation.

Brisbane is in second place on $49,210, followed by Melbourne on $48,494.

Sydney, which had the highest household income of any state capital back in 2001, is in fourth place just ahead of Adelaide at $44,779.

The percentage of Australians in poverty has fallen since 2001, whether measured as the proportion of households earning less than 50 per cent of the typical household adjusted for size, or whether measured as the proportion of households able to afford a limited basket of goods.

Poverty is highest among older Australians, especially women, although the report says the measure will overstate poverty where elderly Australians own their own homes and don't have to pay rent as many do.

Poverty is lowest among couples with dependant children.

Victoria has the most extreme geographical divide, with Melbourne having one of Australia's lowest poverty rates at 7.6 per cent while other Victorian towns and cities have 16.5 per cent.

In NSW the rates in Sydney and other towns and cities are much the same at 10.5 and 11.6 per cent.

South Australian regional towns and cities are the most disadvantaged in Australia with a poverty rate of 21.1 per cent, compared with 10.1 per cent in Adelaide.

Most people in poverty improve their situation in one to two years.

Far fewer Australians live in households that receive welfare payments than in 2001: 32.2 per cent of workforce-aged Australians, down from 38.1 per cent, and most get off it fairly quickly.

The experience of those surveyed suggests that university education is not the ticket to full-time employment it used to be.

Around 86 per cent of those who graduated between 2001 and 2005 were in full-time jobs five years later, compared with just 75 per cent of those who graduated between 2010 and 2011.

They were more likely to be employed part-time or doing further study.

The decline in full-time employment for men who had only completed high school was even worse, from 81 per cent to 32.6 per cent.

In The Age and Sydney Morning Herald
Read more >>

Wednesday, July 20, 2016

Hard times. We're no better off than in 2009

If you think you are worse off despite a raft of economic statistics saying things are getting better, you're probably right.

Australia's longest-running household survey finds home ownership is increasingly out of reach for many of us, one in eight families don't have $500 in savings in case of emergency, and that real household disposable incomes peaked in 2009.

Australia's longest-running Seven Up! style longitudinal survey of Australian households finds that real household disposable incomes peaked in 2009 and still aren't back to where they were.

The finding is different from those of other studies that survey different Australians at different times.

The Household, Income and Labour Dynamics in Australia survey (known as HILDA) tracks the same 17,000 Australians each year to find out whether their particular living standards have improved rather than those of the population on average.

Beginning in 2001, the survey finds that the typical household was better off each year until 2009, with the typical real household disposable incomes climbing from $57,704 to $76,264 - a gain of 32 per cent.

The gain includes more than what happened to households on average, it includes promotions and increased employment opportunities for household members surveyed.

Between 2009 and 2011 the global financial crisis pushed down typical household income 5 per cent to $72,260 as household members lost jobs, worked fewer hours and lost pay rises.

Since 2012 household income has recovered slowly, climbing to $75,731 in 2014, still 0.7 per cent worse than in 2009, meaning typical Australian families are no better off than they were five years ago.

Household disposable income is the combined income of all household members after receipt of government pensions and benefits and after taxes. It is adjusted for inflation.

Household wealth has also been slipping, sliding 3.3 per cent since 2010. Between 2006 and 2010 it climbed 4.8 per cent.

Superannuation is the most important household asset after property, but it is a long way behind.

In 2014 the average household owned a home worth $392,241, secured with a debt of $100,689 and a second property worth $138,718 secured with a debt of $42,226.

The average superannuation balance was $168,011, average share ownership $44,116 and average cash in the bank $51,118.

But in this survey, 12 per cent of households surveyed were unable to lay their hands on $500 of savings in the event of an emergency.

Almost 80 per cent said they believed that savings of at least $500 were essential.

Five per cent were unable to afford dental treatment when needed. Almost all believed that dental work was essential.

Seven per cent were unable to afford new clothes for their school-aged children. Sixty per cent believed new clothes were essential each year.

Professors Peter Saunders of the University of NSW and Roger Wilkins of the University of Melbourne used the answers to construct a "deprivation score" which counted the number of essential items the individual could not afford.

Twelve per cent of Australians were deprived of at least two essential items. Seven per cent were deprived of at least three.

Single parents had the worse deprivation score, with almost 20 per cent unable to afford three or more essential items.

Singles were much worse off than couples regardless of whether they had children.

Nine per cent of single non-elderly men were deprived of three or more essential items and eight per cent of women.

Retirees were much better off with only 3.5 per cent of singles deprived of three or more essential items and less than 1 per cent of retired couples.

Fourteen per cent of unemployed Australians were unable to afford three or more essential items.

In The Age and Sydney Morning Herald
Read more >>