Wednesday, August 18, 2021

Australia is at risk of taking the wrong tack at the Glasgow climate talks, and slamming China is only part of it

Buried within the prime minister’s response to the latest report from the Intergovernmental Panel on Climate Change is just about everything we’re at risk of getting wrong at the Glasgow climate talks in October.

After slamming China — whose emissions per person are half of Australia’s — for not doing more to cut emissions, Scott Morrison said the Glasgow talks were the “biggest multilateral global negotiation the world has ever known”.

If he treats the talks as just another (big) negotiation, we’re in trouble.

The way the Department of Foreign Affairs and Trade usually treats negotiations is hold something back, hold out the prospect of “giving it up,” and then only make the concession if the other side gives something in return. Even if holding back damages Australia.

Cars are a case in point. From an economic point of view, there is no reason whatsoever to continue to impose tariffs (special taxes) on the import of cars — none, not even in the eyes of those who support the use of tariffs to protect Australian jobs. Australia no longer makes cars.

Yet the tariff remains, at 5%, making it perhaps A$1 billion harder than it should be for Australians to buy new cars (although nowhere near as hard as it was in the days when the tariff was 57.5%).

The tariff seems to be in place largely to give the Department of Foreign Affairs and Trade something to negotiate away in trade agreements: for use as what the Productivity Commission calls “negotiating coin”.
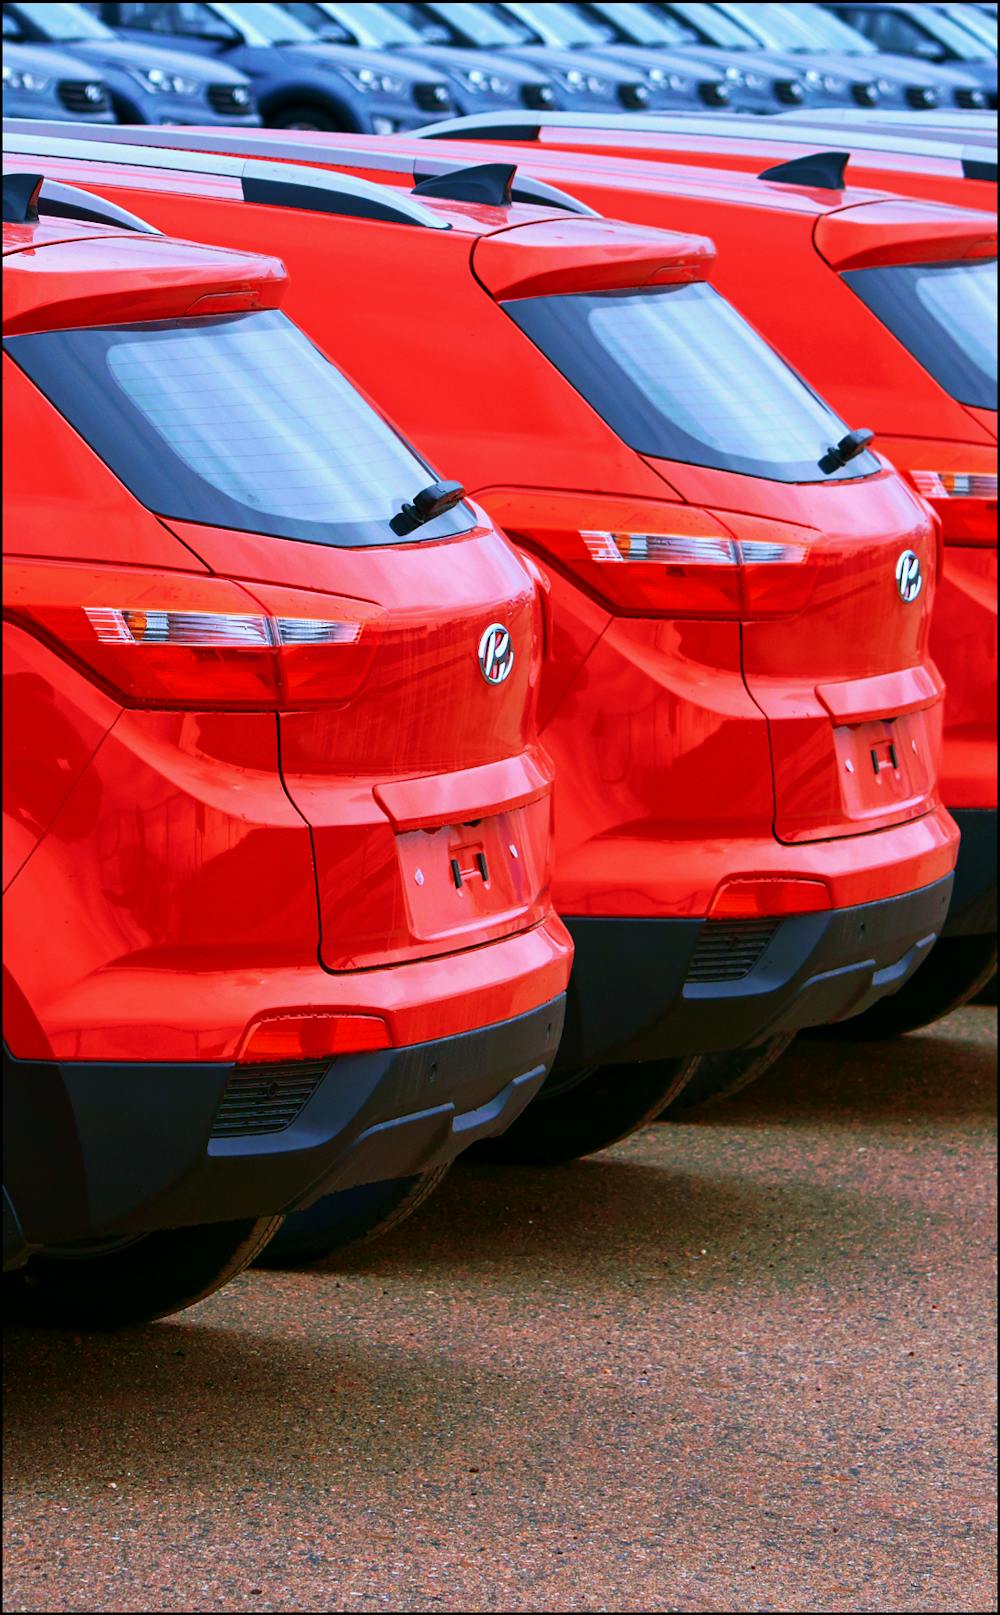
Here’s how it worked in the 2014 Australia-Korea Free Trade Agreement. Australia agreed to remove the remaining 5% tariff on Korean cars, “with consumers and businesses to benefit from downward pressure on import prices”.

But Australia didn’t remove the tariff on car imports altogether, which would have given us a much bigger benefit but denied the department negotiating coin.

The next year the department did it again, agreeing to give up the tariff on imported Japanese cars in the Japan-Australia Economic Partnership Agreement (but not on other cars) so Australians could “benefit from lower prices and/or greater availability of Japanese products”.

Two years later, it did it again, with cars from China.

When the UK and European agreements are negotiated, it’ll do it there too.

Australia holds back reforms

Eventually Australians will get what they are entitled to. But the point is that rather than advancing the cause of free trade, the department has held back, treating a win for the other side as a loss for us, when it wasn’t.

The Centre for International Economics believes the much bigger earlier set of tariff cuts lifted the living standard of the average Australian family by A$8,448.

Had our trade negotiators been in charge, we would still be waiting. Instead the Hawke and then the Keating governments pushed through unilateral reductions, asking for nothing in return.


Read more: This is the most sobering report card yet on climate change and Earth's future. Here’s what you need to know


As former Trade Minister Craig Emerson put it, this gave Australia “credibility in international trade negotiations way beyond the relative size of our economy”.

Does that sound like the sort of thing Australia might need at Glasgow, to have enough credibility to urge even bigger emitters to deliver the kind of cuts on which our futures and future temperatures depend?

It won’t work with China

The prime minister is right to say that China is the world’s biggest greenhouse gas emitter, even though its emissions per person are low. Its high population means it accounts for 28% of all the greenhouse gases pumped out each year. The next biggest emitter, the United States, accounts for 15%

But China’s status is new. Until 2006 it pumped out less per year than the United States. Because the US has had mega-factories and heating and so on for so much longer, it is responsible for by far the biggest chunk of the greenhouse gasses already in the atmosphere: 25%, followed by the European Union with 22%.
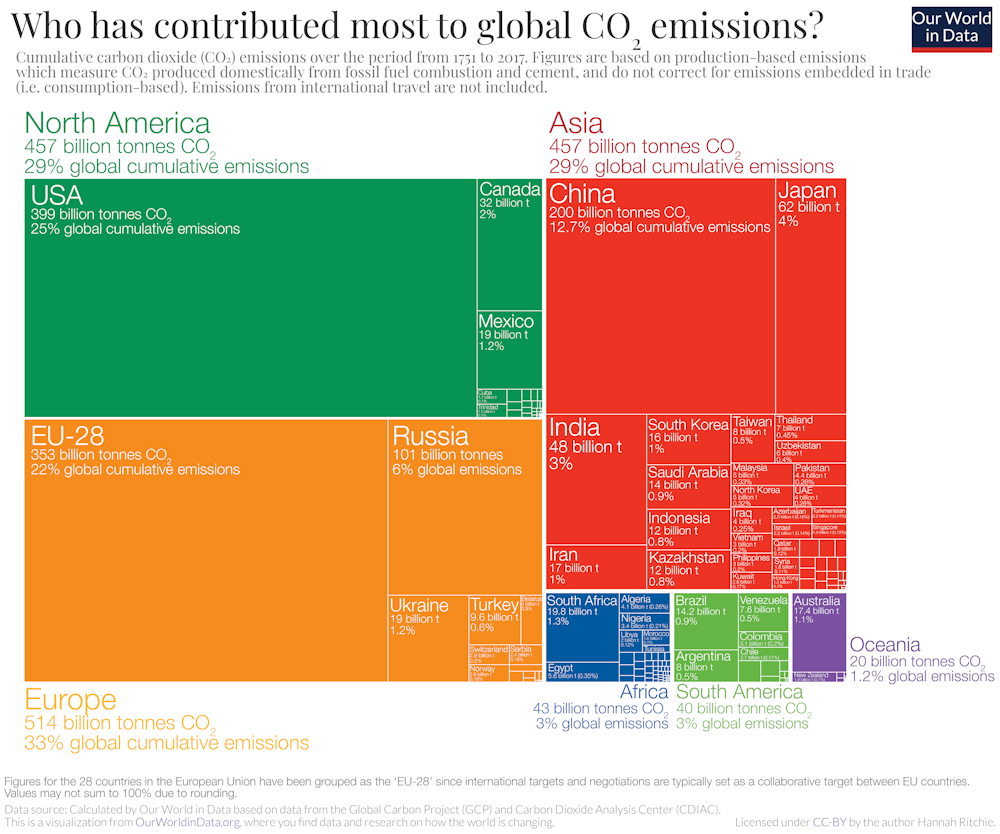


China might reasonably feel that countries like the US that have done the most to create the problem should do the most to fix it.

Like Australia, the US pumps out twice as much per person as China and has much more room to cut back.

On the bright side, China knows that being big means it is in a position to make a difference to global emissions in a way that other countries cannot on their own. And that’s a position that can benefit its citizens.

China’s latest five-year plan, adopted in March, commits it to cut its “carbon intensity” (emissions per unit of GDP) by 18%. If it beats that five-year target by just a bit (and it has beaten its previous five-year targets) its emissions will turn down from 2025.

It is aiming for net-zero emissions by 2060.

Australia needs China’s help

The Intergovernmental Panel on Climate Change finds that Australia is especially susceptible to global warming. We’re facing less rain in winter, longer heatwaves, drier rivers, more arid soil and worse droughts.

We are right to want China to do more, but the worst way to achieve it is to say “we won’t lift our ambition until you lift yours”.

Hardly ever a worthwhile strategy, it is particularly ineffective when we don’t have bargaining power.


Read more: Climate change has already hit Australia. Unless we act now, a hotter, drier and more dangerous future awaits, IPCC warns


The only power we’ve got is to set an example, unilaterally, as we did with tariffs. And to ramp up our ambition.

If Australia said it would do more, and didn’t quibble, it might just count for something.

It’s all we can do, and it’s the very best we can do.

Peter Martin, Visiting Fellow, Crawford School of Public Policy, Australian National University

This article is republished from The Conversation under a Creative Commons license. Read the original article.

Read more >>

Wednesday, August 11, 2021

Casino operator Crown plays an old business trick: using workers as human shields

Casino operator Crown Resorts must be desperate or think we’re dumb.

Last week, before the royal commission into its right to hold a casino licence in Victoria, Crown resorted to one of the oldest, most discredited, tricks in the book. It used its workers as shields.

“More than 20,000 people work across Crown’s resorts. Over 11,600 of those work in Melbourne. The vast majority of them were of course not complicit in the misconduct,” its lawyer Michael Borsky told the commission.

Revoking Crown’s licence would sentence Crown’s employees to “enormous disruption and possibly financial hardship” at a time when many were already “living through great uncertainty and hardship”.

And not only Crown’s employees. Among Crown’s shareholders were “tens of thousands of small shareholders and, indeed, superannuation funds”.

Removing Crown’s licence would not only endanger Crown’s workers, it would have “a significant impact on the Victorian tourism industry”.

Crown provided 10% of Melbourne’s hotel rooms. Before COVID-19 hit, it contributed A$1.2 billion per year to Victoria’s economy.

It’s a logically flawed defence of the kind I first heard from Alan Bond’s Bond Corporation in the late 1980s, several years before he was imprisoned for fraud.

Trying to fend off an attempt to have his breweries placed in receivership, the company said Bond had 20,000 employees. They might not “have a job to go to on Tuesday”.

The logical flaw was the suggestion that if Bond didn’t own the breweries, the breweries wouldn’t exist.

The beers made by those breweries — Tooheys, Swan and XXXX — are still being made today.

Similarly, if Crown loses its casino licence, its 10% of Melbourne hotel rooms will still be there, most likely run by someone else. Its casino (or one like it) will also still be there, also run by someone else.

Clive Palmer tried it as well

The use of this flawed argument reached its peak early last decade during the battle over Labor’s proposed resource super profits tax.

Despite its name, the tax was designed as a profit-sharing arrangement. The government would be on the hook for 40% of the cost of each project and would take 40% of the profit.

If a project was profitable for a mining company, then 60% of the project would also be profitable, meaning the tax ought to make no difference to its willingness to invest.


Read more: Mineral wealth, Clive Palmer, and the corruption of Australian politics


Yet mining magnates such as Clive Palmer and Andrew Forrest threatened to abandon Australia and take their money elsewhere, to Africa or to China.

Their threats were no more a threat to Australian mining than Alan Bond’s was to Australian brewing.

If Forrest and Palmer had walked away (or even BHP and Rio Tinto, which talked along similar lines), someone else would have walked in.

The arrangement might not be to their liking, but it would be to the liking of someone else prepared to take the profit in their place.

Crown, as Royal Commissioner Ray Finkelstein pointed out on August 3, is profitable. Its casino operation is very profitable: “maybe on the decline a little bit, but very profitable”.

“The way industry works is somebody will always step in, so I don’t treat 12,000 employees [as] at risk. ” Finkelstein said.

“They might change their employer, but they are not at risk of losing their jobs.

Nor were suppliers or tourists at risk.

"When we have a profitable operating business, there will be an operator there out in the world, a suitable one.”

A line that used to work — on television

That Crown thought it could spin this line might have something to do with the experience of its largest shareholder, from whom Crown is now distancing itself.

James Packer used to own Channel Nine (as in an earlier era did Alan Bond).

For most of its life, Australia’s television owners have played chicken with the bodies meant to be policing them — the Australian Broadcasting Tribunal and then the Australian Communications and Media Authority.

Each body was given enormous power: the power to suspend or cancel a licence, but with a catch. It lacked lesser powers.


Read more: The TV networks holding back the future


If it suspended or cancelled an operator’s licence, the station would go off the air (at least for a while). The authority would be deluged with complaints.

Packer, Bond and the other owners could use their viewers as human shields.

Time after time (11 times in five years) the authority found Nine had breached the industry code of practice. Time after time it failed to invoke the ultimate sanction.

In a 2005 report for the authority, Professor Ian Ramsay said this meant that in effect it had “less enforcement powers” than other authorities.

Crown’s workers don’t place it beyond the law

Blessedly, in 2006 (as Packer was selling out of Nine) the government acted on Ramsay’s report. The authority can now issue fines and seek enforceable undertakings, without fear of blow-back.

For Finkelstein to accept that if Crown’s licence was revoked its workers or the tourist industry would suffer would be to accept that, like the television industry was for many decades, Crown is beyond the practical reach of the law.

He is giving every indication he thinks no such thing.The Conversation

Peter Martin, Visiting Fellow, Crawford School of Public Policy, Australian National University

This article is republished from The Conversation under a Creative Commons license. Read the original article.
Read more >>

Wednesday, August 04, 2021

Paying Australians $300 to get vaccinated would be value for money

I reckon Albo’s on the right track. The opposition leader wants to pay A$300 to every Australian who is fully vaccinated by December 1.

The Grattan Institute is on a similar theme. It has proposed a $10 million per week lottery, paying out ten $1 million prizes per week from Melbourne Cup day. One vaccination gets you get one ticket. Two gets you two tickets.

The costs are tiny compared to what’s at stake. Treasury modelling released on Tuesday puts the cost of Australia-wide lockdown at $3.2 billion per week.

Paying people to get vaccinated fits the government’s criteria of a response that’s “temporary, targeted and proportionate”.

And the published research on small payments shows they are extraordinarily effective, often more effective than big ones.

A few years back, Ulrike Malmendier and Klaus Schmidt of US National Bureau of Economic Research discovered that a small gift persuaded the subject of an experiment to award contracts to one of two fictional companies 68% of the time instead of the expected 50%.

Small payments can be more effective than big ones

A gift three times as big cut that response to 50%, which was no better than if there had been no gift at all.

The effect of small payments to pregnant British smokers has been dramatic.

Offered £50 in vouchers for setting a quit date, plus £50 if carbon monoxide tests confirmed cessation after four weeks, £100 after 12 weeks and £200 in late pregnancy in addition to the counselling and free nicotine replacement therapy given to the other pregnant smokers, those offered the payment were more than twice as likely to quit — 22.5% compared with 8.6%.


Read more: Albanese calls for $300 vaccination incentive, as rollout extended to vulnerable children


Never mind that these small sums ought to have made no financial sense.

The gifts were minuscule compared with the money the recipients would have saved anyway by not smoking, yet they worked so well that the researchers estimated the cost of the lives saved at just £482 per quality-adjusted year.

Around 5,000 British miscarriages each year are attributable to smoking during pregnancy. The participants randomly assigned the offer of a payment not to smoke gave birth to babies that were on average 20 grams heavier.

The incentives can be even smaller.

Mai Frandsen at the University of Tasmania has trialled offering smokers half as much — a A$10 voucher on signing up, then $50 per checkup in addition to support from a pharmacist. The results are encouraging.

Lotteries are cheaper still. The Grattan Institute’s suggestion of a $10 million per week payout sounds like a lot, but it isn’t when divided by Australia’s population.

A preliminary analysis of Ohio’s Vax-a-Million lottery found it increased takeup by 50,000-80,000 in its first two weeks at a cost of US$85 per dose.

Beer, doughnuts, dope

Other incentives offered with apparent success in the US include free beer, donuts and (in Washington state) free cannabis.

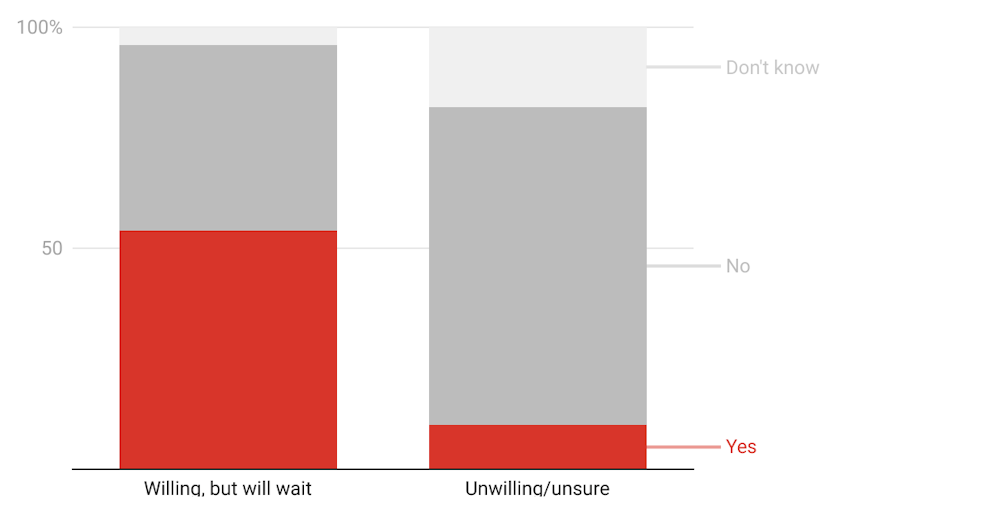
They needn’t work for everyone. A survey conducted by the Melbourne Institute in June found that of those who were willing to get vaccinated but hadn’t got around to it, 54% would respond to a cash incentive.

Of those who weren’t willing or weren’t sure, only 10% would respond to cash.


If you were paid a cash incentive, would you get vaccinated as soon as possible?

Melbourne Institute Pulse of the Nation survey

But the important thing about vaccination is that not everyone needs to do it.

The Grattan Institute believes 80% of the population needs to be vaccinated before we can reopen borders.

The national cabinet has adopted a lower target: 80% of Australians over 16, which is 65% of the population.

Vaccination expert Julie Leask says when it comes to child vaccines, most non-vaccinating parents are simply “trying to get on with the job of parenting”. If it’s made easy for them, they’ll do it.


Read more: When will we reach herd immunity? Here are 3 reasons that's a hard question to answer


There’s not a lot to be gained by trying to reach these who actually don’t want to be vaccinated. Try too hard, and you’ll get their backs up.

The tragedy of the government’s COVID vaccine rollout (aside from the difficulties with assuring supply) is that the government hasn’t made it easy.

Vaccination ought to be easy

The government could have made it easy. When it sought advice last year from departments including the treasury, it was told to do what’s done for the flu vaccine — to distribute it through employers and pharmacies as well as general practitioners, so as to make it almost automatic.

The best part of a year later, it’s a view the prime minister is coming round to. Most of us don’t go to the doctor very often — it’s out of our way.


Read more: Over 18 and considering AstraZeneca? This may help you decide


For a government that came to office promising to slash red tape for business and offered businesses incentives to invest, this government appears not to have fully grasped the importance of red tape and incentives when it comes to health.

It might yet. Prime Minister Scott Morrison said yesterday he had investigated something along the lines put forward by Albanese. General Frewen, in charge of the COVID taskforce, said it wasn’t needed “right now”.

When the time comes, if we remain under-vaccinated, Morrison can reach for it.

Peter Martin, Visiting Fellow, Crawford School of Public Policy, Australian National University

This article is republished from The Conversation under a Creative Commons license. Read the original article.

Read more >>

Monday, August 02, 2021

Top economists say cutting immigration is no way to boost wages

Australia’s top economists have overwhelmingly rejected cuts to either permanent or temporary migration as a means of restoring lost wage growth.

The 56 leading economists polled by the Economic Society and The Conversation include a former head of the Fair Pay Commission and a former expert member of the Fair Work Commission’s minimum wage panel.

Among the experts, selected by their peers, are specialists in economic modelling and the economics of labour markets from both the private and public sectors.

All but five rejected cuts in temporary migration as a means of boosting wage growth. All but three rejected cuts in permanent migration.

The results put the economists at odds with Reserve Bank Governor Philip Lowe, who last month drew a link between temporary migration and weak wage growth saying employers had been using overseas hires to fill gaps that would have been filled by locals, diluting “upward pressure on wages in these hotspots”. He said this might have spilled over to rest of the labour market.

Cutting temporary and cutting permanent migration were the first two of ten options for boosting wage growth presented to the panel of economists. The panel rated them third last and second last. Only “holding back growth in female and older worker participation” was marked down more.

Each economist was asked to pick three of the ten options. The most popular, picked by 78.2%, was measures to boost productivity growth. The next most popular, picked by 50.9%, was measures to boost business investment.


Michael Keane of The University of NSW said the idea that population growth and increased labour supply were constraining wage growth was “so naive as to not really be worthy of comment”.

Consultant Rana Roy said only a “cultivated amnesia” could ignore the near-uninterrupted growth in real wages in US, industrialised Europe and Australia amid record inbound immigration in the decades after the second world war.

Gabriela D'Souza of the Committee for Economic Development of Australia said the idea owed much to a “one dimensional view of the world” that took account of only the direct impact of immigrants on particular wages and not the impact of their demand for goods and services on a broader range of wages.

Dozens of studies had identified the overall impact as “near zero”.

Productivity ‘almost everything’

Robert Breunig of the Australian National University said immigrants appeared to add to productivity rather than detract from it, meaning slowing down immigration could slow down rather than add to productivity and growth.

Three quarters of the panel nominated productivity growth as the most important precondition for higher wages growth, endorsing the conclusion of Nobel Prize winning economist Paul Krugman that “productivity isn’t everything, but in the long run it is almost everything.”

Krugman famously added that a country’s ability to improve its standard of living over time depended “almost entirely on its ability to raise its output per worker”.


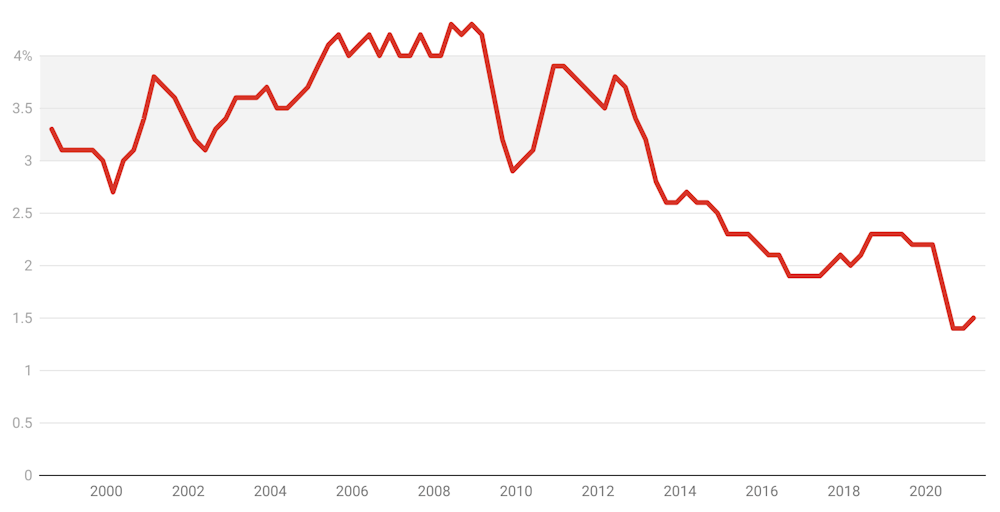
Wages growth is way below the Reserve Bank’s +3% target

Total hourly rates of pay excluding bonuses, seasonally adjusted. Change from corresponding quarter of previous year. ABS Wage Price Index

Ian Harper, a former head of the Howard government’s Fair Pay Commission and a current member of the Reserve Bank board, said that without productivity growth, any boost in wages growth that was delivered was likely to be nominal — matched by inflation — rather than real, delivering higher living standards.

One of the best tools for lifting production per worker was business investment.

One of the five economists who thought immigration hurt wages growth, Macquarie University’s Geoffrey Kingston, said it seemed to do it by thinning investment per worker. In the 1980s, under Prime Minister Bob Hawke, increased immigration helped push down real wages for five years in a row.

Several of those surveyed said wage growth needed investment in more than machines. Griffith University’s Fabrizio Carmignani said what also mattered was investment in “human capital” via education and research and development.


Read more: Exclusive. Top economists back unemployment rate beginning with '4'


Adrian Blundell-Wignall, a former division chief at the Organisation for Economic Co-operation and Development, said reforming the education system and getting rid of elitism had to be part of the plan.

“That the best predictor of how well you do at school is how rich your parents are and where they went to school is a national tragedy,” he said. “The entitlement and club economy that comes with this permeates politics, business, and who gets the best jobs after completing school.”

Former Rudd and Gillard government minister Craig Emerson said while measures to boost productivity growth were essential, even if implemented soon, they would take years to flow through into higher wages.

It’s how you divide the pie

Saul Eslake said whether or not higher productivity growth actually delivered higher real wages would depend on the division of the fruits of that growth between wages and profits.

John Quiggin said nearly every reform of Australia’s industrial relations system since 1975 had acted to reduce the bargaining power of unions. All ought to be reviewed with a “presumption in favour of repeal”.

Mala Raghavan of the University of Tasmania said wage growth had become uneven. Wages for a small number of managers had soared while wages for others — especially casual workers — had barely moved.


Read more: Top economists want JobSeeker boosted $100+ per week, tied to wages


The Australian National University’s Emily Lancsar saw a triple benefit from reforming the industrial relations system to support higher wage decisions: it would increase wages directly, it would put money that would have been paid out as profits in the hands of people likely to spend it, and the increases would flow through to workers not directly affected by the decisions.

Labour market specialist Jeff Borland added that there was a case for strengthening the ability of unions to obtain gender pay equity in female-dominated occupations.

None of those surveyed were optimistic about the prospect of quickly lifting wages growth. The Reserve Bank said in July it wasn’t planning to lift interest rates until aggregate growth exceeded 3%.


Detailed responses:

Peter Martin, Visiting Fellow, Crawford School of Public Policy, Australian National University

This article is republished from The Conversation under a Creative Commons license. Read the original article.

Read more >>

Wednesday, July 28, 2021

What’s in the CPI and what does it actually measure?

So you don’t believe the official inflation figures. Why would you? They show prices climbing at an annual rate of 1.1%

On Wednesday the update for June quarter is likely to show prices climbing at an annual rate three times as high — somewhere between 3% and 4%, which will probably be another reason you won’t believe them.

(As it happens, most of the “jump” will be because of a different starting point. The 1.1% figure reports what happened after the three months to March 2020. The update will report what’s happened since the three months to June 2020, when coronavirus restrictions triggered a plunge in petrol prices and a temporary childcare subsidy cut the price of most care to zero.)

Most of us don’t believe 1.1% or anything like it because it doesn’t accord with our experience. We see petrol prices climbing. We are presented with bills for electricity, gas and rates we find hard to pay.

But here’s the thing. As hard to believe as we find it, electricity, gas and petrol don’t cost us that much over the course of a year.

We notice petrol prices because they are displayed clearly on well-lit signs of a specified size, as is required by law. We notice electricity bills because they are large and usually arrive only four times each year.

And because we don’t like them. We pay less attention to spending we like.

Every few years the Bureau of Statistics surveys 10,000 households to determine what they spent over the course of a fortnight, and for less frequent expenses over the course of a year.

It uses what results to create a “basket” of representative goods and services, weighted according to actual expenditure.

Food accounts for the bulk of the basket — 17.3%. Alcohol accounts for another 5.3%. That’s right, 5.3%.

Compare the 5.3% of the basket we spend on alcohol to the 3.2% of it we spend on petrol, or the 3.8% on electricity and gas taken together.

Alcohol and food big ticket items

We spend almost as much on alcohol as on health, and more than on clothes.

If you reckon that’s not your household, fair enough. The basket represents the average household, as does the consumer price index (CPI) which measures the prices of the goods and services in the basket in the proportions they are in the basket.

And if your reckon you’d never admit to spending that much on alcohol, you’re also right. Alcohol and tobacco are two of the rare instances where the bureau nudges up what people report to take account of what’s actually sold.


Contrary to a widely-believed myth, the cost of housing is in the index, both in the form of rents and in the cost of building houses, rather than the cost of land (that’s regarded as an investment, as is the ownership of shares which are also not included in the index).

Most things included, though not illegal drugs

Some things aren’t the index but should be — superannuation management fees (the bureau is working on it) and recreational drugs and prostitution, which are excluded because it is “very difficult and indeed dangerous to obtain estimates of prices and expenditures, or to measure quality change”.

Quality matters. When Cadbury shrank its large blocks of chocolate from 250g to 200g a few years back and then to 180g, it wouldn’t have been right to merely record the price change.

The bureau adjusted up the recorded price to take account of the fact that people were getting less chocolate. But other changes are less straightforward. What do you do when VB reduces the strength of its beers (as it did) or the new model laptop has twice as much memory as the one it replaced?

For computers the bureau adjusts down the recorded prices of new models in line with a US formula.

For cars — which these days have features not previously dreamed of — it consults a panel of experts.

For other changes it lets improvements go through to the keeper, leaving recorded prices unadjusted even though the are getting better.

Beneath the hood, the CPI is changing

The bureau used to record prices using handheld devices in supermarkets and by ringing up suppliers and getting quotes. In the last few years it has moved to getting almost everything electronically — stores hand over data from checkout scanners, petrol stations report when prices have changed and upload sales data, and the bureau “scrapes” advertised prices from the web.

With those changes has come a revolution in what it is able to do. It used to collect prices in only a small number of representative outlets (which is why the index was limited to capital cities) and it used to record only the prices of “representative” items.

The stand-in for bread was the average price of a sliced white 650-750g loaf.

Better still, for the first time the bureau has information on how much is bought of each product at each price each quarter. This enables it make real-time adjustments to weightings in accordance with actual behaviour.

In 2011 when Cyclone Yasi destroyed banana crops in Queensland, the price of “fruit” recorded in the consumer price index surged to an unprecedented high. But the prices actually paid for fruit didn’t surge. Shoppers bought other fruits or canned fruit instead.

Next time that happens the CPI will scarcely move.

It’s making the index more of a cost of living index and less of a “cost of a fixed basket” index. It is happening for petrol too. The bureau is reporting the prices people actually pay, instead of the prices on offer.

None of this is to say that the CPI is perfect, but it would be wise to take the figure to be released on Wednesday seriously. It probably does a better job of recording changes in our cost of living than we’d do ourselves.

Peter Martin, Visiting Fellow, Crawford School of Public Policy, Australian National University

This article is republished from The Conversation under a Creative Commons license. Read the original article.
Read more >>

Wednesday, July 21, 2021

When COVID is behind us, we're going to have to pay more tax

The biggest unstated message from the intergenerational report released during the lull between lockdowns is that we will need more tax.

Not now. At the moment it’s a matter of throwing everything we’ve got at getting on top of the COVID outbreaks and worrying about how to (and the extent to which we will need to) pay for it later.

But when the economy is healthy again, taxes are going to have to rise, big time.

That the intergenerational report doesn’t say so explicitly might be because the government is sticking with its arbitrary and implausible guarantee that tax collections will never climb above 23.9% of GDP, which is the average between the introduction of the goods and services tax and the global financial crisis.

Or it might be because what’s needed sits oddly with legislated high-end tax cuts likely to cost $17 billion per year from 2024-25.

Among the drivers of increased government spending identified by the report is spending on health, at present 4.6% of gross domestic product, and on the report’s projections set to climb to 6.2% over the next 40 years.

We’ll want better health

To fund that alone the government will need to collect 6% more tax in 2061 than had spending on health stayed where it was as a proportion of GDP.

Perhaps surprisingly, most of the extra spending on health won’t be a direct result of the population ageing. It’ll be because health technologies are getting better and becoming much, much more expensive (à la the COVID vaccines). And because incomes are rising.

Rising incomes, the report explains, are the largest driver of government spending on health internationally.

That’s because for some things, including the provision of hospitals, private spending can’t cut it, no matter how well off you are.

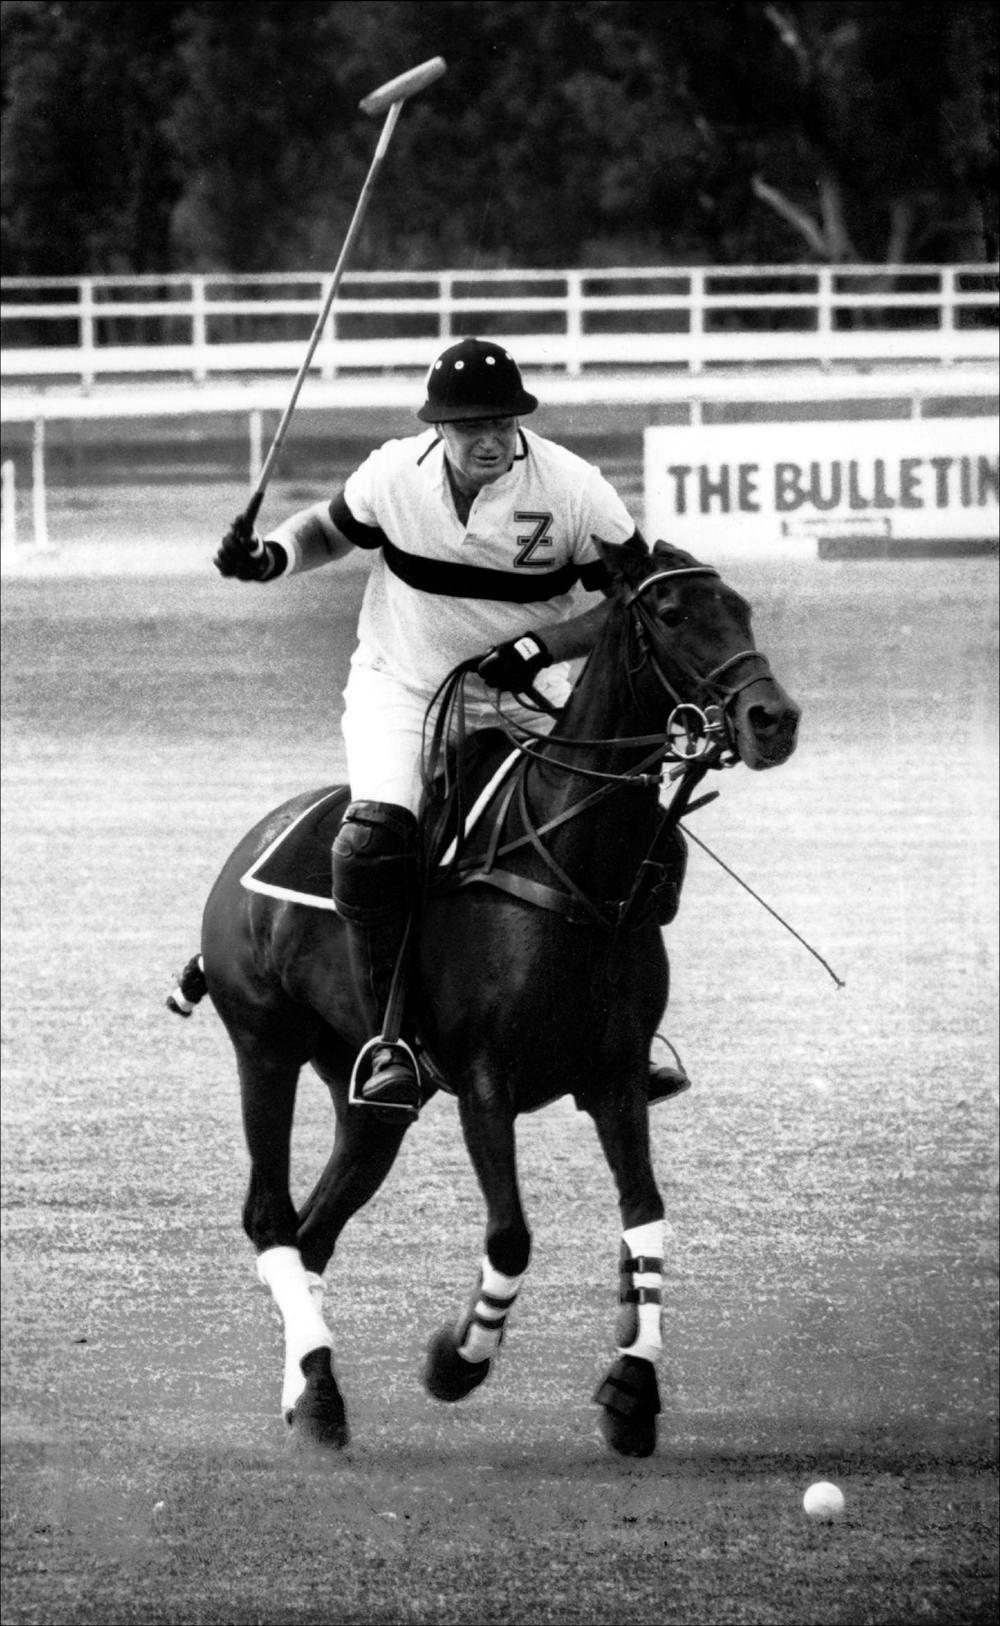
After billionaire Kerry Packer suffered a massive heart attack while playing polo in 1990, he was rushed to Sydney’s Liverpool Hospital.

When the ANU election survey began in 1990, 54% of Australians surveyed regarded health as “extremely important” in determining their vote. It’s now 70%. In 1990 11% regarded health as “not very important”. It’s now just 2%.

The intergenerational report has spending on aged care climbing from 1.2% to 2.1% of GDP, which by itself means the tax take will have to be 4% higher than otherwise, but it was prepared ahead of the government’s final response to the aged care royal commission.

The interim response had 14 (mostly expensive) recommendations subject to “further consideration”.

The National Disability Insurance Scheme already accounts for one in 20 tax dollars collected and is set to overtake Medicare.

The report says the government’s response to the royal commission into disability care presently underway is likely to place “additional pressure” on costs.

We’ll need to spend more than projected

None of this extra spending is bad if it delivers value for money, and it’s what the public wants. But it is hard to reconcile with official projections in the report showing government spending climbing only 2.5% per year in real terms over the next 40 years, compared to 3.4% per year in the past 40.


Read more: Intergenerational report to show Australia older, smaller, in debt


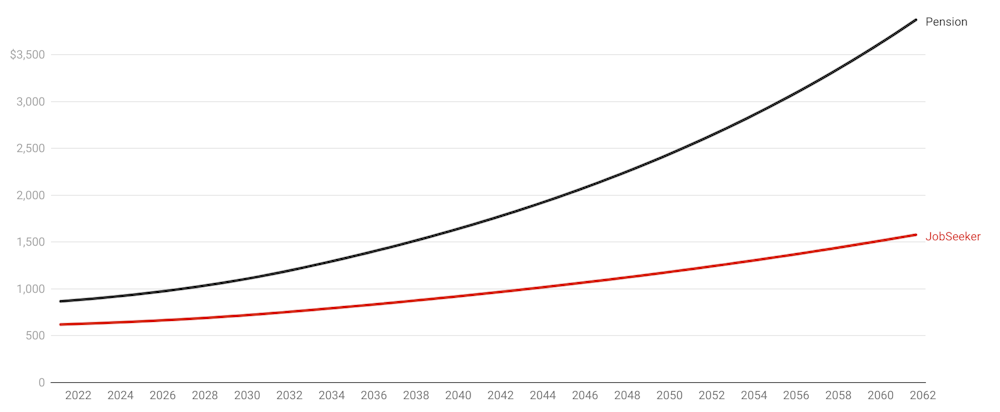
The report gets there in part by an outrageous sleight of hand. It says JobSeeker and other payments will become tiny as a proportion of GDP because they will only climb with inflation (which is typically low) rather than wage growth or GDP growth (which is typically higher, and lines up with how the pension grows).

A moment’s reflection would show that if that actually happened for 40 years — which is what the treasury’s report assumes — JobSeeker would fall from 70% of the single age pension to a hard-to-justify 40%.


JobSeeker and age pension as projected in intergenerational report

Payment for a single, dollars per fortnight. JobSeeker indexed to IGR inflation projections, pension indexed to IGR wage projections.

We know it won’t happen because it hasn’t happened.

JobSeeker was boosted this year after only 20 years rather than 40 in order to make sure that sort of thing wouldn’t happen.

And we know there’s nothing to stop an intergenerational report using more realistic assumptions.

The 2015 report, released at a time when the Abbott government planned to adjust the pension in line with the more miserly JobSeeker formula, relaxed the assumption after 13 years because if it left it in place the pension would slide untenably below community expectations.

We’ll easily be able to afford more tax

There’s nothing wrong with paying more tax if it’s for things we want, like better health care, better aged care, better disability care and benefits we can live on.

The intergenerational report has government spending climbing by four percentage points of GDP between now and 2061. But it also has real GDP per person almost doubling, climbing 80%.

Even if that’s an overestimate and GDP per person grows by, say, 50%, and the need for tax grows by more than four points, we’ll easily be able to afford the extra tax, and we’ll want what that tax will buy. Expectations climb with income.

The present government will be long gone by the time the tax to GDP ratio reaches its “cap” of 23.9% of GDP (which the report expects in 2035).

The finance minister who came up with the cap, Mathias Cormann, is now head of the Organisation for Economic Co-operation and Development, in which the average tax take is 34% of GDP.

An obvious place to look for the tax is high-income senior citizens, at present enjoying tax-free super, refundable franking credits and special tax offsets.

Grattan Institute calculations suggest an older household earning $100,000 pays less than half the tax of a working-age household on the same amount.

Like the households of less well-off seniors, those households are highly likely to use the services tax provides.

To say we’ll need more tax is not to say the government needs to fund all of its spending with tax.

It is projecting budget deficits for the next 40 years. Budgets have been in deficit for all but a few of the past 100 years.

But it will need to cover much of it with tax to keep the economy in check. If we want what tax provides, we’ll be prepared to pay it.

Peter Martin, Visiting Fellow, Crawford School of Public Policy, Australian National University

This article is republished from The Conversation under a Creative Commons license. Read the original article.

Read more >>

Saturday, July 03, 2021

The intergenerational horizon that recedes each time we approach it

On Monday, Treasurer Josh Frydenberg homed in on the real problem identified by his government’s intergenerational report – about the only real problem expounded on in the report.

It’s that by 2061 we will have far fewer people of working age for each person of traditional retirement age. Right now, Frydenberg explained, we have four people of working age for each Australian aged over 65.

Forty years ago we had 6.6. But in 40 years’ time, we will have just 2.7.

That’s a good deal fewer people to cut our hair, fix our computers, look after our needs in nursing homes.

It belongs to that unusual class of problems that money can’t fix, despite Frydenberg saying the financial implications are “sobering”.

Collecting more tax to spend on retirees or having them squirrel away more superannuation to spend in retirement isn’t going to create more people of working age.

This demographic issue exists because the large number of Australians born in the postwar baby boom are in or approaching retirement, and aren’t dying any time soon.

Four will become 2.7 whatever we do, unless we have more babies or attract more migrants and temporary workers. The only other factor would be if this generation died sooner.

The man who set up Australia’s system of five-yearly intergenerational reports and delivered the first two, the Coalition’s then treasurer Peter Costello, was fond of saying that while demographic change is slow, “demography is destiny”.

Every five years since he left office, his successors, Wayne Swan, Joe Hockey and Josh Frydenberg, have reissued the same sort of projections and graphs, and every five years they’ve sounded surprised.

Joe Hockey said Australians would “fall off their chairs” when they discovered their government wouldn’t “get anywhere near being able to reduce spending over the medium-term to the same level that exists today”, which was hardly the point.

If Australians had been paying attention, what might have surprised them more was how much less worrying the projections had become over time.

In 2007 Peter Costello said the number of working-age Australians for each Australian over 65 would shrink from five to 2.4 in 40 years’ time.

Wayne Swan’s projection, in 2010, was for the number to shrink to a less scary 2.7, and not until five years later than Costello’s warning. Hockey’s projection was less scary still – to 2.7, but a further five years out again.

Frydenberg’s projection this week was still 2.7, but a further five years out, to 2061. The demographic event horizon has receded each time we’ve approached it.

Doing the work of holding back the transition has been massive and unexpected immigration. Costello’s first intergenerational report in 2002 assumed net overseas migration of 90,000 people a year for 40 years. By 2010, net overseas migration had more than doubled to 244,000 people a year, and the intergenerational report assumed 180,000 a year for 40 years.

The 2015 report assumed 215,000 a year, and Frydenberg’s assumes 235,000 a year after borders reopen.

Migrants are young, as are temporary workers and foreign students. Eight in 10 are aged under 35 when they arrive. Although they themselves age, most bolster the working-age population for decades. Many work in nursing homes.

Ask John Piggott, director of the Centre of Excellence in Population Ageing Research at UNSW Sydney, whether this means migration is a something of a Ponzi scheme, with a continual flow of new migrants needed each year to stop the age structure collapsing, and he’ll tell you it’s the same for births. Each newly born Australian also ages, but from the time they enter the workforce they bolster the working-age population for decades to come.

And the divide between workers under 65 and retirees over 65 is losing its meaning, in part because the Rudd Labor government lifted the pension age to 67 and the Abbott government tried to lift it to 70, an idea that will doubtless be revisited.

At the time of the first intergenerational report in 2002 only 10 per cent of men and 3.5 per cent of women aged 65 and older were in paid work or making themselves available for paid work. Twenty years on, it’s close to 20 per cent and 11 per cent, proportions that grew through the coronavirus crisis.

If we really do become short of workers of traditional working age, we are likely to become more accepting of workers in their 70s. The increases in not just lifespans, but healthy lifespans, and a shift to service-sector and part-time jobs, will mean more people in their 70s will take work.

The financial problems spelled out in Frydenberg’s report are both less severe and more severe than Frydenberg acknowledged.

It says by 2060-61 healthcare will become the largest component of government spending, eclipsing social security and taking up 26 per cent of the budget. Government spending on health per person will more than double.

Yet what it also says is that most of the increase will be non-demographic – the government will spend more on healthcare for Australians of all ages, because treatments are becoming more expensive (and presumably better) and because we want them.

The report points to a budget problem. By 2061 government spending will exceed government revenue by 2.5 per cent of gross domestic product (GDP), and by 5 per cent on a less optimistic set of assumptions, but that’s only because of a self-imposed decision not to let the tax take climb.

For completely political reasons, the Coalition imposed an arbitrary cap on the tax-to-GDP ratio of 23.9 per cent of GDP a few elections back, a cap that will be reached in about 15 years.

“Some might suggest an easy way to paint a more optimistic picture of the budget position would be to remove the tax-to-GDP cap,” Frydenberg said on Monday. “But as we know, you can’t tax your way to prosperity.”

Prosperity, in the sense of being able to afford to pay increased tax, shouldn’t be much of a problem. The report says by 2061 real GDP per person is expected to be almost twice as high as it is now. We shouldn’t find it too difficult to shell out an extra few per cent of GDP in tax.

But other costs aren’t acknowledged. The report includes a chapter headed “environment” that refers to the costs of climate change and its impacts on agriculture and the resources sector, but includes not one financial measure of that impact.

The NSW intergenerational report, released just three weeks earlier, said more frequent and severe natural disasters could cost the state an extra $17 billion a year.

In the 2016 election. Labor was castigated for its failure to cost its climate change policy. Frydenberg has failed to cost the Coalition’s in 2021.

And there’s another big thing the report fails to acknowledge. Yes, the number of Australians of working age for each Australian of traditional working age will drop from four to 2.7 and yes, this will be a problem, but old people aren’t the only dependents.

Children are also dependents, and as the proportion of the population who are older dependents has been growing, the proportion who are younger dependents has been shrinking.

The total dependency ratio – the number of Australians of working age per Australian either over 65 or under 15 – was acknowledged in earlier intergenerational reports. It is unacknowledged in this one, but is expected to slip from 1.8 to 1.6 – a drop, but a less alarming drop than the aged-dependency ratio.

It’s also less alarming because we’ve been there before. During the 1960s, a time generally regarded as pretty pleasant, Australia had 1.6 people of traditional working age for each Australian either over 65 or under 16. There were a lot of children about in the 1960s but we managed to care for them.

A key difference, identified by tax and transfer specialist Miranda Stewart at the University of Melbourne, is that children are more likely to be cared for off-budget, especially off the Commonwealth’s budget, and so don’t force their way into the intergenerational report.

Much of their care is provided privately, either by the private payment of childcare fees and school fees or by parents, mainly mothers, doing it unpaid.

As with the resource costs identified in Frydenberg’s report, these resource costs are real. The point is, we’ve coped with them before.

This article was first published in the print edition of The Saturday Paper on Jul 3, 2021 as "Demography is destiny".

Read more >>

Thursday, July 01, 2021

Economy will be weak and in need of support after pandemic, say top economists in 2021-22 survey

Australia’s economy will limp along after recovering from the pandemic, failing to regain the growth it had either in the years leading up to the crisis or the much higher growth in the decades before.

That’s the consensus of the 23 leading Australian economists assembled to take part in The Conversation’s July 1 forecasting survey — a panel that includes former Treasury, Reserve Bank and International Monetary Fund officials and modellers and policy specialists from 13 Australian universities.

On balance, the panel expects year-average economic growth (the measure reported in the budget) to slide from 4% this financial year to just 2.2% by 2024-25, well below the average of 2.6% assumed in this week’s intergenerational report.

The panel forecasts much weaker business investment than does the budget and lower household spending, but higher wage growth and lower unemployment. It expects a flat share market, and slower growth in house prices.

Weaker economic growth

During the decade leading up to the COVID-19 crisis, economic growth averaged 2.6% per year. During the 27 years between the early 1990s recession and the crisis, it averaged 3.2%.

The panel’s average forecast of 2.2% by the end of the four-year budget forecasting horizon is lower than both the budget forecast of 2.5% and the 2.6% in the intergenerational report.


Economic modeller Janine Dixon expects growth of just 1.7%. She says after Australia has soaked up unemployment, its future economic growth can only be driven by population growth or improved productivity.

With population growth expected to be weak for several years, GDP growth will be weak unless dwindling productivity growth rebounds.


Read more: Intergenerational report to show Australia older, smaller and more in debt


Forecasting veteran Saul Eslake says on the other hand, for as long as borders remain closed Australia should enjoy an “artificial boost” to domestic spending of more than A$50 billion per year from Australians who can’t spend abroad.

The two most optimistic forecasts of 3% growth, from Angela Jackson and Sarah Hunter, are contingent on borders reopening and tourism and immigration restarting.


The panel expect extraordinarily strong growth in the United States of 5.2% throughout 2021 on the back of what panelist Warren Hogan calls massive government stimulus and a full-vaccination rate approaching 50%.

China’s growth is forecast to rebound to 7.9%, but will come under pressure from what panelist Mark Crosby describes as an attempt by some of China’s customers to diversify the sources of supply away from China.


Support from iron ore

The panel expects actual living standards to be higher than the bald economic growth figures suggest.

This is because high iron ore prices boost Australians’ buying power (by boosting the Australian dollar) and boost company profits in a way that isn’t fully reflected in gross domestic product.

In recent months, the spot iron ore price has been at a record US$200 a tonne, a high the budget assumes will collapse to near US$63 by April next year as supply held up in Brazil comes back online.


Read more: The four GDP graphs that show us roaring out of recession pre-lockdown


The panel is expecting the iron ore price to stay high for longer than the Treasury — for at least 18 months, ending this year near a still-high US$158 a tonne.

There’s agreement that at some point the unusually high price will fall, with one panelist saying there might be “one more year to ride this wave, then who knows”.


Because the panel expects a higher iron ore price than the government in the year ahead, it expects a greater rise in nominal gross domestic product — the measure of cash pouring into wallets. The panel forecasts an increase of 5% this financial year compared to the budget forecast of 3.5%.

But it expects consumer caution to limit growth in household spending to 4.2%, much less than the budget forecast of 5.5%.


Unemployment to fall quickly

The panel expects unemployment to fall more quickly than the government does, to 4.7% by mid-2022, a low the budget didn’t foresee until mid-2023.

The unemployment rate is already 5.1%, something the May budget didn’t expect for a year. However, it is to some extent artificially assisted because jobs that used to go to temporary foreign workers and were not counted in the employment statistics are now being taken by domestic workers who are counted.

As foreign workers return to Australia, the process will unwind, putting upward pressure on the recorded unemployment rate.


Wage growth better than budget

The May budget forecast wage growth of just 1.5% in 2021-22 (less than forecast price growth), followed by only 2.25% in 2022-23 (merely matching price growth), in part because of legislated increases in employers’ super contributions.

The forecasting panel is more optimistic for the year ahead, being able to take account of the Fair Work Commission’s 2.5% increase in award wages announced in June.


Read more: Australia's top economists oppose the next increases in compulsory super


Warren Hogan calls 2.5% the new “baseline”, with some labour shortages forcing some employers to offer more.

Even so, the panel’s average wage growth forecast for 2021-22 is 2.2%, only marginally above expected price inflation of 2.1%.


Slower home price growth

The panel expects weaker home price growth in the year ahead, with the CoreLogic Sydney price index climbing 6.4% after a year in which it soared 11.2%.

Melbourne prices should climb a further 5.2% after a year in which they gained 5%.

The panelists say much will depend on how long mortgage rates remain at their record lows, what action authorities take to restrain lending and when immigration restarts.


Low rates for some time

Over the past year, the bond rate at which the Commonwealth government can borrow for ten years has jumped from 0.9% to 1.5% in accordance with moves overseas.

The panel expects further increases to a still-low 1.8% by the end of this year and to 2.2% by the end of next year.

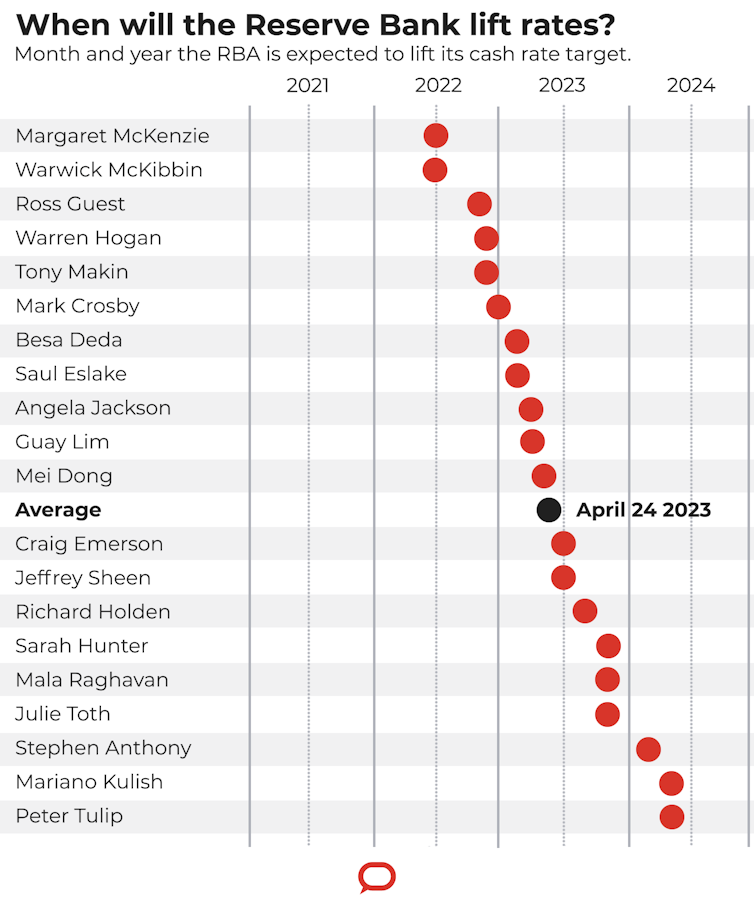
Even so, the panel expects no increase in the Reserve Bank’s cash rate — the one that drives variable mortgage rates — for almost two years, until April 2023.


Former Reserve Bank head of research Peter Tulip, now with the Centre of Independent Studies, says the bank meant it when it said it said it wouldn’t lift the record-low cash rate of 0.1% until actual inflation was “sustainably within” its 2-3% target range, something that wasn’t likely until 2024.

Other panelists, including economic modeller Warwick McKibbin, believe those criteria might be met sooner, some as soon as mid-2022.


The Conversation, CC BY-ND

No take-off in investment

The panel doesn’t buy the government’s bold prediction of a jump in non-mining business investment in response to budget tax measures.

The budget predicts year-on-year growth of 12.5% in 2022-23 after 1.5% in 2021-22.

Instead, the panel predicts 3.7% in 2021-22 and 5.8% in 2022-23, citing low population growth and the likelihood that most investment that could have been brought forward by tax measures has already been brought forward.


Read more: Bounce-back in investment holds open possibility of good news


Former IMF official Tony Makin also points to the relatively high tax rates facing foreign investors and the increasingly restrictive approach of the Foreign Investment Review Board.

Other panelists cite lack of clarity about the rules governing investment in renewable energy and growing shortages of labour and materials as reasons to expect only restrained growth in business investment.


Markets steady

On balance, the panel expects the US-Australia exchange rate to stay where it is at around 76 US cents as it has for years, noting that much will depend on the iron ore price and the strength of the US economy.

On average, it expects no change in the Australian share market after 12 months in which the ASX200 has soared 24%.

The average hides sharp differences. Some panelists expect the ASX200 to climb a further 10%, while others expect it to fall 10%. One panelist, economic modeller Stephen Anthony, expects a collapse of 55%, saying it “smells like a blood bath is coming”.


Deficits forevermore

This year’s budget forecast is for a deficit of 5% of GDP after last year’s near-record 7.8% of GDP.

Asked at what point over the next four decades the budget deficit would shrink to 1% of GDP, three panelists replied “never”.

Six others said not before 2030. Only four nominated the decade ahead.


Read more: Intergenerational report to show Australia older, smaller and more in debt


Angela Jackson said any improvements in the budget position delivered by a better-than-expected iron ore price would be spent.

Saul Eslake saw no appetite for either the tax increases or spending cuts that would be needed to eliminate the deficit, adding that, fortunately, there was no “urgent requirement to do so”.


Unexpected times

Forecasts often don’t come to pass. This time last year, mid-pandemic in a rapidly evolving situation, the panel forecast unemployment of 8.8%, no share market growth and ultra-low wage growth of just 0.9%.

That these things didn’t happen was in part due to the role of such forecasts in persuading the government to respond in an unprecedented fashion, a point made by Treasurer Josh Frydenberg launching the intergenerational report on Monday.


Read more: No big bounce: 2020-21 economic survey points to a weak recovery getting weaker, amid declining living standards


This year’s forecasts, prepared in a less-hectic environment, might have more staying power. They point to a weak recovery and an economy reliant on government support for some time to come.


Participants

PDF OF RESULTS

Peter Martin, Visiting Fellow, Crawford School of Public Policy, Australian National University

This article is republished from The Conversation under a Creative Commons license. Read the original article.

Read more >>