Thursday, April 29, 2021

Exclusive. Top economists back budget push for an unemployment rate beginning with ‘4’

Australia’s top economists have overwhelmingly backed a decision by Treasurer Josh Frydenberg to reset the budget strategy so that it prioritises achieving an unemployment rate of between 4% and 5% over reducing debt.

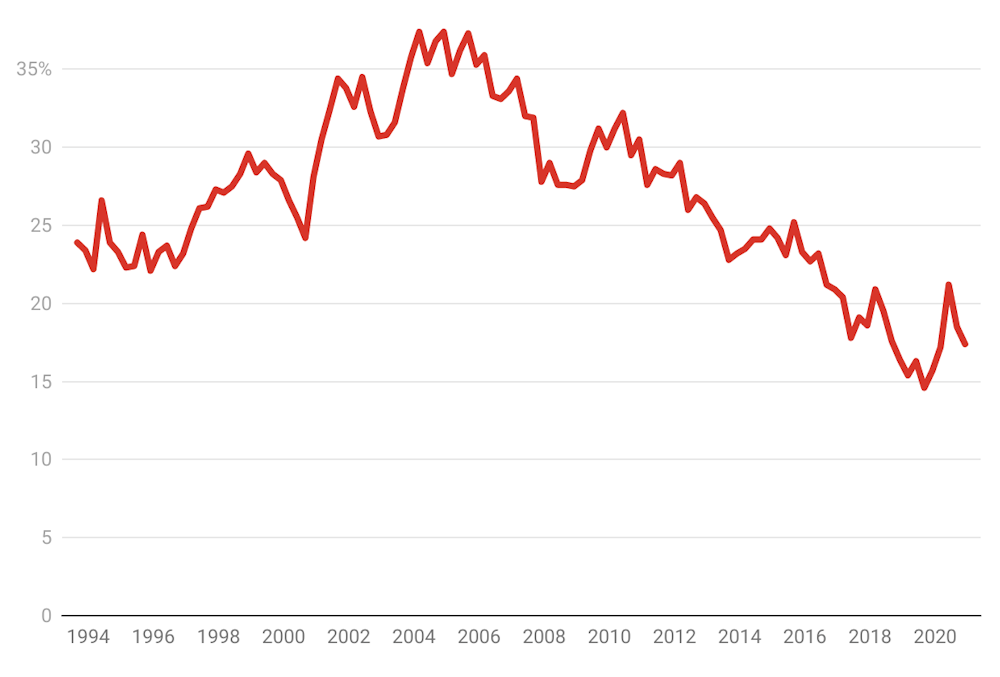
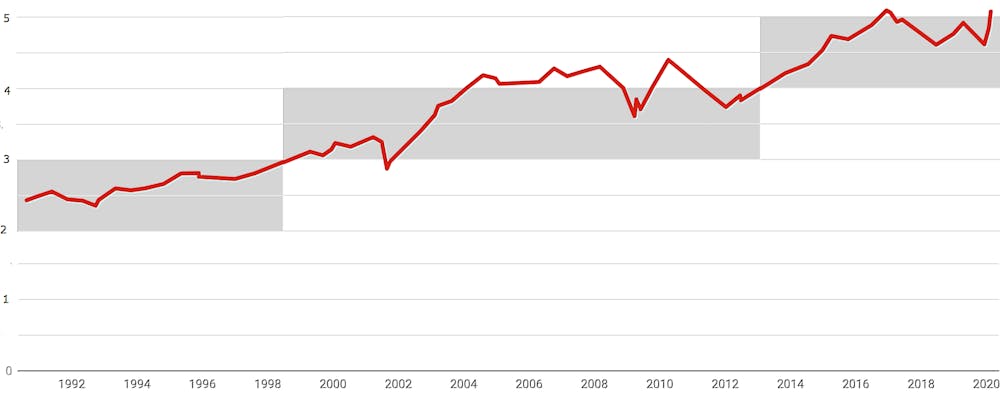
Australia hasn’t had an unemployment rate below 5% since 2011.

It hasn’t had an unemployment rate below 4% since the early 1970s.


Unemployment rate, per cent
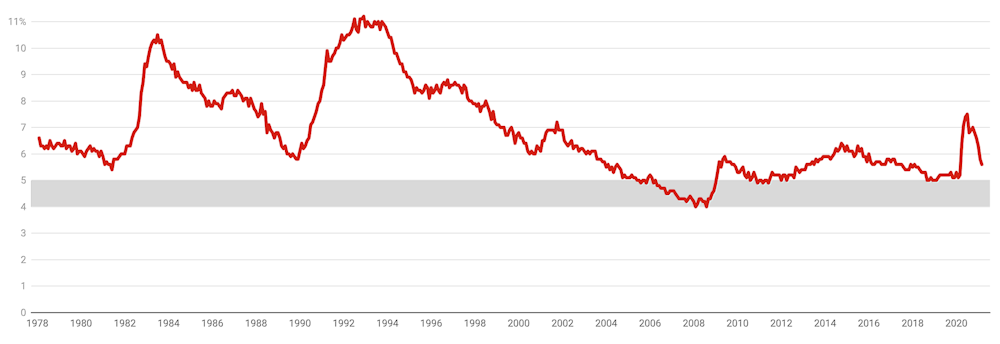
ABS labour force survey

The new wording of the fiscal strategy required in the budget as part of the Charter of Budget Honesty will commit the government to quickly drive down unemployment until the unemployment rate is between 4% and 5%.

Only when the unemployment rate is sustainably within that band will the strategy switch to a focus on reducing government debt as a share of GDP.


Read more: Josh Frydenberg has the opportunity to transform Australia, permanently lowering unemployment


The existing wording, introduced in last year’s budget in response to the COVID crisis, only commits the government to drive down unemployment until the rate is “comfortably below 6%”.

Treasurer Frydenberg spelled out the new strategy in an address to the Australian Chamber of Commerce and Industry on Thursday saying both the treasury and the Reserve Bank now believed the so-called non-accelerating inflation rate of unemployment was lower than 5%.

“In effect, both the bank and treasury’s best estimate is that the unemployment rate will now need to have a four in front of it,” he said.

Like it was under Menzies

The Reserve Bank was limited in its ability to cut interest rates further, meaning greater weight would have to be placed on the budget to bring unemployment down to between 4% and 5%.

The exact wording of the new strategy will be unveiled on budget night, May 11.

The increased ambition means the government plans to usher in an era of sustained low unemployment not seen since the prime ministerships of Robert Menzies, Harold Hold, John Gorton and William McMahon.

Backed by 6 in 10 leading economists

Of the 60 leading Australian economists surveyed by the Economic Society of Australia and The Conversation ahead of the announcement, more than 60% wanted the target strengthened to an unemployment rate below 5%.

Some 21% (13 of the 60 surveyed) want the target strengthened to an unemployment rate below 4%.

Five want the target strengthened to an unemployment rate below 3%.
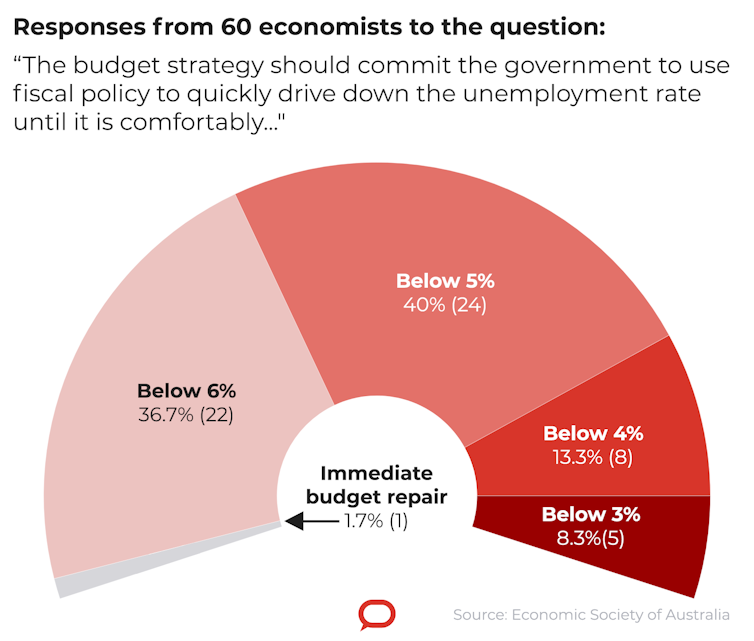

The Conversation, CC BY-ND

Only one of the 60 top economists surveyed wanted an immediate tightening of the budget regardless of the unemployment rate.

Tony Makin, a former International Monetary Fund and treasury economist who was critical of Australia’s stimulus program during the global financial crisis says the present ultra-low interest rate settings are more than enough to drive unemployment as low as it can get without stoking runaway inflation.

He says the extra government debt that would be created by a push for even lower unemployment would put Australia’s credit rating at risk and push up interest rates and the Australian dollar, making Australian exports less competitive.

‘Unusual opportunity’

The economists chosen by the Economic Society to take part in the survey are recognised leaders in fields including microeconomics, macroeconomics, economic modelling and public policy.

Among them are former and current government advisers, former heads of government departments and agencies, and a former member of the Reserve Bank board.

Labour market specialist Sue Richardson said Australia faced an unusual opportunity to test how low unemployment can go before a tight labour market produces unacceptable stresses.

US unemployment got down to 3.5%

The combination of reduced temporary migration, very low inflation and inflation expectations and a relaxation in the focus on containing the size of government debt made this a rare moment.

Consultant Nicki Hutley said if the experience of the United States before COVID was any guide, Australia might be able to get its unemployment rate down to 3.5% without stoking accelerating inflation.

With interest rates at such low levels, investing in Australia’s economic future could not be a better decision.

Taking pressure off the Reserve Bank

Economist Saul Eslake said it wasn’t unreasonable for the treasurer to have proposed a threshold of an unemployment rate “comfortably below 6%” before beginning budget repair last year, given that at that time the conventional wisdom was that unemployment was headed to 10%.

But now both the Treasury and the Reserve Bank have made it clear unemployment can be forced lower without stoking inflation, “four point something” is realistic.

Inflation figures released on Wednesday showed one of the most reliable measures of inflation, known as the “trimed mean”, at an all-time low.


Read more: Jobs for men have barely grown since the COVID recession. What matters now is what we do about it


Another reason for the government to delay winding back debt was that it would give the Reserve Bank an opportunity to lift interest rates sooner, giving it greater ability to cut interest rates to fight downturns in the future.

A report released by the Parliamentary Budget Office on Wednesday said reducing the government’s debt-to-GDP ratio to pre-pandemic levels would take decades, “even under relatively optimistic scenarios”.

But it added that debt servicing costs should remain subdued as the existing debt was borrowed at historically low interest rates.


Read more: Should the government keep running up debt to get us out of the crisis? Overwhelmingly, economists say yes


Macquarie University’s Geoffrey Kingston said it was the wrong time to be thinking about either an unemployment or a debt target. What mattered, this year more than most, was the composition of government spending.

This meant better supplies of the Pfizer and Moderna vaccines, more facilities for mass vaccinations and safer quarantine.

Peripheral programs such as subsidising airfares to holiday destinations at a time when it remained imprudent to encourage air travel were much less important — even if they helped fight unemployment.


Peter Martin, Visiting Fellow, Crawford School of Public Policy, Australian National University

This article is republished from The Conversation under a Creative Commons license. Read the original article.

Read more >>

Tuesday, April 27, 2021

Why productivity growth has stalled since 2005 (and isn’t about to improve soon)

Not long ago it seemed as if the future was going to get better and better — not long ago at all.

For me the high point was around 2005, fifteen years ago.

I don’t know if you can remember how you felt at the time, but for me the surge in living standards, driven by an ever-building surge in output per working hour (“productivity”) suggested things were building on themselves: each new innovation was making use of the ones that had come before to the point where….

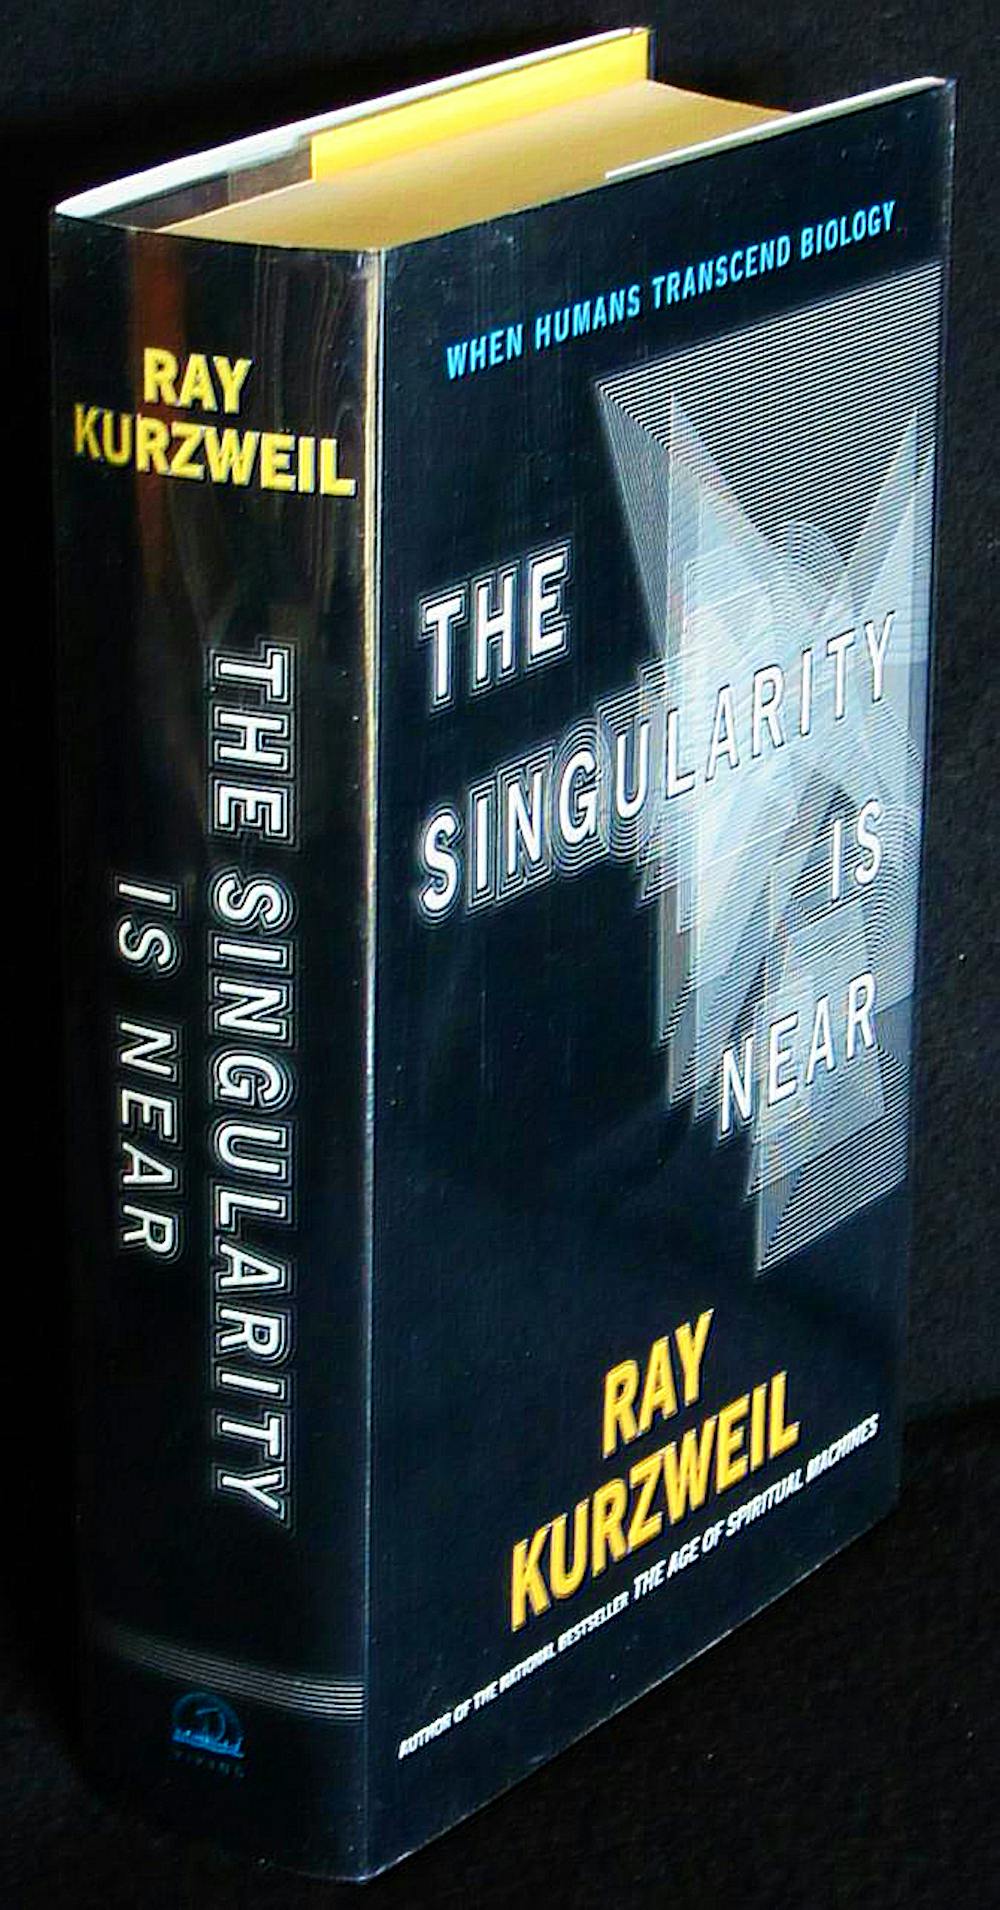
Ray Kurzweil, now the director of research at Google, summed it up in a book released in 2005 itself, titled The Singularity Is Near.

Singularity was “a future period during which the pace of technological change will be so rapid, its impact so deep, that human life will be irreversibly transformed”.

Changes would build on each other to the point where everything changed at once.

Kurzweil dubbed it the “law of accelerating returns”.

Year by year in the leadup to 2005, Australia’s productivity growth had accelerated to the point where in the 15 years to 2005 it had grown 37%.

If it kept accelerating…

In the 1930s economist John Maynard Keynes foresaw “ever larger and larger classes and groups of people from whom problems of economic necessity have been practically removed”. On average the working week might fall to 15 hours.

In the 1970s, futurologist Alvin Toffler spoke of a four-hour working day.

And then from 2005 on productivity growth collapsed. In the 15 years since, Australia’s output per working hour (productivity) has grown by just 17%.

Thirty seven per cent turned out to be the high point.


Long-run productivity growth, Australia

Growth in GDP per hour worked over the previous 15 years. ABS

And not only here. In the United States and other developed economies productivity growth is divided into “before 2005” when it was rapid, and “after 2005” when it collapsed.

2005 is when Apple got serious about developing the iPhone. It was when many of our technological innovations really did start building on themselves.

2005 is when things were meant to take off

In his impressive book The Rise and Fall of American Growth economist Robert Gordon rightly points out that things like the iPhone are nothing like as genuinely useful as the innovations in the leadup to the 1940s.

Gordon says not a single urban home was wired for electricity in 1880, but by 1940 nearly 100% had mains power, 94% had clean piped water, 80% had flush toilets and 56% had refrigerators.

He says whereas as all of us could quite happily travel back in time 60 years from today and enjoy a recognisable lifestyle, we couldn’t have done it if we travelled back 60 years from the 1940s.

Instead, they stagnated

It’s as if the innovation we’ve had has been less useful. As if, in the words of PayPal founder Peter Thiel, “we wanted flying cars, instead we got 140 characters”.

Or it might be that the things we do these days are harder to automate.

A century ago roughly half the Australian workforce worked in service jobs — doing things such as hairdressing and writing reports. Today it’s 80%.

Back then, 45% of us worked in farming or manufacturing. Today it’s not even 10%

Services such as hairdressing, nursing and aged care are about as productive as they will ever be. It’s possible to cut hair or consult patients faster, but what’s lost is the time and personal attention spent doing it, which is part of the service.

We might be reaching hard limits

If productivity is output (the service) per unit of input (time spent), it doesn’t make sense to measure it where much of the output is the input.

That’s one of the reasons the Bureau of Statistics provides measures of what it calls multi-factor productivity for industries such as agriculture and mining, but not for “health and social assistance” which is Australia’s biggest employer.

The Bureau is working on a measure for health, but it thinks it will have to use as the output changed life expectancy or surveys of patient “satisfaction” with their treatment.


Read more: Have we just stumbled on the biggest productivity increase of the century?


In the US as many as 30% of workers now work in “persuasive industries” including advertising, public relations and the law.

It is almost impossible to measure their output — is it success in persuading people to change their minds?

For public servants and writers it is possible to measure output in terms of words produced, but deeply unhelpful. It is far from certain these workers would be more productive if they worked faster.

Technology might even be sending us backwards

Which is a way of saying that we might be coming up against hard limits in the amount we can squeeze out of each hour of paid work. Or perhaps not. The Singularity promises us robots that can talk to dementia patients and bots that can write political news.

And the application of technology might even be sending productivity backwards.

British economics writer Tim Harford points out that what drove the really big advances in productivity in manufacturing was specialisation.

The father of capitalist economics Adam Smith famously observed that a pin factory employing 10 specialists could produce 48,000 pins a day.

An individual who did all of those jobs working without specialised equipment could scarcely “with his utmost industry, make one pin in a day, and certainly could not make twenty”.

Harford says technology is turning us into generalists.

“Computers have made it easier to create and circulate messages, to book travel, to design web pages,” he says. “Instead of increasing productivity, these tools tempt highly skilled, highly paid people to noodle around making bad slides.”

It’ll matter for living standards

I could say worse about smartphones and the 140 (now 280) characters in Twitter.

They might be taking away more from our work-day output than they add to it.

This failure of ever increasing amounts of technology to do anything like what was expected matters because productivity growth is what we were counting on to drive economic growth and the ability of future generations to support increasing numbers of retirees.

Over four intergenerational reports the government has revised down its estimates of productivity growth and the size of the economy in four decades time. The next five-yearly report is due later this year.

Peter Martin, Visiting Fellow, Crawford School of Public Policy, Australian National University

This article is republished from The Conversation under a Creative Commons license. Read the original article.
Read more >>

Wednesday, April 21, 2021

Jobs for men have barely grown since the COVID recession. What matters now is what we do about it

Of all the weak targets ever adopted by Australian governments, one of the weakest has to have been an unemployment rate “comfortably below six per cent” in last year’s budget.

At the time the budget was delivered on October 6, the published unemployment rate had already fallen to 6.8%.

“Comfortably below six per cent” mattered because it formed part of the “fiscal strategy” required in each year’s budget as part of the Charter of Budget Honesty.

The strategy sets out the circumstances in which the government will tighten or loosen its purse strings.

The October 2020 strategy had two phases. The first required loose purse strings in order to “quickly drive down the unemployment rate”.

It would remain in place until the unemployment rate was comfortably below 6%. In the second phase the government would “shift its focus towards stabilising and then reducing debt as a share of the economy”.

The budget jobs target is comfortably weak

On the very harshest reading, the strategy requires Treasurer Josh Frydenberg to start winding back support for the economy when the unemployment rate falls to comfortably below 6%, as it arguably already has — last week’s reading was 5.6% and heading down.

But that’s probably too harsh. The words “comfortably below” might mean “way below”, and the figure of 6% mightn’t have meant much at all.

As the pandemic gathered pace the treasury was predicting an unemployment rate of 15% - the worst since the Great Depression.

It might have picked 6% as a pseudo target merely because it was something to aim for, and it might not have put much store in what was at the time a one-off result of 5.8% because unemployment rates can bounce around.

We’re about to get an update

Frydenberg says he’ll update the target in a speech to be delivered soon.

Disturbingly, he has defined the present strategy of comfortably below 6% as meaning “around 5.25% or around 5.5%”, which is pretty close to where we are. If he wants to go further, he’ll have to adopt a more ambitious target.

The difference between 6% and 5% is 138,000 unemployed Australians. The difference between 6% and 4% is 277,000 unemployed Australians.


Read more: Josh Frydenberg has the opportunity to transform Australia, permanently lowering unemployment


That’s an extra 138,000 to 277,000 Australians working for us and paying tax; and 138,000 to 277,000 fewer people claiming JobSeeker.

The Reserve Bank governor believes Australia can “achieve and sustain an unemployment rate in the low 4s”.

A good target would approach 4%

The governor makes the point that over the past decade, the estimate of the unemployment rate associated with full employment has been “repeatedly lowered”. The target Frydenberg adopts will tell us a lot.

Because it’s been a year since COVID-19 took off in Australia, it’s possible to get an idea of who’s suffered the most in terms of jobs by comparing March 2021 with March 2020.

The broad-brush Australian Bureau of Statistics labour force survey turns up the surprising result that, in terms of jobs, women have done better than men.

So far, the recovery has been pink-tinged

It’s a surprising outcome because of what was said midway through last year about a pink-tinged recession.

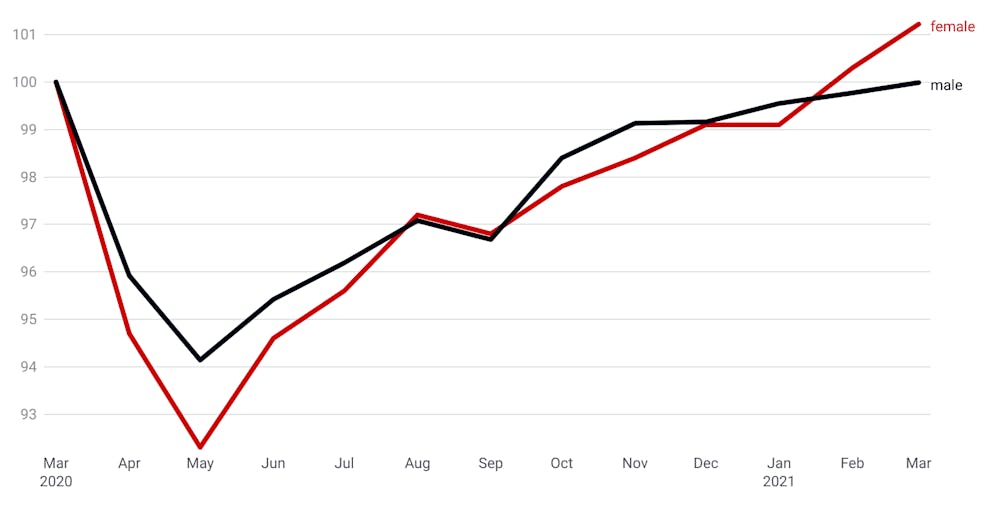
At the time women had indeed suffered more than men. In May, in the depths of the downturn, women were down 471,000 jobs and men down 401,000. But from then on, as things improved, the gap narrowed.

By August women were no worse off than men. By March this year women were 74,940 jobs better off than before the recession, men 650 jobs worse off.


Male versus female employment, March 2020 to March 2021

Index numbers, March 2020 = 100. ABS Labour Force, Australia

For full-time jobs, the divide is starker. Men are 47,420 full-time jobs worse off, and women 44,870 full-time jobs better off.

We can get much more detail (than ever before) by examining the newly available payroll data extracted from real-time records of more than 10 million Australians, as opposed to the answers of the 50,000 who take part in the labour force survey.

Women have proved more adaptable

Amongst women, the biggest gains are in the “public administration and safety” industries, where the number of women employed is 13% higher than before the pandemic.

The biggest losses for women are in “accommodation and food services” (which means hospitality and tourism) where female employment remains down 14% on the start of the pandemic.

For men, the biggest — although much smaller — gains have also been in “public administration and safety”, where male employment is up 8% since the start of the pandemic, and in “financial and insurance services”, where male employment is up 6%.

For men, employment in “accommodation and food services” remains down 15%.

The data paint a picture of women being more adaptable than men — having suffered worse than men in the early months of the recession and then refashioning themselves into different types of workers.

Among women it is only the youngest ten-year age bands that remain worse off.

Every age band above the age of 30 is ahead.


Read more: The successor to JobKeeper can't do its job. We'll need JobMaker II


For men the damage is more widespread, and perhaps longer lasting. Only in the age bands above 50 are men better rather than worse off.

There’s an awful lot we need to do, and we have discovered during the pandemic we are more than capable of doing it.

We’ll know soon whether the government’s ambition is high or low.

Peter Martin, Visiting Fellow, Crawford School of Public Policy, Australian National University

This article is republished from The Conversation under a Creative Commons license. Read the original article.
Read more >>

Wednesday, April 14, 2021

Home prices are climbing alright, but not for the reason you might think

It’s tempting to think home prices are soaring because there aren’t enough homes.

But that can’t explain the sudden takeoff from about the year 2000, the sudden takeoff from about 2013, and again now – against expectations – the stratospheric takeoff in the wake of the COVID recession.

Broadly, we’ve enough homes. The 2016 census found we had 12% more dwellings than households, up from 10% in 2001.

That’s 12% of our houses and apartments empty – used as holiday homes and second homes, or waiting for tenants.

If there really weren’t enough homes for people who wanted them, it would be more than property prices soaring; it would be rents.

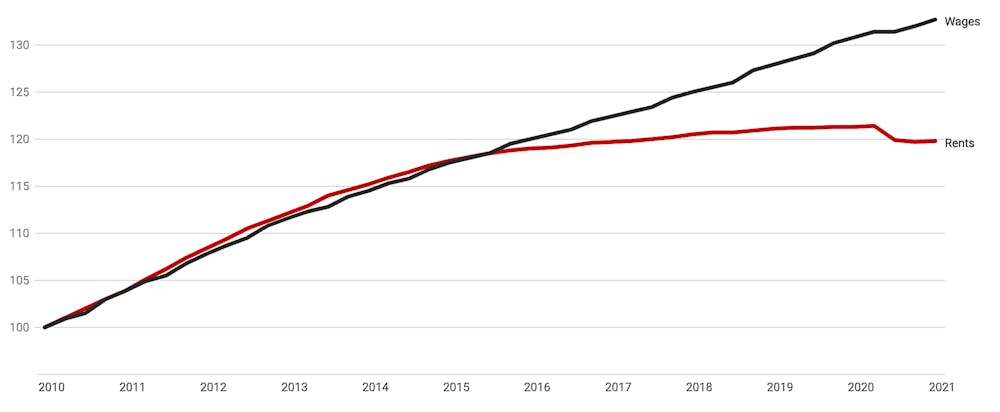
Instead, overall rents have been barely moving – growing even more slowly than wages – for half a decade.


Rent price index versus wage price index

December 2009 = 100. ABS Wage Price Index, Rent Price index from Consumer Price Index

For the half-decade from 2016, a half-decade in which Australia’s population grew by more than one million, Australian rents barely moved.

The supply of places to live in has kept pace with the demand for places to live in, but the supply of places to own has not.

More landlords, more tenants

If that sounds odd, remember people want to own houses for reasons other than living in.

Since about the year 2000, big numbers of Australians (and foreigners) have wanted to buy them to rent them out. They’ve wanted to become landlords.


Read more: Rents, not prices, are best to assess housing supply and demand


Twenty years ago only one in 15 of us were landlords. It’s now one in ten – more than two million of us.

To get those properties (other than where they’ve built them) they’ve had to outbid at auction the people who would have bought them to live in.

They’ve been helping create their own tenants, while pushing up prices.

We’re chipping away at Menzies’ legacy

From when Robert Menzies stepped down as prime minister in 1966 until the end of the 20th century, about 71% of Australian households owned the home they lived in – one of the highest rates in the world.

Since about 2000, owner-occupation has been sliding. The latest figures (themselves some years old) put it at 66%.

Among those aged 35 to 44, it has fallen to 63%

Over that time the cost of buying a home has shot up from two to three years’ household after-tax income to three to four years’ income.


Housing prices as proportion of household disposable income

Household disposable income after tax, before the deduction of interest payments, including income of unincorporated enterprises. Core Logic, ABS, RBA

What appeared to set things off was a decision by Prime Minister John Howard in 1999 to halve the headline rate of capital gains tax. Not that the committee he asked to investigate the idea recognised the possibility at the time.

The Ralph Review recommended that half, rather than all, of each capital gain be taxed, rather than the portion above inflation as had been the case since capital gains were first taxed.

The rationale was that this would “encourage a greater level of investment, particularly in innovative, high growth companies”.

A rush into property rather than high-tech companies

The review was right about the change encouraging investment, but wrong about the sort of investment.

Rather than buy shares in innovative companies, Australians bought rental properties like they never had before.

If they bid enough, they could borrow enough to negatively gear; to make sure their interest charges exceeded their income from rent, giving them annual losses they could offset against wages that would otherwise be taxed at high rates.


Read more: When houses earn more than jobs: how we lost control of Australian house prices and how to get it back


There was nothing new about negative gearing. It had been permitted from the beginning. What was new was the opportunity to later sell the property at a profit, knowing only half of the profit would be taxed.

Investors could offset all of their losses and be taxed only half their eventual gain.

Pretty soon, more than a third of the money lent for housing each month went to landlords. For several dizzying months during 2015 it was 45%. First home buyers struggled to compete.

In 2016 then treasurer Scott Morrison raised the prospect of winding things back, saying negative gearing had led to “excesses”.

APRA cleared up what our leaders could not

Labor went to two elections promising to do just that and the Coalition came out in support of the practice in public.

Behind the scenes, the Australian Prudential Regulation Authority was using its power over lenders to force lending to landlords down, getting it down ahead of COVID to 27% of new housing loans.

APRA succeeded in taking the pressure off prices where politicians couldn’t.

But that’s far from the whole story. There are other more deep-seated reasons why house prices are climbing, and they too have little to do with demand for accommodation.


Read more: Zoning isn’t to blame for Australia’s soaring house prices


Prices took off again from about 2014, shifting up from three to four years’ household income to between four and five years. That time it was Australians getting richer after years of mining booms and being able to borrow more cheaply.

Houses in general mightn’t be a good investment (there being a regularly increasing supply) but houses in prime positions were in fixed supply, there being only so many good locations.

And then it fed on itself. The father of modern economics John Maynard Keynes described investing as a game in which the best strategy is not to put money into what you think is worthwhile, but to put money into what you think other people will think is worthwhile.

It’s happening again

He spoke of a third degree, where “we devote our intelligences to anticipating what average opinion expects the average opinion to be”, and added there might be fourth, fifth and higher degrees.

It’s happening again. With mortgage rates at new extreme lows and wealthier Australians having come out of the crisis with their wealth intact, it makes sense to do what others are doing and push up prices to buy before others push them up further.

It’s nothing to do with a shortage of housing, but for many it will push home prices further out of reach. That’s because in Australia housing is two things: accommodation and a form of speculation.

Peter Martin Saturday AM with Linda Motram April 17 2021.

Peter Martin, Visiting Fellow, Crawford School of Public Policy, Australian National University

This article is republished from The Conversation under a Creative Commons license. Read the original article.
Read more >>

Wednesday, April 07, 2021

The paradox of going contactless is that we’re more in love with cash than ever

In the first two months of the pandemic, cash withdrawals from automatic teller machines halved. Even now they are down 20%.

So little-used were the main notes traditionally used for small transactions – $5 and $10 notes – that authorities stopped issuing them in the first half of 2020.

The amount of cash banked by retailers dropped by a third between February and May, and according to a new Reserve Bank study is still much lower than it was.

Only 23% of Australians surveyed in October said they had used cash for their most recent face-to-face purchase, down from more than 30% before.

Of those who said they avoided using cash, 28% said it was unhygienic; 45% had come across a business that wouldn’t take it.

The bank estimates only 4% of businesses refused to accept cash outright, although many more did what they could to discourage it.


ATM cash withdrawals using debit cards

Monthly, seasonally adjusted. Reserve Bank of Australia

Cafes and pubs offered contact-free ordering via QR codes, shops were given permission to lift the PayWave limit for transactions without a PIN, and banks were given permission to mail out cards to customers who didn’t ask for them.

One in five of us holds no cash

If the switch away from using cash seems like something we took in our stride, it’s because we’ve been slinking away from it for years.

Contactless card transactions accounted for a record 50% of in-person sales in 2019, up from 10% in 2013. More than one in five Australians reported they held no cash in their purses and wallets in 2019, up from one in ten in 2013.

An even bigger 40% said they held no cash outside their wallets.

Toll roads haven’t accepted cash for years. Transport cards such as Myki, Opal and MyWay have grown to the point where they account for 2% of all transactions. Now 5% of face-to-face transactions are done with mobile phones.

The “threshold” below which cash remains the most common means of payment has been falling for decades. In 2019 it was just $4, down from $41 in 2007.

It means you would be entitled to think (and entitled to be certain) that we are falling out of love with cash. We need it less than ever.

Yet bizarrely (and this is something even the experts can’t make sense of) we are amassing more of it than ever, even more so during the pandemic.

Yet in aggregate, we are holding more than ever

The value of cash out there somewhere (notes issued in excess of those returned) soared 17% during 2020. In each of the previous ten years, while our use of cash dwindled, our holdings climbed by an average of 5%.

So big was demand for cash during the pandemic that the Reserve Bank opened its “contingency” distribution site twice, in March and in July, to get $50 and $100 notes out to banks being asked for them. At the same time the banks held back on returning poor-quality notes in case they needed them.


Read more: Depending on who you are, the benefits of a cashless society are overrated


The paradox is that while many of us are holding absolutely no cash, and many more are holding none outside of their pockets, some are holding bewilderingly large and growing amounts, which they fortified during the recession.

When asked, only one in 200 owns up to holding more than $5,000 in cash, but the amounts some of those people are holding must be staggering.

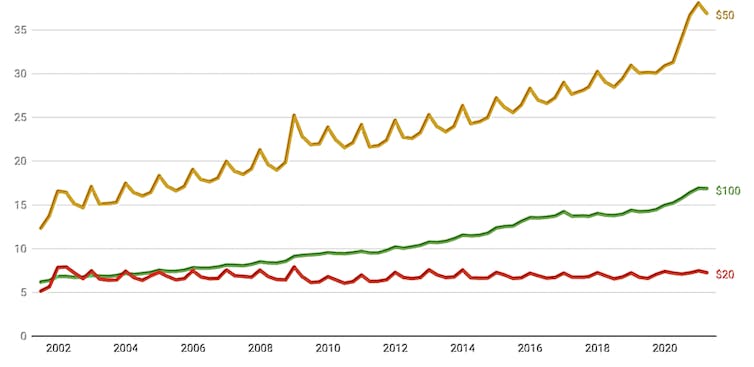
The latest figures show there were 186 million $20 notes out there in circulation at the end of March — about seven for each woman, man and child in the country.

A clutch of 20s, far more 50s and 100s

The count of $20 notes seems about right. Some are in tills, some in wallets.

But for $50 notes (the ones many of us don’t hold as often) there are an improbable 37 per person in circulation — 947 million. For $100 notes – the ones some of us never see – it is 17 per person.

There are far more $50 and $100 notes than there used to be. Twenty years ago we had just six $100 notes per person, alongside about as many $20 notes as now.

Our neighbour across the Tasman Sea is like we used to be. New Zealand still has only five $100 notes per person in circulation.

For Australia, “circulation” is scarcely the right word.

Our high-value notes are exchanged so rarely the Reserve Bank’s best guess is that, on average, each $100 note will last 200 years before being returned damaged or worn out; $20 notes are returned every eight years.

Banknotes in circulation per person

So big is the mystery about where all the notes are that the Reserve Bank has published a study, Where’s the Money? An Investigation into the Whereabouts and Uses of Australian Banknotes.

Crime, tax and means tests

It finds 5-10% are lost. It gets the estimate from the number of paper notes that were never converted to plastic when we switched over in the 1990s.

Up to 15% are kept overseas. The RBA can tell by the way demand for notes changes with the value of the Australian dollar.

Only a few percent are used to store the proceeds of crime. Criminals “convert a large share of their cash profits into other assets”.


Read more: Limiting cash to $10,000 is more dangerous than you might think


Interestingly, where criminals do store cash, the chemical residues left at the site of drug busts suggests it is as $50 rather than $100 notes.

The rest is hoarding, both in case something goes wrong with the banking system (which explains the spike during COVID) and what appears to be an especially Australian desire to avoid tax and things such as the age pension assets test.

New Zealand doesn’t have a pension assets test.

Peter Martin, Visiting Fellow, Crawford School of Public Policy, Australian National University

This article is republished from The Conversation under a Creative Commons license. Read the original article.
Read more >>

Wednesday, March 31, 2021

The true cost of the government’s changes to JobSeeker is incalculable. It’s as if it didn’t learn from Robodebt

Poor people are different to rich people, and not only in the amount of money they’ve got. They are also different in something that flows from it.

It’s (lack of) ease. And the consequences can be severe.

Economist Sendhil Mullainathan and psychologist Eldar Shafir outline these in their book Scarcity: Why Having So Little Means So Much.

They asked shoppers at a New Jersey mall to take part in a so-called fluid intelligence test. Fluid intelligence is problem-solving ability unrelated to language or knowledge.

The test is usually presented as a series of eight images, each different from the one before, followed by an invitation to guess the ninth.


What’s in the missing box?

Raven’s Progressive Matrices test. LifeofRiley/Wikipedia. CC BY-SA 3.0

It’s usually pretty easy. And it was indeed easy for the first half of the shoppers they tested. Comparing the scores against self-reported income, the researchers found no significant differences – “the rich and poor looked equally smart”.

Just before they presented the first half of shoppers with the test, they also presented a hypothetical scenario:

Imagine that your car has some trouble, which requires a $300 service. Your auto insurance will cover half the cost. You need to decide whether to go ahead and get the car fixed, or take a chance and hope that it lasts for a while longer. How would you go about making such a decision?

For the second half of shoppers they presented the same scenario with just one change. Instead of the car service costing $300, it cost $3,000.

The one simple change had a remarkable effect on the test results of just one group of shoppers – those on low incomes. Although completely fictional, the scenario got them thinking about how they couldn’t afford a $3,000 bill from out of the blue. They mightn’t know where to find the money.


Read more: What happens when you free unemployed Australians from 'mutual obligations' and boost their benefits? We just found out


Instead of performing as well as the high earners (which low earners had done without the $3,000 prompt) they did dramatically worse. Their mental impairment was as bad as if they had lost an entire night’s sleep.

Stress is costly when ends can’t meet

The researchers have replicated the results time and time again. Even when they pay for correct answers (which might be expected to incentivise low earners more than high earners) low earners can’t concentrate enough to do well.

The authors’ conclusion is that it is incumbent on authorities not to send such people over the edge – not to make them fill in multi-page forms or reapply for assistance or attend recurring pointless meetings, and not to send them unexplained unpayable bills out of the blue – not to do anything that will remind them of how their finances don’t really allow them to cope.


Read more: The bad bits of ParentsNext just came back


When that happens, when what Mullainathan and Shafir call mental bandwidth is flooded, it is hard to think properly about things such as caring for children and getting work.

Australia’s treasury gets it. Its well-being framework sets out five points it believes should be considered in designing programs and policies. Point five is the cost to individuals of “dealing with unwanted complexity”.

Not so treasury’s political masters. When on Thursday the government boosts JobSeeker by a meagre $25 a week, it will cut the amount job seekers actually receive by a net $50 per week because of the end of the coronavirus supplement.

Mutual obligations impose stress

To offset that generosity – the first real increase in the base rate in 30 years – from April 1 it will ramp up its “mutual obligation” requirements. Job seekers will have to show they have applied for 15 jobs a month, climbing to 20 jobs a month on July 1 – that’s a fresh application every working day.

Failures will attract demerit points. Too many demerits and payments will be stopped.

There will be increased auditing of job applications to ensure they are “genuine”, a return to the compulsory face-to-face meetings suspended during the pandemic, and a dob-in line for employers to report job seekers they think aren’t genuine.

That this will dangerously ramp up stress on the people most susceptible to it, and make it hard for them to do things such as care for their children, ought not to surprise the government.

It has been considering the three-volume report of its Productivity Commission inquiry into mental health for nine months.

The report says stringent mutual obligation requirements might do more than stress those who take part — they might precipitate “clinically defined mental illness in previously well participants”.

For people with preexisting problems, “sound reasons and plausible evidence suggest this could aggravate their illness”.

The government ought to have learnt from repeated mistakes.

A Senate inquiry found the compliance measures associated with its ParentsNext program caused “anxiety, distress and harm”. Post-pandemic, it reinstated those compliance measures.

Robodebt should have been a wakeup call

Its unsolicited “robodebt” demands for repayments of thousands of dollars per recipient the Federal Court found was not owed caused what another Senate inquiry found to be “breakdown, anxiety, depression requiring medication, sleeplessness, stress causing physical illness, and fear”.

The ministers who announced the program in 2016 were Scott Morrison (then treasurer) and Christian Porter (then social services minister).


Read more: Robodebt was a fiasco with a cost we have yet to fully appreciate


They promised that smarter use of technology would “better manage our social welfare system to ensure that every dollar goes to those who need it most” and predicted it would save the budget $2 billion.

The kindest thing that can be said about what happened is that they didn’t follow through with the details, at considerable human cost.

It would be great to see something – anything – that made it look as if, five years on, they have learned from what happened.

Peter Martin, Visiting Fellow, Crawford School of Public Policy, Australian National University

This article is republished from The Conversation under a Creative Commons license. Read the original article.
Read more >>

Wednesday, March 24, 2021

Super funds have been working for themselves when they should have been working for us. That’s about to change

Have you ever wondered why your super fund rarely sends you mail?

It could be because it is one of the 36 funds that perform badly, or one of the six funds that perform extraordinarily badly. As of mid last year those six funds managed the retirement savings of 900,000 Australians.

Not that you would know it from their communications. The wonder of a system that pours a fresh 9.5% of your salary into super each year is that your fund is able to show an upward graph of the amount you’ve got saved even if it is managing those savings badly. You might think it was performing well.

Or your fund might have a more straightforward reason for avoiding mail.

The head of Australia’s biggest super fund, Australian Super with 2.4 million members, spelled it out in an appearance before the banking royal commission.

He said “a direct mail-out – a one-off direct mail-out to Australian Super’s members — costs $2.3 million”.

A million here, two million there…

Chief executive Ian Silk was trying to put into context the $2 million Australian Super threw at the startup news site New Daily throughout 2012 and 2013. He said the $2 million (long gone) wasn’t an investment in the financial sense of the term, but an investment in communications, “a tool to enhance the fund’s engagement with members”.

It’s an investment that will be illegal from July under the government’s proposed Your Future, Your Super law, along with those rather odd TV advertisements implying improbably that unless the government lifts compulsory super contributions, people might lose their houses.

It will be illegal for funds to spend money on these things even if they route the payments through a third party such as the super-fund-owned Industry Super Australia, as they now are.


Read more: That extra you're about to get in super, most of it will come from you, but don't expect the ads to tell you that


The new laws, which flow from the royal commission and a Productivity Commission inquiry, will require every cent of super fund spending (without “any materiality threshold”) to be directed to the best financial interests of members.

What’s different is the addition of the word “financial”. Previously funds were only required to act in the “best interests” of the members.

Until now (and this is an example used in the explanatory memorandum) it might have been OK for a fund to spend member contributions on “well-being and counselling services, due to its preference for providing beneficiaries with a holistic retirement experience”.

Services, seats at the Australian Open

It won’t be legal after July. Spending will have to be in the best “financial” interests of members.

And the onus of proof will be reversed. If challenged, funds will have to demonstrate that their decisions were indeed in the best financial interests of their members, rather than regulators demonstrating that they were not.

Which it should be. It’s our (mainly conscripted) money that they are spending. If they can’t make out a case for the way they are spending it, they might be acting as if it’s their own.

Shockingly, when in 2017 the Productivity Commission inquiry into super asked all 208 funds regulated by the Prudential Regulation Authority for information about their spending and net returns and fees by asset class, 94 didn’t respond.

A cavalier approach to finances

Of the 114 funds that did respond, 26 left blank all of the bits of the form that asked about assets, net returns and investment management costs.

When the commission tried again the following year, 13 of the 136 funds that responded provided no information about expenses at all. It was as if they either didn’t know about their expenses, or felt it was their business and no one else’s.

Time and time again the commission heard about bank-operated funds buying products from other parts of the bank at high prices.

The banking royal commission heard of hundreds of thousands of dollars spent by just one (industry) fund on corporate hospitality at the Australian Open.

It heard of directors of a retail fund who decided against putting their members into lower-priced products when they became available, overruling a lone director who protested, using capital letters

in what circumstances would it NOT be in a client’s best interest to transfer to the new pricing if it was lower than their existing pricing?

Spending on advertising would still be permitted under the draft legislation, but only where it was in the best financial interests of members. If it was aimed at grabbing members from other funds it probably would pass the test, because when funds get bigger the costs per member can shrink.

But the guidance note makes it clear that the costs per member would need to actually shrink, along with the charges to members, or there would need to be a documented case prepared as to why they should have shrunk.


Read more: Yes, women retire with less than men, but boosting compulsory super won't help


Vanity advertising, or advertising for a group of funds, or advertising aimed at influencing public opinion won’t cut it.

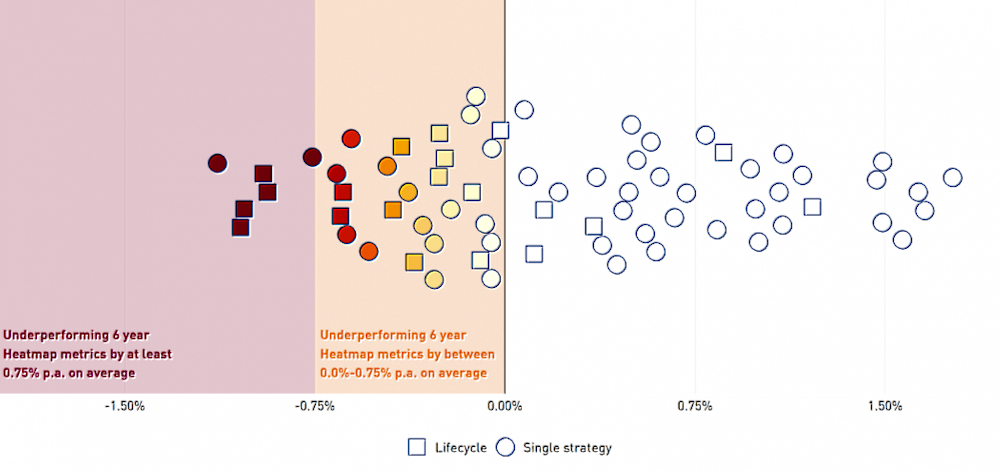
And nor will indifferent performance. The law will require the Prudential Regulation Authority to annually test the performance of funds against objective, consistently-applied benchmarks, different benchmarks for different stated investment strategies.


Early MySuper test results

Five-year performance as at June 30 2020, the darkest coloured funds are the poorest performers. APRA

Funds that fail the test will be required to notify their members in writing. Funds that fail two years in a row will be closed to new members.

Most of us probably have no idea that we spend more on super investment and administration fees each year than we do on gas and electricity combined.

And when the performance is lousy (the difference between a good and bad fund can be $660,000 in retirement) we often don’t find out until it’s too late.

Our funds are about to have to work for us first, and no-one else.

Peter Martin, Visiting Fellow, Crawford School of Public Policy, Australian National University

This article is republished from The Conversation under a Creative Commons license. Read the original article.
Read more >>

Wednesday, March 17, 2021

Electricity is a jigsaw. Coal can't provide the missing pieces

There’s something the energy minister said when they announced the early closure of Victoria’s second-biggest coal-fired power station last week that was less than complete.

Yallourn, in the Latrobe Valley, provides up to 20% of Victoria’s power. It has been operating for 47 years. Since late 2017 at least one of its four units has broken down 50 times. Its workforce doubles for three to four months most years to deal with the breakdowns. It pumps out 3% of Australia’s carbon emissions.

On Wednesday Energy Australia gave seven years notice of its intention to close it in mid-2028, four years earlier than previously announced, a possibility for which regulators had been preparing.

In what might have been a rhetorical flourish, Energy Minister Angus Taylor warned of “price spikes every night when the sun goes down”.

Then he drew attention to what had happened when two other coal-fired power stations closed down — Victoria’s Hazelwood and South Australia’s Northern (South Australia’s last-remaining coal-fired generator).

He said “wholesale prices skyrocketed by 85%”.

And there he finished, without going on to detail what really mattered. South Australia and Victoria now have the lowest wholesale power prices in the National Electricity Market — that’s right, the lowest.

Coal-fired plants close, then prices fall

Before Northern closed, South Australia had Australia’s highest price.

Five years after the closure of Northern in 2016, and four years after the closure of Hazelwood in 2017, South Australia and Victorian have wholesale prices one-third lower than those in NSW and two-fifths lower than those in Queensland.

Something happened after the closure (largely as a result of the closure) that forced prices down.

South Australia became a renewables powerhouse.

The Australian National University’s

Hugh Saddler points out that renewable-sourced power — wind and grid solar — now accounts for 62% of power supplied to the South Australian grid, and at times for all of it.

Much of it is produced near Port Augusta, where the Northern and Playford coal-fired power stations used to be, because that’s where the transmission lines begin.

Being even cheaper than the power produced by the old brown-coal-fired power stations, there is at times so much it that it sends prices negative, meaning generators get paid to turn off in order to avoid putting more power into the system than users can take out.

It’s one of the reasons coal-fired plants are closing: they are hard to turn off. They are just as hard to turn on, and pretty hard to turn up.

Coal can’t respond quickly

There are times (when the wind doesn’t blow and there’s not much sun, such as last Friday in South Australia) when prices can get extraordinarily high.

But coal-fired plants, especially brown-coal-fired plants such as Victoria’s Hazelwood and Yallourn and Victoria’s two remaining big plants, Loy Yang A and B, are unable to quickly ramp up to take advantage of them.

Although “dispatchable” in the technical meaning of the term used by the minister, coal-fired stations can’t fill gaps quickly.


Read more: The death of coal-fired power is inevitable — yet the government still has no plan to help its workforce


Batteries can respond instantly to a loss of power from other sources (although not for very long), hydro can respond in 30 to 70 seconds, gas peaking plants can respond within minutes.

But coal can barely move. As with nuclear power, coal-fired power needs to be either on (in which case it can only slowly ramp up) or off, in which case turning it on from a standing start would be way too slow.

What was a feature is now a bug

That’s why coal-fired generators operate 24-7, to provide so-called base-load, because they can’t really do anything else.

Brown coal generators are the least dispatchable. Brown coal is about 60% water. To make it ignite and keep boiling off the water takes sustained ultra-high temperatures. Units at Yallourn have to keep burning coal at high output (however low or negative the prices) or turn off.

In the days when the other sources of power could be turned on and off at will, this wasn’t so much of a problem.

Hydro or gas could be turned on in the morning when we turned on our lights and heaters and factories got down to business, and coal-fired power could be slowly ramped up.

At night, when there was less demand for coal-fired power, some could be created by offering cheap off-peak water heating.

But those days are gone. Nationwide, wind and solar including rooftop solar supplies 20% of our needs. It turns on and off at will.

Wind often blows strongly at night. What was a feature of coal — its ability to provide steady power rather than fill gaps - has become a bug.

Gas and batteries can fill gaps coal can’t

It’s as if our power system has become a jigsaw with the immovable pieces provided by the wind and the sun. It’s our job to fill in the gaps.

To some extent, as the prime minister says, gas will be a transition fuel, able to fill gaps in a way that coal cannot. But gas has become expensive, and batteries are being installed everywhere.

Energy Australia plans to replace its Yallourn power station with Australia’s first four-hour utility-scale battery with a capacity of 350 megawatts, more than any battery operating in the world today. South Australia is planning an even bigger one, up to 900 megawatts.


Read more: Huge 'battery warehouses' could be the energy stores of the future


Australia’s Future Fund and AGL Energy are investing $2.7 billion in wind farms in NSW and Queensland which will fill gaps in a different way — their output peaks at different times to wind farms in South Australia and Victoria.

Filling the gaps won’t be easy, and had we not gone down this road there might still have been a role for coal, but the further we go down it the less coal can help.

As cheap as coal-fired power is, it is being forced out of the system by sources of power that are cheaper and more dispatchable. We can’t turn back.

Peter Martin, Visiting Fellow, Crawford School of Public Policy, Australian National University

This article is republished from The Conversation under a Creative Commons license. Read the original article.

Read more >>