Tuesday, July 30, 2019

There's a reason you're feeling no better off than 10 years ago. Here's what HILDA says about well-being

During the election campaign then-opposition leader Bill Shorten repeatedly claimed that everything was going up.

“Childcare is up 28%, out of pockets to see the doctor up 20%, specialists … up nearly 40%,” he said. And then the punchline: “everything is going up, except your wages.”

Statistically, it wasn’t true. The official rate of inflation was just 1.3%. The official rate of wage growth was 2.3%.

I haven’t asked him, but I wouldn’t be surprised if he kept saying it because his focus groups told him that’s what people felt.
Today’s release of the 17th wave of Australia’s Household, Income and Labour Dynamics Survey (HILDA) tells us that despite the official statistics, people were right to feel they were going backwards.

Funded by the Australian government and managed by the Melbourne Institute of Applied Economic and Social Research, HILDA is one of the most valuable tools Australian social researchers have.

It examined the lives of 14,000 Australians in 2001 and then kept coming back to them each year to discover what had changed. By surveying their children as well, and in future surveying their children, it will be able to build up a long-term picture of how circumstances change over the course of lives and generations.

It can be thought of as Australia’s Seven Up!, the British TV series that keeps going back for updates on the lives of 14 children it first examined when they were seven. Except that HILDA’s results have statistical significance, and the questions are detailed, asking among other things about depression and anxiety, work-life stress, stress in relationships, and illicit drug use.

We are right to feel no better off…

The Australian Bureau of Statistics does indeed find that wages are climbing faster than prices, as they almost always have, but because it doesn’t examine what happens to a particular household over time it can tell us little about whether an individual’s experience of things is getting better or getting worse.

HILDA gets a handle on each household’s disposable income by asking each member of the household about their gross income from wages, benefits, investments and other sources and then deducting its estimate of taxes. It gets a handle on the real (inflation-adjusted) changes by adjusting its totals for changes in the consumer price index.

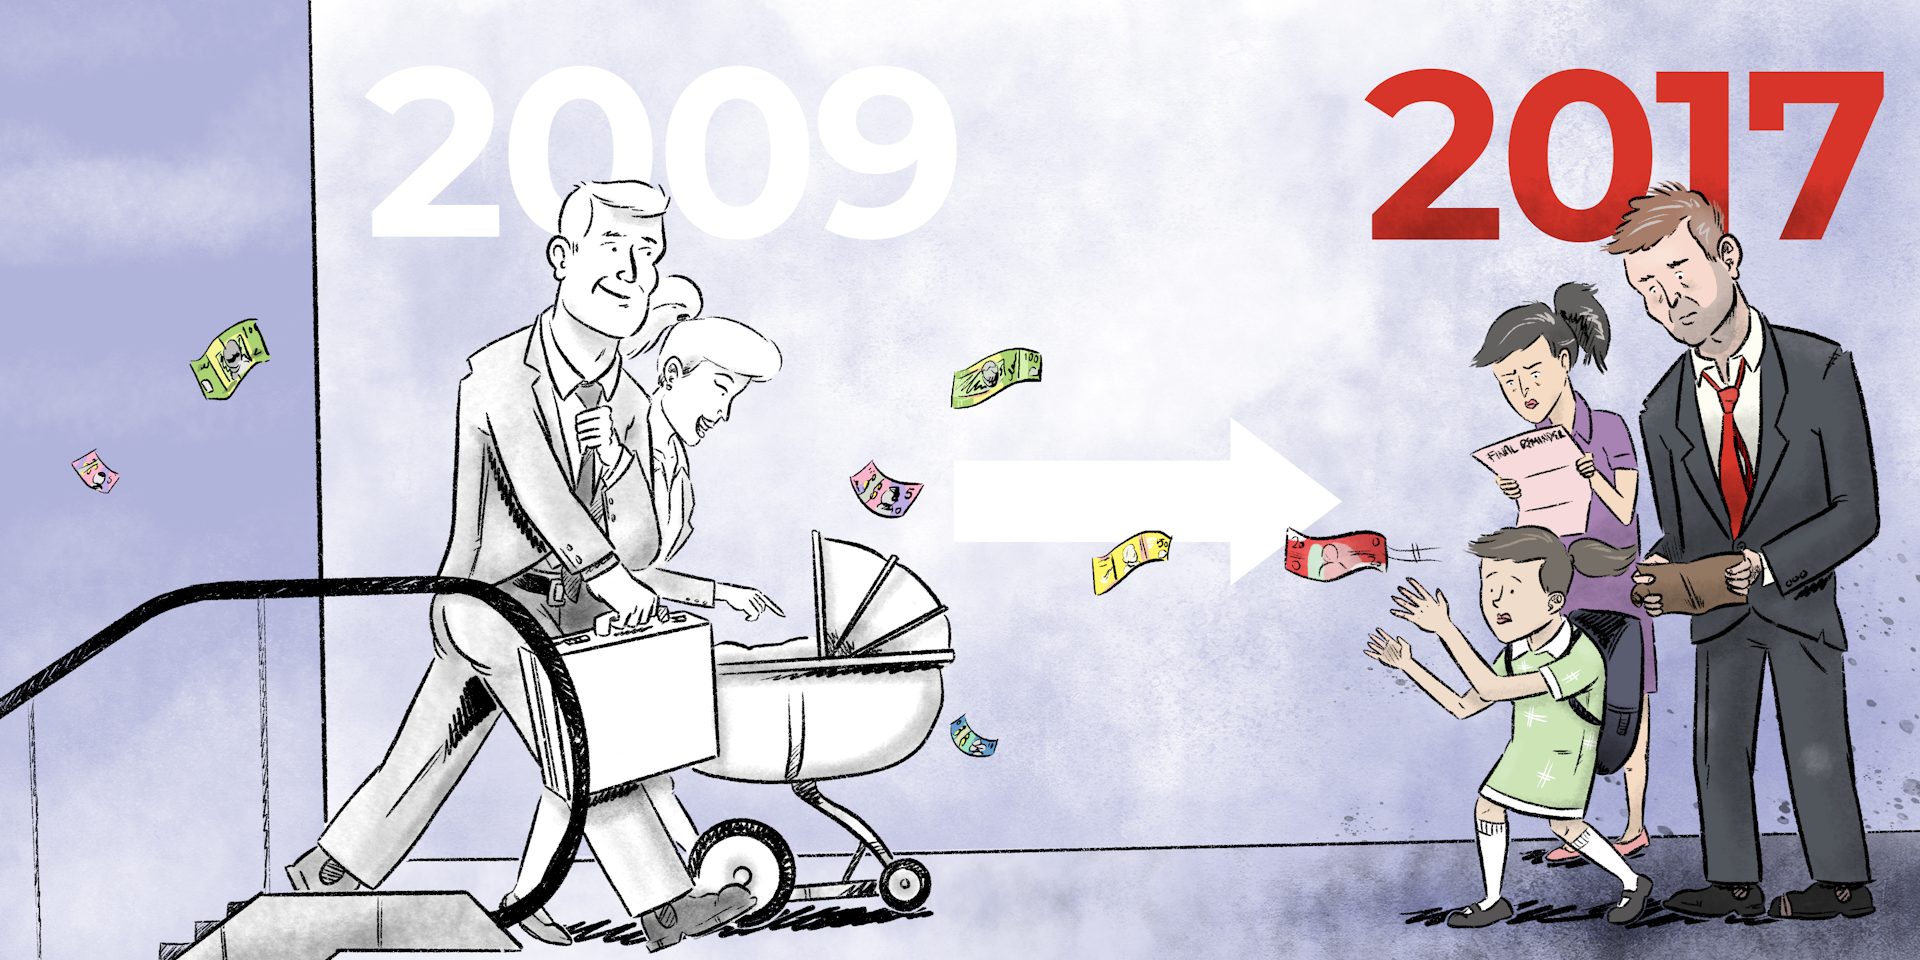
It finds that for the thousands of households it interviewed, real disposable income grew strongly during the first nine years of the survey, between 2001 and 2009. Then, after the global financial crisis, for the eight years between 2009 and the 2017 results released today, that growth stalled.


Expressed in today’s dollars, the average annual real disposable income of those households climbed by A$19,773 between 2001 and 2009, about $2,472 per year.

But most of the growth was during the mining boom that stretched from 2003 to 2009 when the average annual real disposable household income climbed about $3,000 per year, as did the income of the more representative median (or middle) household.

Since 2009 and the global financial crisis, the average and the median have moved in different directions.

The average houshold’s annual real disposable income has climbed a further $3,156. The median (or typical) household’s income has fallen $542, although not steadily. The graph shows it falling between 2009 and 2011, climbing in 2012, and changing little thereafter.

…and as if it’s harder to get ahead…

It has also become harder to “get ahead”, in the phrase used often by the prime minister.

Between 2001 and 2005, 40% of the households in the bottom fifth of earners (the bottom qunitile) moved out of it into a higher one. In more recent years, between 2012 and 2016, a lower 38.5% moved up.

Between 2001 and 2005, 44% of the households in the top qunitile had to move down to let other households take their place. In more recent years, between 2012 and 2016, only 41.5% have moved down.

Getting a long way out of the income circumstances you were born in is a long-shot, according on HILDA’s early attempt at measuring intergenerational mobility.

People who were 32-34 years old in 2015-17 are highly likely to be in the same household income quintiles as those people found themselves in when they were 15-17 back in 2001-03.


There’s only a one in ten chance of moving from the bottom quintile as a teenager to the top quintile in your early thirties. There’s a 37% chance you’ll stay put.

Even among teenagers who grew up in the middle quintile, there’s only a 17% chance of making it to the top, along with a 19% chance of moving one rung up.

Interestingly, women turn out to be more tied to the income their families had when they were children than men, and both men and women tend to stay more closely tied to their mother’s income than their father’s.

…yet we are less reliant on welfare, even pensions…

When HILDA began in 2001, 39% of Australians aged 18 to 64 were living in a household that received government welfare of some kind. By 2017, that proportion had fallen to 31%, but almost all of the drop happened before the global financial crisis in 2009.

Most of us are still in households that have received something from the government over a 10-year period: 58% of working age Australians in 2017, down from 64% in 2010.

Among older Australians aged 65 and over, reliance on the age pension and other benefits for more than half of income needs has dropped from 60% to 51%.

Among new retirees aged 65 and over, the proportion receiving the age pension has fallen from 76% of men and 74% of women to just 60% of men and 55% of women.


Read more: More people are retiring with high mortgage debts. The implications are huge


But while the growth of compulsory superannuation is likely to be part of the story, almost all of the decline happened before the financial crisis in 2009, suggesting that the destruction of wealth in the crisis kept people on the pension who otherwise might not have needed it.

…and gender roles are changing

Before the financial crisis, almost three quarters (73%) of men of traditional working age were employed full-time. After the crisis, the rate slipped to a much lower 67% and stayed there.

Female full-time employment was also hit by the crisis but has since almost totally recovered to be just a fraction below its pre-crisis peak of 39.6%.

Women’s hourly earnings are also climbing faster than men’s, up 24% between 2001 and 2017, compared to 21% for men’s.

While women have always been more likely than men to be employed casually, since the crisis male casual employment has climbed while female casual employment has declined.

The two are now as close as they have ever been, with women now only six percentage points more likely than men to be employed causally.


Read more: HILDA findings on Australian families' experience of childcare should be a call-to-arms for government


In dual-earner male-female couples, the proportion in which the woman earns more than the man has climbed from 22% to 25%.

The woman being the main breadwinner is more common in couples that aren’t legally married and don’t have children. It is also far more common in the regions than in cities and among couples in which the man doesn’t have a university degree.

Men in predominantly female breadwinner households are somewhat less happy with their lives and with their relationships, as (perhaps surprisingly) are women.

Fathers tend to agonise more about work-family conflict than mothers, notwithstanding the much greater amount of housework and childcare work performed by mothers. The men who worry the most work long hours, have irregular shifts and very young children. A mother working the same hours as a father will typically be more conflicted.


Read more: Language of love: a quarter of Australians are in inter-ethnic relationships


Most parents suffering high work-family conflict get out of it within a year or two, often by managing things better and sometimes by changing jobs. Those suffering high work-family conflict are 50% more likely than others to separate the next year.

HILDA’s great strength is that it will be able to follow those parents and their children and all the other families it surveys and tell us what happens next. Rather than being an Australian version of Seven Up!, it might be better described as Australia’s never ending story. Its co-director Roger Wilkins says its design allows it to be “infinitely lived”.


Read more: Australian city workers' average commute has blown out to 66 minutes a day. How does yours compare? The Conversation


Peter Martin, Visiting Fellow, Crawford School of Public Policy, Australian National University

Wes Mountain/The Conversation, CC BY-ND

This article is republished from The Conversation under a Creative Commons license. Read the original article.

Read more >>

Sunday, July 14, 2019

They've cut deeming rates, but what are they?

Treasurer Josh Frydenberg has cut the deeming rate for large investments from 3.25% to 3%, and for smaller ones from 1.75% all the way down to 1%.

The cuts are backdated, to the start of July.

But what exactly is a deeming rate, and why does it matter so much to about one million Australians on benefits, among them around about 630,000 age pensioners?

It’s a topic I covered in The Conversation mid last week in an explainer that went all the way back to the beginning, or at least the most recent beginning, when treasurer Paul Keating brought deeming rates back to Australia’s benefits system in 1991.


Read more: Deeming rates explained. What is deeming, how does it cut pensions, and why do we have it?


Before that, applicants for the pension were able to pass income tests by ensuring that their assets didn’t earn much income, a service banks and other institutions were happy to provide for them.

From 1991, on applicants for the age pension (and later other benefits) were “deemed” to have earned from their financial assets amounts set by the government, whatever they actually earned.

Of late, deeming rates haven’t kept up

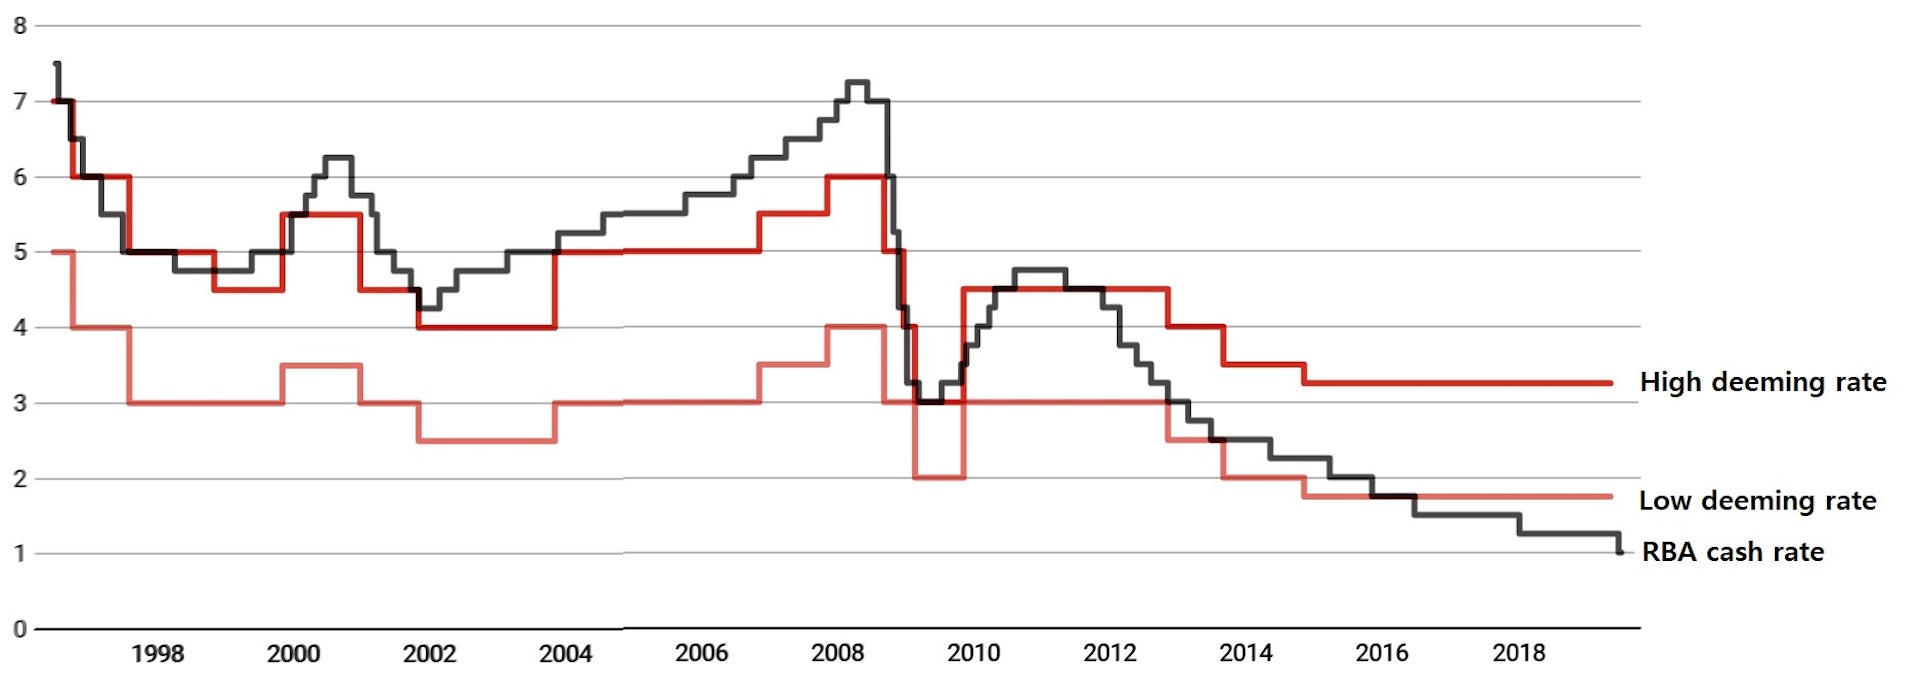
For most of the past two decades both the high deeming rate (which at the moment applies to financial assets in excess of A$51,800 for singles and $86,200 for couples) and also the low deeming rate (for lesser assets) have been below the Reserve Bank’s cash rate, benefiting applicants who could earn more than those low rates while continuing to get benefits.


Deeming rates versus RBA cash rate, July 1996 - July 2019, per cent


Then, beginning with prime minister Kevin Rudd (who, to be fair to him, in 2009 delivered the biggest ever increase in the pension – $100 a fortnight for singles and $76 for couples) and continuing under his successors Gillard, Abbott, Turnbull and Morrision, the government adjusted the deeming rate more slowly, meaning that as the Reserve Bank’s cash rate fell, both the high and low deeming rates ended up above it.

The decisions announced by Frydenberg on Sunday go a long way to putting things right.

The lower deeming rate will once more be close to the cash rate (exactly at the cash rate, for as long as the cash rate stays at 1%). The higher deeming rate will not be, but then it probably shouldn’t be.

The higher rate applies to the return on financial assets (including shares) worth more than $51,800.

As Frydenberg pointed out on Sunday, many of those assets return much more, not much less, than the deeming rate:

It could apply to superannuation returns, and that’s averaging around 5.5%. Or to yields on ASX 200 stocks, which are averaging about 4.5%

The low deeming rate is on the face of it unfair, because few bank deposits pay 1%. The special retirees accounts offered by ANZ and the Commonwealth pay 0.25%. Many deposit accounts pay nothing.

But the low rate applies to financial assets all the way up to $51,800 ($86,200 for couples), and to all types of assets. Many pension applicants are likely to earn a total return on those assets well above 1%.

Deeming is by design, rough and ready. There will always be complaints, and of late those complaints had force. They are now back broadly where they should be.


The Conversation

Peter Martin, Visiting Fellow, Crawford School of Public Policy, Australian National University

This article is republished from The Conversation under a Creative Commons license. Read the original article.
Read more >>

Thursday, July 11, 2019

Deeming rates explained. What is deeming, how does it cut pensions, and why do we have it?

Now it’s the Coalition that’s being accused of a “retiree tax”.

As interest rates have come down over the past four years, the rate that retirees are “deemed” to have earned for the purpose of the pension income test hasn’t budged, meaning that although retirees have been earning less (in some cases a good deal less), they haven’t been getting more access to the pension.

Depending on how you look at it, it’s either been making a mockery of the idea of an income test, or making the test more restrictive.

So how did it happen? Why is income “deemed” rather than actually measured when determining eligibility for government benefits, and is the system hopelessly compromised?

It’s important to understand what deeming is and where it came from if we are to understand the debate that will ensue when the government completes its review of the deeming rate in the next few weeks.

Where did deeming come from?

Modern day deeming was introduced by former prime minister Paul Keating in his final budget as treasurer in 1990.

As he explained in that budget speech:

many pensioners still disadvantage themselves by holding their savings in accounts that pay little or no interest

He was being diplomatic. It was widely believed that many retirees deliberately earned low rates on their savings in order to qualify for the pension or get a bigger pension. It cost the government money (while making the banks money) and it cost many of the pensioners money, because they lost more in interest than they gained in pension – although for those that used low earnings to ensure they at least got some pension, the associated benefits cards made it worth it.

From March 1991 cash and deposits were to assumed to be earning at least 10%, whatever they actually earned. If they earned more than 10% they were treated as earning more.

Except for the first A$2000. That was treated as earning only what it did, because many pensioners held small savings in low interest accounts for day to day purchases.

How has it changed?

Deeming is different today. It applies to more assets, including gold,
managed investments, superannuation account-based income streams and listed shares; and it is used to assess eligibility for more benefits, including veterans and disability pensions.

And it’s no longer a win-win for the government. If someone earns more than the deeming rate, their income is assessed at only the deeming rate.

In the words of the department of human services:

if your investment return is higher than the deemed rates, the extra amount doesn’t count as your income

There are two rates: one for the first $51,800 of financial assets (for a couple, the first $86,200) which is currently 1.75%, and the other for those assets in excess of that amount, which is currently 3.25%.

The threshold climbs in line with the consumer price index each July.

(In its first budget in 2014 the Abbott government tried to cut the threshold to $30,000 for singles and $50,000 for couples but was thwarted by the Senate.)

We deem by whim…

But there’s nothing automatic about setting the rates. It’s up to the government (specifically the minister for families and social services) to adjust them, or not, as it sees fit.

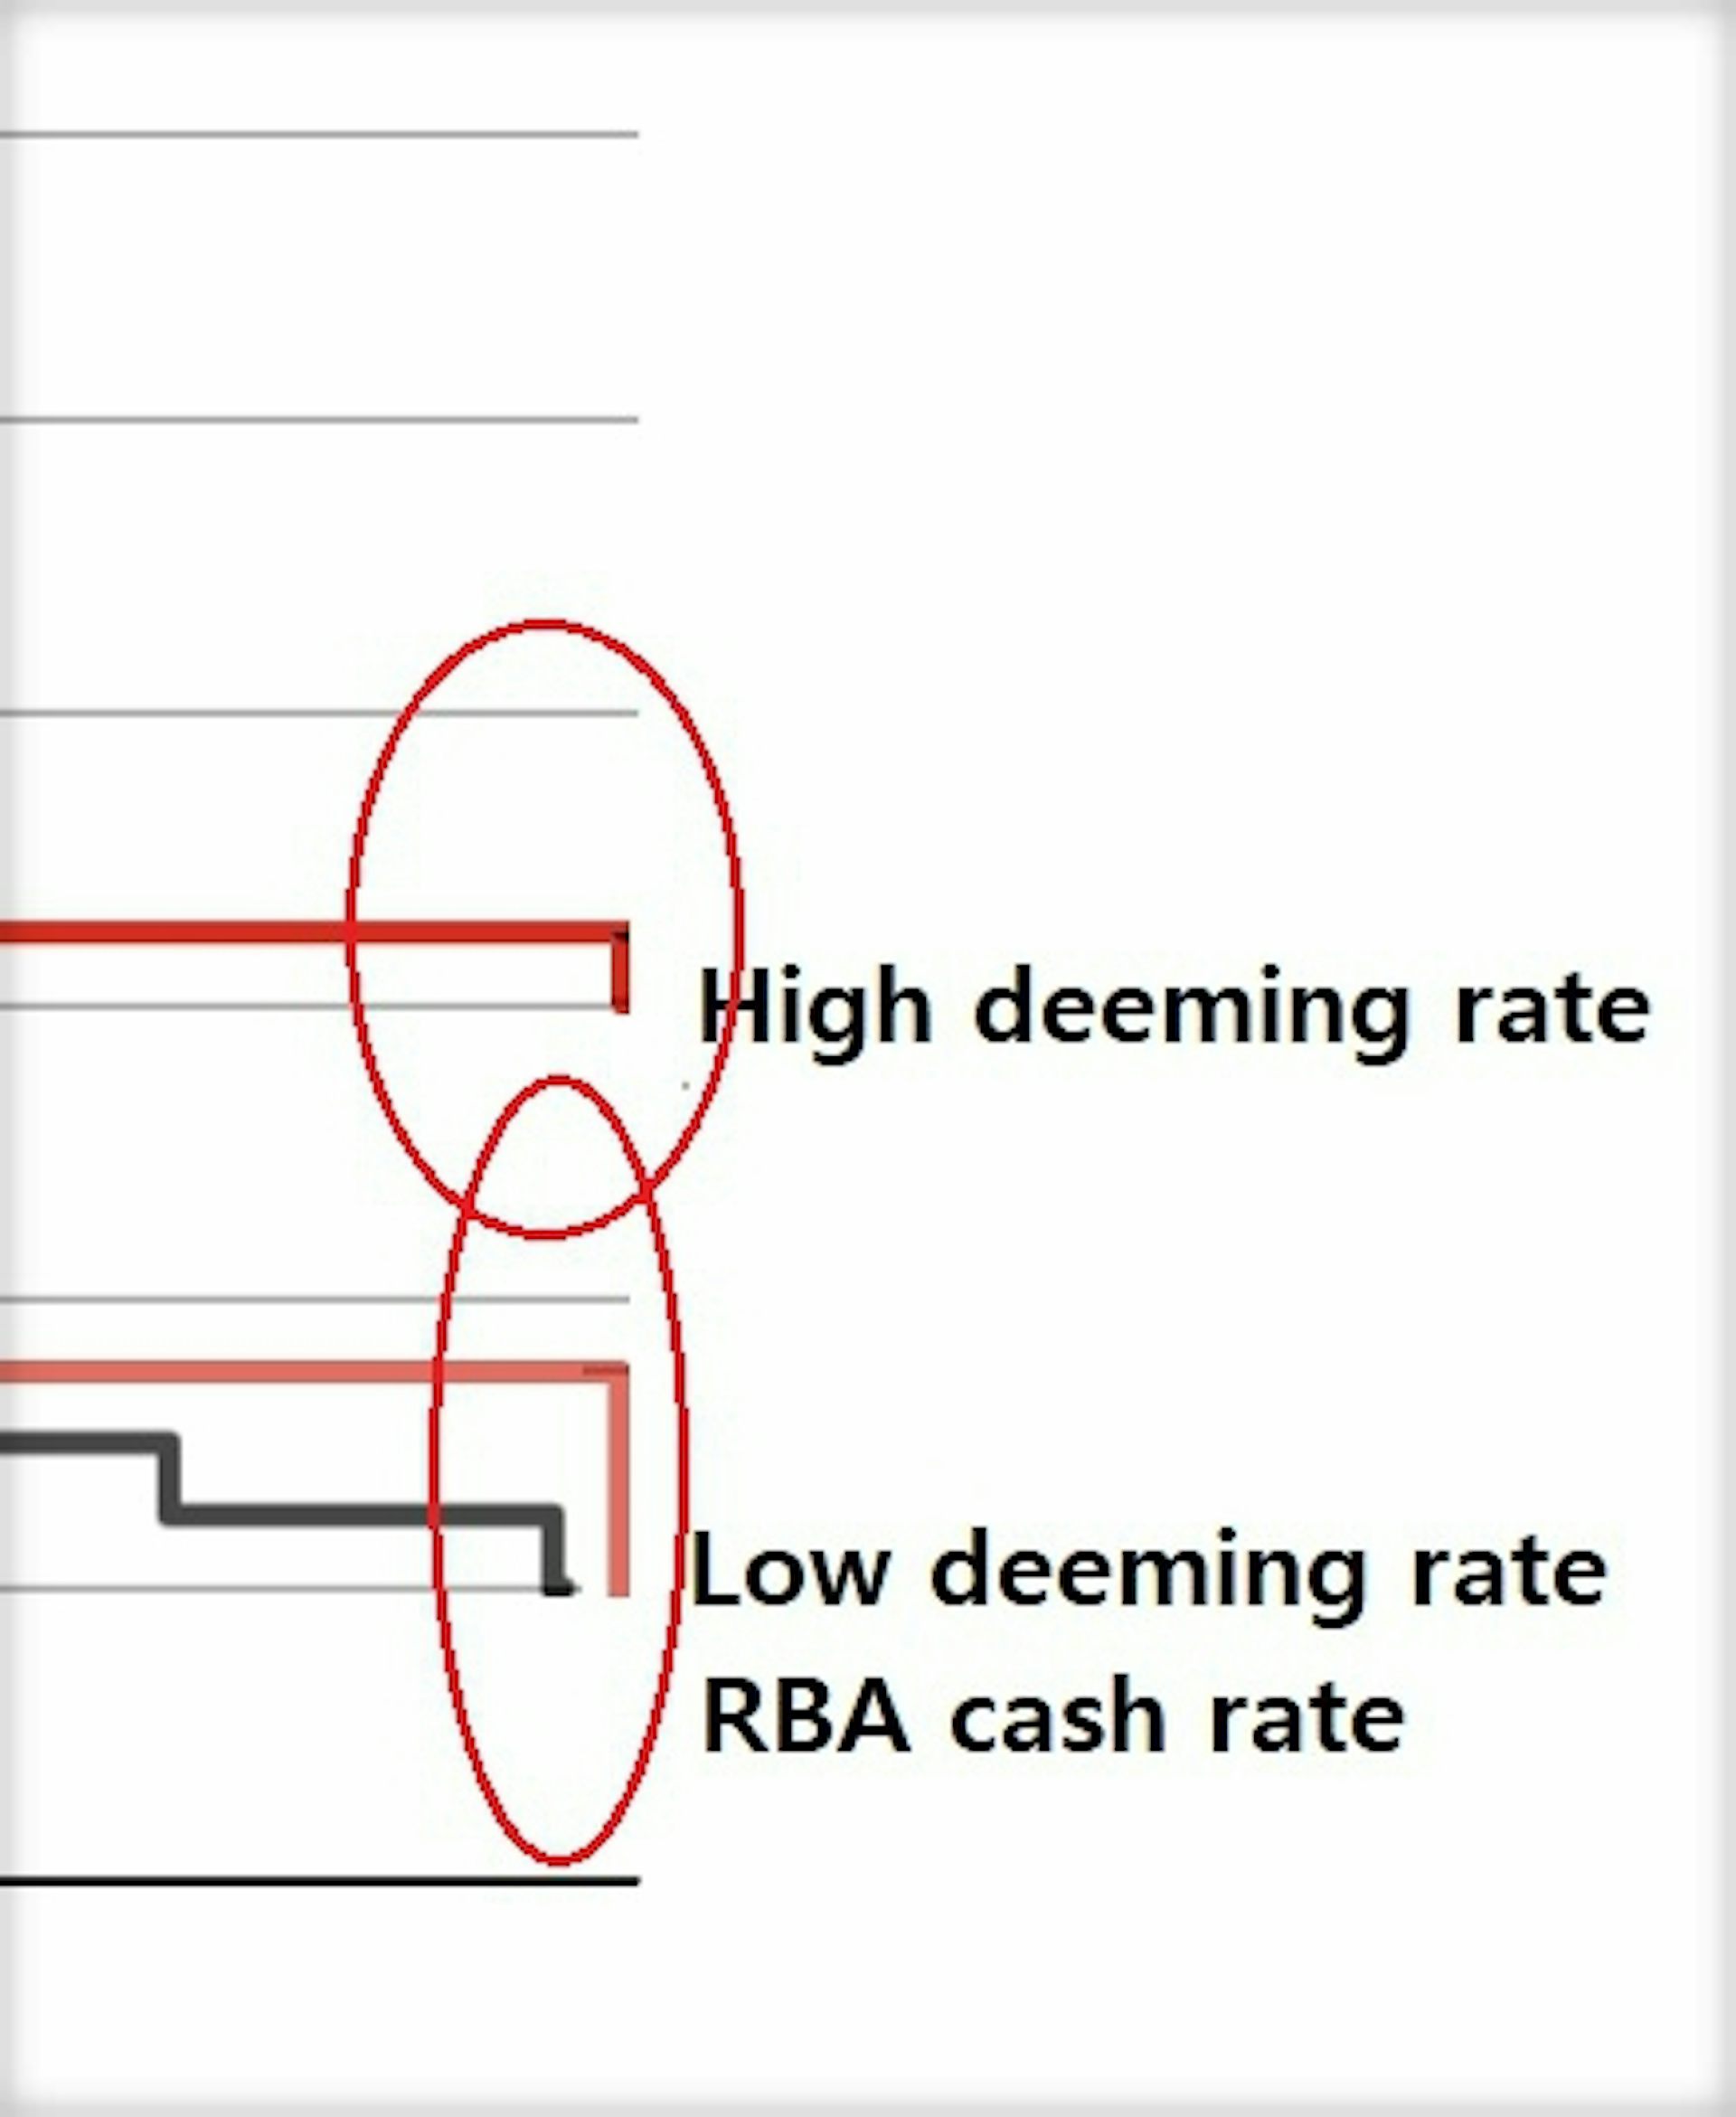
Both the high and low deeming rate used to be below the Reserve Bank’s cash rate (with the low rate typically 1.5 to 2 percentage points below the high rate), but after the cash rate dived in 2016 they have been left above it, in the case of the low rate, for the first time ever.

The high deeming rates mean many applicants are being means tested on income they haven’t received.


Deeming rates versus RBA cash rate, 1996 - 2019, per cent


…leaving rates curiously out of whack

Back when the deeming rates were lower relative to deposit rates, each of the big four banks offered “deeming accounts” that paid the deeming rates.

Today none of them do. They are not allowed to call accounts deeming accounts unless they pay the deeming rate, so instead they have retitled them “retirement accounts”.

The National Australia Bank’s retirement account (closed to new customers) pays just 0.20% for the first $10,000, well below the lowest deeming rate of 1.75%. The ANZ and the Commonwealth pay 0.25%. Westpac pays 0.3%. If you have more than $250,000 on deposit it pays 1.5% on the part above $250,000, which is still lower than the lowest of the two deeming rates.


Read more: Why pensioners are cruising their way around budget changes


Labor believes that not cutting deeming rates since 2015 has saved the government more than $1 billion per year in pension payments. It’s a significant portion of the $7.1 billion surplus it has forecast for 2019-20.

That is probably why the government has said it will take its decision about rates to its expenditure review committee, in what amounts to an admission that those decisions have as much to do with government finances as they do with treating applicants for pensions fairly.

There’s actually a case for extending deeming

As unrealistic as deeming rates have become, there’s a case for extending their use.

At the moment applicants for the pension face two means tests: one for assets and one for income.

Both the Henry Tax Review and the Abbott government’s National Commission of Audit recommended replacing them with a “merged means test” of the kind Australia had up until the 1970s.

Instead of an assets test, all assets would be deemed to earn a prudent rate of return; among them cars, holiday homes, investment properties, and high-value family homes.

The Commission put the case this way:

Exempting the principal residence from the means test is inequitable as it allows for high levels of wealth to be sheltered from means testing. For example, under current rules a single person who owns a $400,000 house and has $750,000 in shares ($1.15 million in total assets) would not be eligible for the pension, while a similar person with a principal residence worth $2 million and $100,000 in shares ($2.1 million in total assets) would be able to claim a pension at the full rate.

It’s a worthwhile idea whose time might come, but it is unlikely to come while deeming rates are seen to be unfair and capriciously set.

The government has an opportunity to restore confidence in deeming and pensions. The decisions it is about to make will show how important it thinks that is.


Read more: Words that matter. What’s a franking credit? What’s dividend imputation? And what's 'retiree tax'? The Conversation


Peter Martin, Visiting Fellow, Crawford School of Public Policy, Australian National University

This article is republished from The Conversation under a Creative Commons license. Read the original article.
Read more >>

Wednesday, July 03, 2019

Ultra-low unemployment is in our grasp. How Philip Lowe became the governor who lifted our ambition

Rarely does a Reserve Bank governor get to remake Australia.

HC “Nugget” Coombs, the first Reserve Bank governor, did.

As director general of the Department of Post-War Reconstruction from 1943, he was instrumental in creating the White Paper on Full Employment in Australia that was adopted as a guide by prime ministers from Chifley to Menzies to Whitlam.

He ensured the objective of full employment became part of the charter of the Reserve Bank when he became its first governor in 1960, moving over from the then government-owned Commonwealth Bank, which had performed the Reserve Bank’s functions up to then.

After once again cutting interest rates to a new record low at a special Reserve Bank board meeting in Darwin on Tuesday, his latest successor Philip Lowe will travel to Yirrkala in Arnhem Land to visit the site where some of the Coombs ashes were buried.

HC Coombs gave us full employment

On Tuesday night in Darwin, he paid tribute to Coombs. He said that in his dual roles as governor of the Reserve Bank and chair of the Council for Aboriginal Affairs, he was a strong advocate for land rights and the preservation of cultural values and traditions.

Another governor who remade Australia was Bernie Fraser, head of the treasury when Prime Minister Paul Keating made him governor of the Reserve Bank in 1989 – shortly before Australia plunged into recession.

He cut rates dramatically from early 1990, as might have been expected in order to bring about a recovery. But then, well before the recovery was complete (and the unemployment rate was still about 10%), he stopped cutting and started pushing rates back up – much to Keating’s displeasure.

Bernie Fraser gave us low inflation

His rationale appears to have been to salvage something out of the unusual circumstances in which Australia found itself. With inflation on the ropes because of the recession, he decided to keep it there – to squeeze out high inflation forever. With one temporary exception during the introduction of the goods and services tax in 2000 it never again returned to the rates of 5% or more that had been common.

He did it not because of an unusual opportunity, and changed Australia forever.

And so to Philip Lowe, who on Tuesday night in Darwin indicated that he too was taking advantage of an unusual opportunity and would probably change Australia forever.

Until a few years ago, it was thought that Australia’s rate of “full unemployment” – the rate below which unemployment couldn’t stay without stoking inflation – was touch over 5%. As it has fallen to 5% in the past year without stoking either inflation or much-wanted wage growth, the bank has come to revise its view.

It now thinks something has changed and the “full employment” is probably 4.5% or lower, a low that was reached during the peak of the mining boom but hasn’t been sustained since the early 1970s. Aiming for an unemployment rate of 4.5% instead of 5% would get 69,000 more people into work.

Lowe wants unemployment lower

Lowe could have ignored the opportunity to push unemployment down that far, to a low that hasn’t been sustained since the 1970s. Instead, in Darwin on Tuesday night, he embraced the opportunity, saying his board was:

prepared to adjust interest rates again if needed to get us closer to full employment and achieve the inflation target in a way that supports the collective welfare of all Australians

Governor Lowe plans to usher in the lowest unemployment target in half a century. He believes the economy can sustain it. He said several times on Tuesday that he would prefer the government to help out with infrastructure projects and the like, but if it won’t, he is “prepared to adjust interest rates again if needed to get us closer to full employment”.

He is doing it because the opportunity is there, as did Coombs and Fraser before him.

There’s no telling (yet) how far rates will have to fall to achieve it. Without setting out to, Lowe is remaking Australia.


Read more: Buckle up. 2019-20 survey finds the economy weak and heading down, and that's ahead of surprises The Conversation


Peter Martin, Visiting Fellow, Crawford School of Public Policy, Australian National University

This article is republished from The Conversation under a Creative Commons license. Read the original article.

Read more >>

Sunday, June 30, 2019

2019-20 Economic Survey. Buckle up: economy weak and heading down, and that's ahead of surprises

During the election we were promised jobs and growth. But in 2019-20 The Conversation’s forecasting panel is predicting an economic growth rate as weak as any since the financial crisis, as well as dismal consumer spending, no improvement in unemployment or wage growth, and an increased chance of recession.

As in January, The Conversation has assembled a forecasting panel of 20 leading economists from 12 universities across six states. Among them are macroeconomists, economic modellers, former Treasury, IMF, OECD and Reserve Bank officials, a former government minister and a former member of the Reserve Bank board.

Whereas in January only three members of the 20-person panel expected the Reserve Bank to cut interest rates, and most expected an economic growth rate approaching 3% (which is the Treasury’s estimate of the best that can be achieved on a sustained basis), this time all but two expect the bank to cut again, and most expect a growth rate closer to 2% – one of the most anaemic since the financial crisis.


Read more: No surplus, no share market growth, no lift in wage growth. Economic survey points to bleaker times post-election


On the upside, the panel expects iron ore prices to stay higher for longer than did the budget, it expects home prices to stabilise, and it is predicting the lowest government bond rate on record, making it cheaper than ever before for the government to borrow and spend its way out of trouble.

The panel predicts a surplus in name only in 2019-20, and overwhelmingly believes the government should be prepared to abandon it if it has to in order to keep the economy growing.

Economic growth

The panel’s average forecast for year-on-year growth is 2.1%. Year-on-year growth is the measure used in the budget. It compares economic activity throughout all of one financial year with activity throughout all of the previous financial year. The budget forecast for 2019-20 is 2.75%.

Respected forecasters including former Reserve Bank board member Warwick McKibbin and former OECD director Adrian Blundell-Wignall expect much lower growth than 2.1%. McKibbin expects 1.8%; Blundell-Wignall expects 1.5%. Only three of the panel’s 20 forecasts are close to Treasury’s. The rest are lower.


Some panellists submitted forecasts for Chinese economic growth under sufferance. They made it clear they were forecasting “official” growth, not actual growth which they think is much lower. Even so, most expect official growth to slow as the trade war between the United States and China intensifies. Nigel Stapledon says unless it is reined in (and he thinks it will be) it could bring on recessions.

Other panellists including Rebecca Cassells say the impact of US tariffs on Chinese goods has so far been positive for Australia. China has responded by investing in infrastructure projects that need Australian iron ore and coal. This, together with reduced competition from other suppliers of iron ore after the collapse of a tailings dam and mine closures in Brazil, has lifted the price and volume of Australian exports to levels not seen for some time.

The panel expects robust United States growth of 2.6% in 2019, although many members are concerned about the year that will follow. The only panellist to forecast low US growth in this year (1%) is Blundell-Wignall, who until last year analysed world economies in his role as special advisor to the OECD secretary general.

Living standards

Jobs growth will disappoint both the Treasury, which has forecast unemployment of 5% by the end of the financial year, and Reserve Bank Governor Philip Lowe, who has adopted a target of “4 point something”.

All but three of the 20-person panel expect the rate to stay above 5%. The average forecast is 5.3%, which is close to the present 5.2%.

Stapledon says Australia’s recent strong employment growth has been “out of kilter” with slower GDP growth and the winding down of housing construction, meaning jobs growth is set to slow down, pushing up unemployment.


Brendan Coates says underemployment is also climbing as more people work fewer hours than they would like, making it harder for them to push for wage rises. Rebecca Cassells points out that full-time employment has grown almost twice as fast among women than men, which, given the low rates of pay in the industries that traditionally employ women, is likely to further depress average wages.

The headline measure of living standards, GDP per capita, has been falling, but a better measure, real net disposable income per capita, which takes better account of buying power, has been continuing to climb. The panel expected to climb a further 1% over the year to June 2020, after climbing 1.3% in the year to March.

Nominal GDP, which takes full account of mining revenue and drives company profits and the budget revenue, has grown 5% over the past year and is expected to grow 3% in the year ahead.

The risk of recession

The panel regards a recession as more likely than it did in January, assigning a 29% probability to a conventionally defined recession in the next two years, up from 25%.

Economic modeller Janine Dixon says the bulk of Australia’s recent economic growth has come from higher commodity prices via exports.

She says without them, Australia would be reliant on weak wage and consumption growth, although she believes high population growth will be enough to ensure economic activity doesn’t shrink for two consecutive quarters which would be the conventional definition of a recession.


Former Treasury and ANZ Bank economist Warren Hogan says with consumers tightening their belts, an external shock could easily knock Australia into a recession.

Julie Toth, an economist at the Australian Industry Group who has also worked for the Productivity Commission, says with growth already low, it won’t take much to turn it negative.

Debt theorist Steve Keen, who assigns a 95% probability a recession (as he did in January) says Australia escaped that fate during the global financial crisis in part by boosting grants to first home buyers, which made Australian households among the most indebted in the world and “put off the day of reckoning” when those debts would be unwound.

Through a mix of good luck and good management, Australia has avoided a recession during three global downturns since the early 1990s: the 1997 Asian economic crisis, the early 2000s dotcom collapse, and the 2007-09 global financial crisis. If it succeeds again it will enter its fourth decade recession-free in this term of government in mid-2021.

Wages and prices

The panel expects continued historically wage growth of only 2.2% in 2019-20, slightly weaker than the latest reading of 2.3% and well short of the budget forecast of 2.75%. If that average forecast is right, it will be the seventh consecutive year in which wage growth has fallen short of the budget forecast.


The good news (for wage earners) is that even that unusually low rate of wage growth would be well above the rate of inflation, which is expected to be only 1.5%, or 1.4% on the so-called “underlying” basis watched closely by the Reserve Bank.

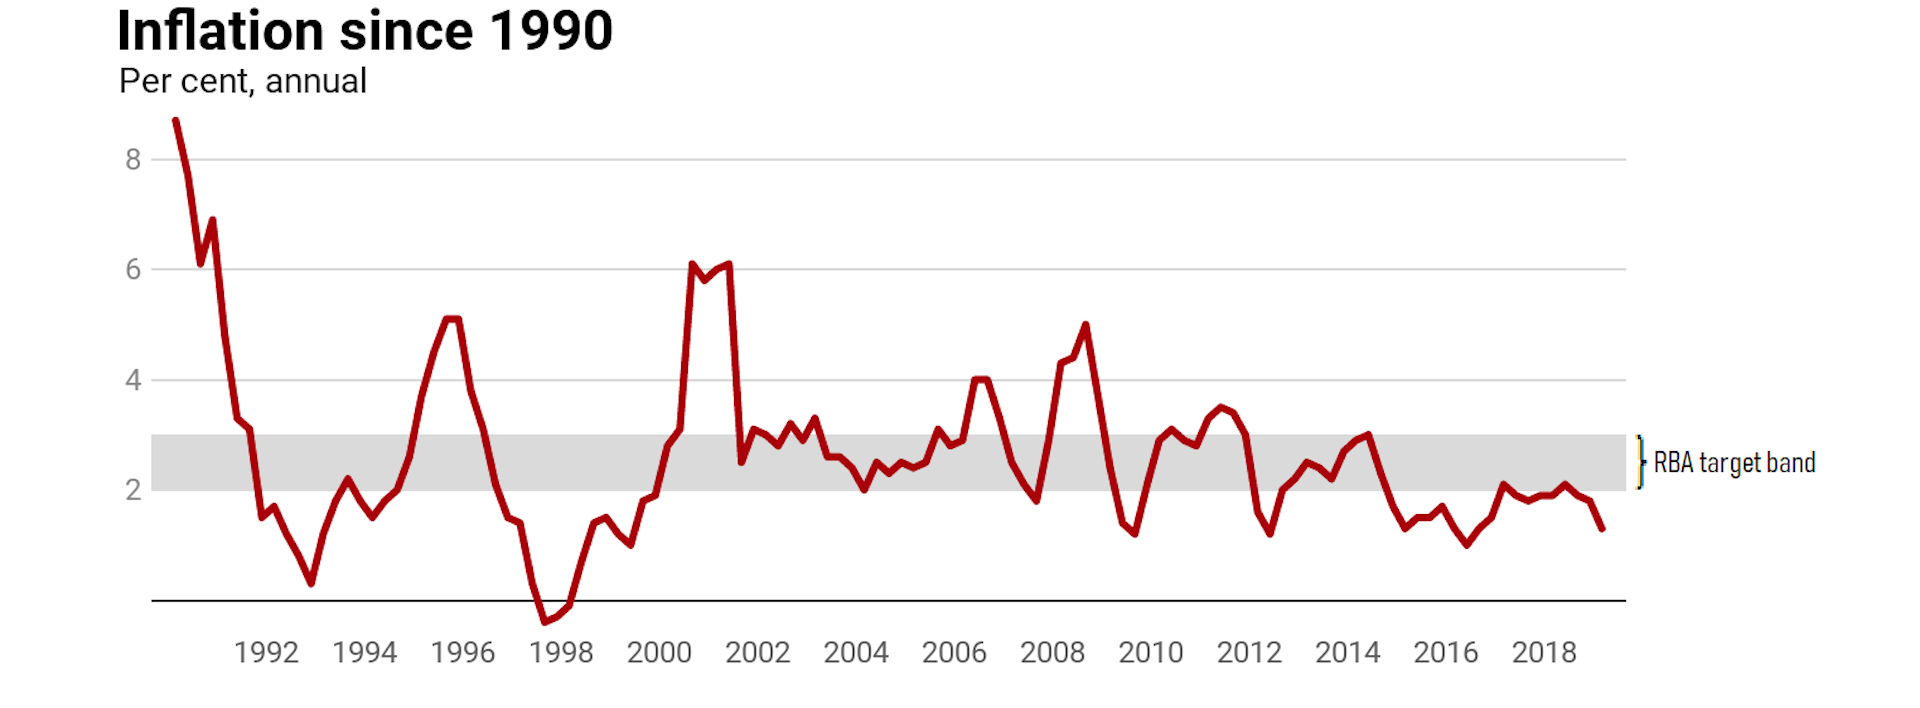
The bad news for the Reserve Bank is that it will put inflation well outside the bank’s target band of 2-3% for the fifth consecutive year, raising questions about whether there is any point to the band.


For years now, inflation has mostly been below the band. ABS 6401.0

Mark Crosby, Warren Hogan and Adrian Blundell-Wignall suggest broadening the target band to 1-3%. Tony Makin and Nigel Stapledon suggest cutting it to 1-2%.

Richard Holden and Warwick McKibbin suggest ditching it altogether and replacing it with a target for nominal GDP growth. McKibbin suggests a nominal GDP target of 6%, which given the present forecast for weaker nominal GDP growth would mean interest rate cuts. In better times it would mean rate rises.

Chris Edmond and Craig Emerson defend the 2-3% inflation target saying that what is really concerning is the bank’s preparedness to stay beneath the target band for extended periods.

Home prices

The panel expects only modest falls in Sydney and Melbourne house prices of 2-3% in each city after falls of 10% over the past year. It is more optimistic on home building than is the Treasury, expecting housing investment to fall by 4.9% rather than the budget forecast of 7%.


Business

None of the panellists expects household spending to grow by the 2.75% forecast in the budget. On average, the panel expects spending growth of just 1.9% in 2019-20, which is little better than the present 1.8% and only few points above population growth.

Janine Dixon blames continuing weak growth in wages and incomes. Nigel Stapledon says much of it flows from the weaker housing market. Household furnishings drive household spending growth. Household spending drives GDP growth, accounting for more than half of it.

In better news, the panel expects mining investment to rebound after sliding for most of the last five years. Its forecasts of growth in mining investment of 4.4%, and growth in non-mining investment of 4%, are in line with budget forecasts.


Interest rates and the budget

Perhaps surprisingly given its forecasts for weak employment growth, weak economic growth and weak inflation, the panel’s average forecast for interest rates is for just one more cut, perhaps as soon as July 2, but some time in the second half of the year.

Only five panellists expect a followup cut in the first half of next year, but among them are Craig Emerson, Richard Holden and Steve Keen, who were the only three to correctly) forecast in January that there would be a rate cut at all this year.

Holden expects two further rate cuts in the second half of this year, taking the Reserve Bank cash rate to 0.75%, and then a further two in the first half of next year, taking it to just 0.25%. Keen expects one further cut on the second half of this year and another two in the first half of next year, taking it to 0.5%.

Warwick McKibbin is the only panellist expecting the Reserve Bank to change course, expecting one further cut this year and then a series of increases as ballooning debt makes the Reserve Bank and other central banks realise they cut too far, pushing the cash rate back up to 1.5%.


The panel expects a government 10-year borrowing rate of just 1.5%, which is about the lowest it has ever been. A year ago the 10-year bond rate was 2.7%. The ultra low rate will both make it easier for the government to borrow and cut the cost of servicing its existing debt as loans are rolled over.

In further good news for the budget, the panel expects a substantially higher spot iron ore price than does the government, of US$95 a tonne by mid next year instead of the fall to US$55 assumed by the Treasury.


The forecast is somewhat above the Department of Industry’s new July forecast of US$95 a tonne by the end of this year trending down to US$61 by the end of 2020, but are way in excess what was forecast in the budget. A sensitivity analysis included in the budget said that for every US$10 that the iron ore price was higher than budgeted, the government’s tax take would be A$1.1 billion higher in 2019-20 and A$3.7 billion higher in 2020-21.

The panel expects the Australian dollar to remain broadly where it is at just below 70 US cents as the upward push from strong commodity prices offsets the downward push from domestic economic weakness.

Yet despite the iron ore price and lower borrowing costs the panel expects a much weaker budget outcome than the A$7.1 billion surplus forecast in April.

Its average forecast is for a surplus of only $1.7 billion, which is a mere sliver of GDP (0.1%), practically indistinguishable from a deficit of the same amount.


The forecasts come after Finance Department figures for May released on Friday raised the possibility of an early return to surplus in 2018-19. They suggest that surplus is at risk in 2019-20 and beyond, both because of economic weakness and an because of an increasingly urgent need to respond to that weakness through spending or further tax cuts.

Asked whether should the government strive to continue to deliver its promise of a surplus if economic growth remains weak or weakens further, former OECD director Adrian Blundell-Wignall replied bluntly, “of course not”.

The only panellists prepared to defend the continued pursuit of a surplus in the economy remained weak or weakened were Ross Guest, who said it was a worthwhile aim given the steady rise in government debt to GDP ratio, and Tony Makin, who qualified his reply by saying the surplus should be achieved by pruning unproductive expenditure such as industry assistance rather than deferring tax cuts.

Former government minister Craig Emerson regretfully forecast that the government would deliver a surplus whatever the economic circumstances, for political reasons.

PDF OF RESULTS

The Age and Sydney Morning Herald did not conduct a 2019-20 economic survey.


The Conversation 2019-20 Forecasting Panel

Click on economist to see full profile. Forecasts as of June 24, 2019.

The Conversation


Peter Martin, Visiting Fellow, Crawford School of Public Policy, Australian National University

Wes Mountain/The Conversation, CC BY-ND

This article is republished from The Conversation under a Creative Commons license. Read the original article.

Read more >>

Tuesday, June 04, 2019

The Reserve Bank will cut rates again and again, until we lift spending and push up prices

The Reserve Bank cut interest rates on Tuesday because we aren’t spending or pushing up prices at anything like the rate it would like. And things are even worse than it might have realised.

As the board met in Martin Place in Sydney, in Canberra at 11.30 am the Bureau of Statistics released details of retail spending in April, one month beyond the March quarter figures the bank was using to make its decision.

They show the dollars spent in shops fell in April, slipping 0.1%, notwithstanding weakly growing prices and a more strongly growing population.

The March quarter figures the board was looking at were adjusted for prices. They show that the volume of goods and services bought, but not the amount paid for them, fell in seasonally adjusted terms during the March quarter.

Adjusted for population, the volume bought would have fallen further.

We’ll know more on Wednesday

The Bureau of Statistics will release population-adjusted figures as part of the national accounts on Wednesday.

The figures for the September quarter show that income and spending per person barely grew. The figures for the December quarter show income and spending per person fell.

A second fall in the March quarter will mean two in a row – what some people call a per capita recession.


Australian National Accounts

Even unadjusted for population, economic growth is dismal.

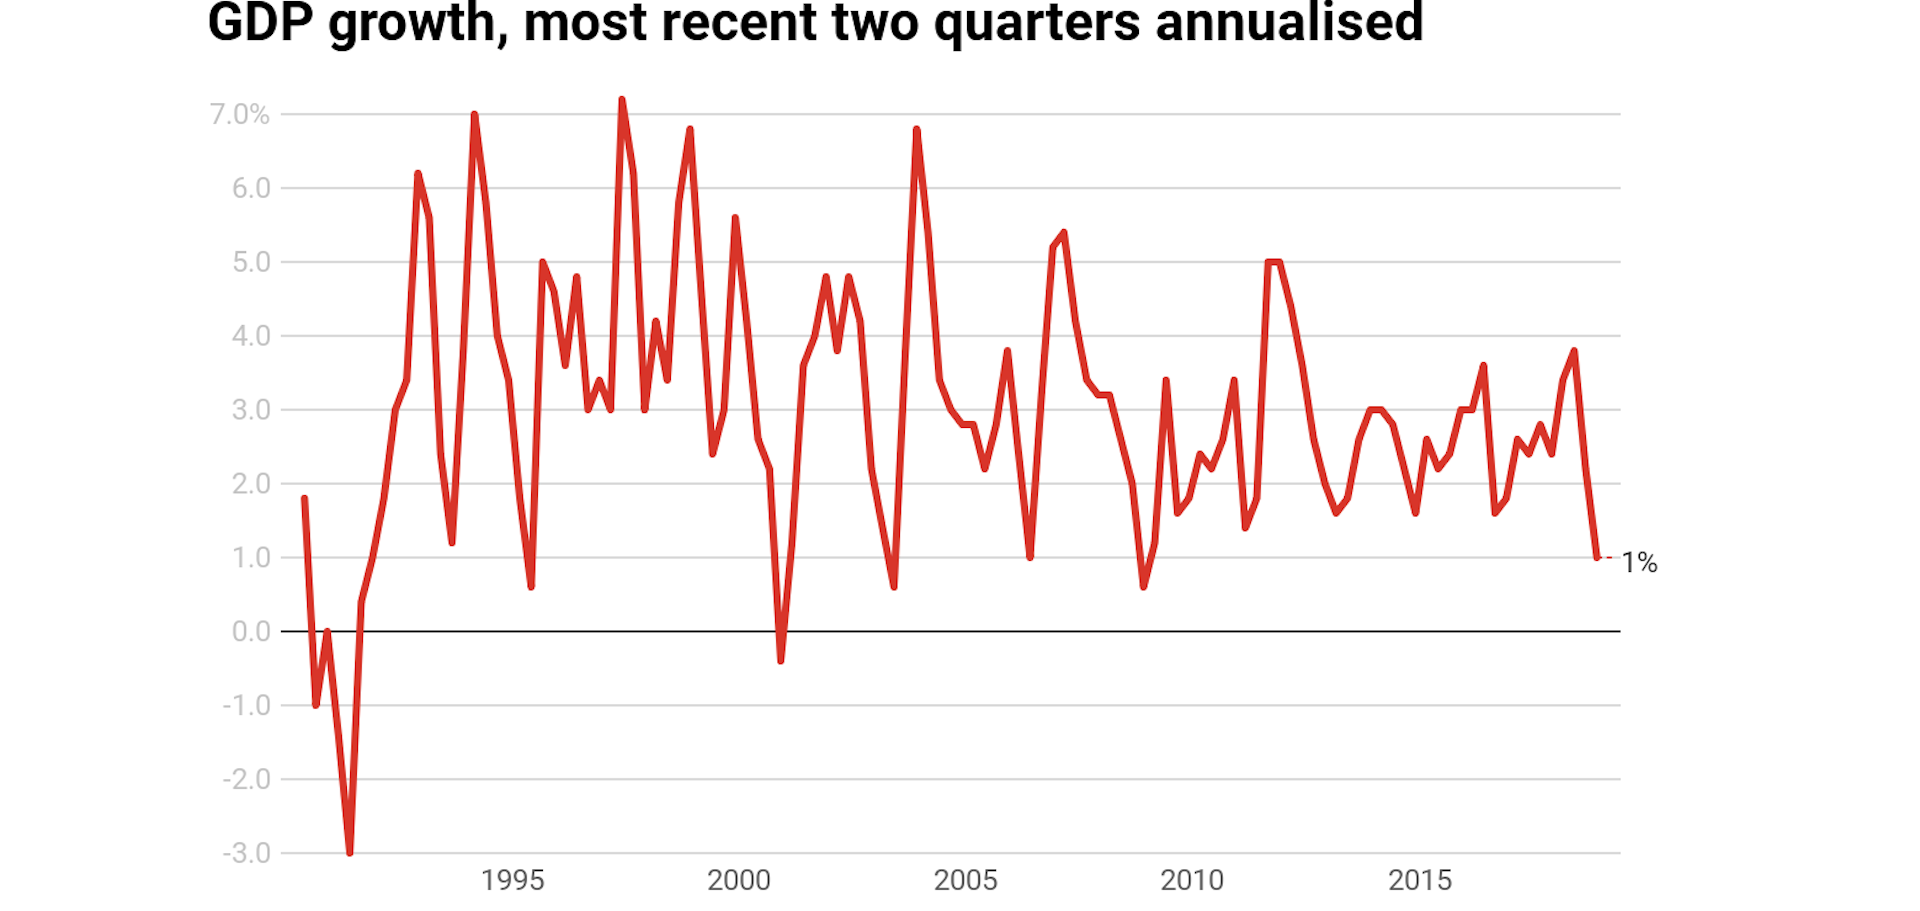
During the September and December quarters the economy grew just 0.3% and 0.2% – an annualised rate of just 1%.

That’s well short of the 2.75% the treasury believes we are capable of, and the lower than normal 2.25% it has forecast for the year to June.


Australian National Accounts

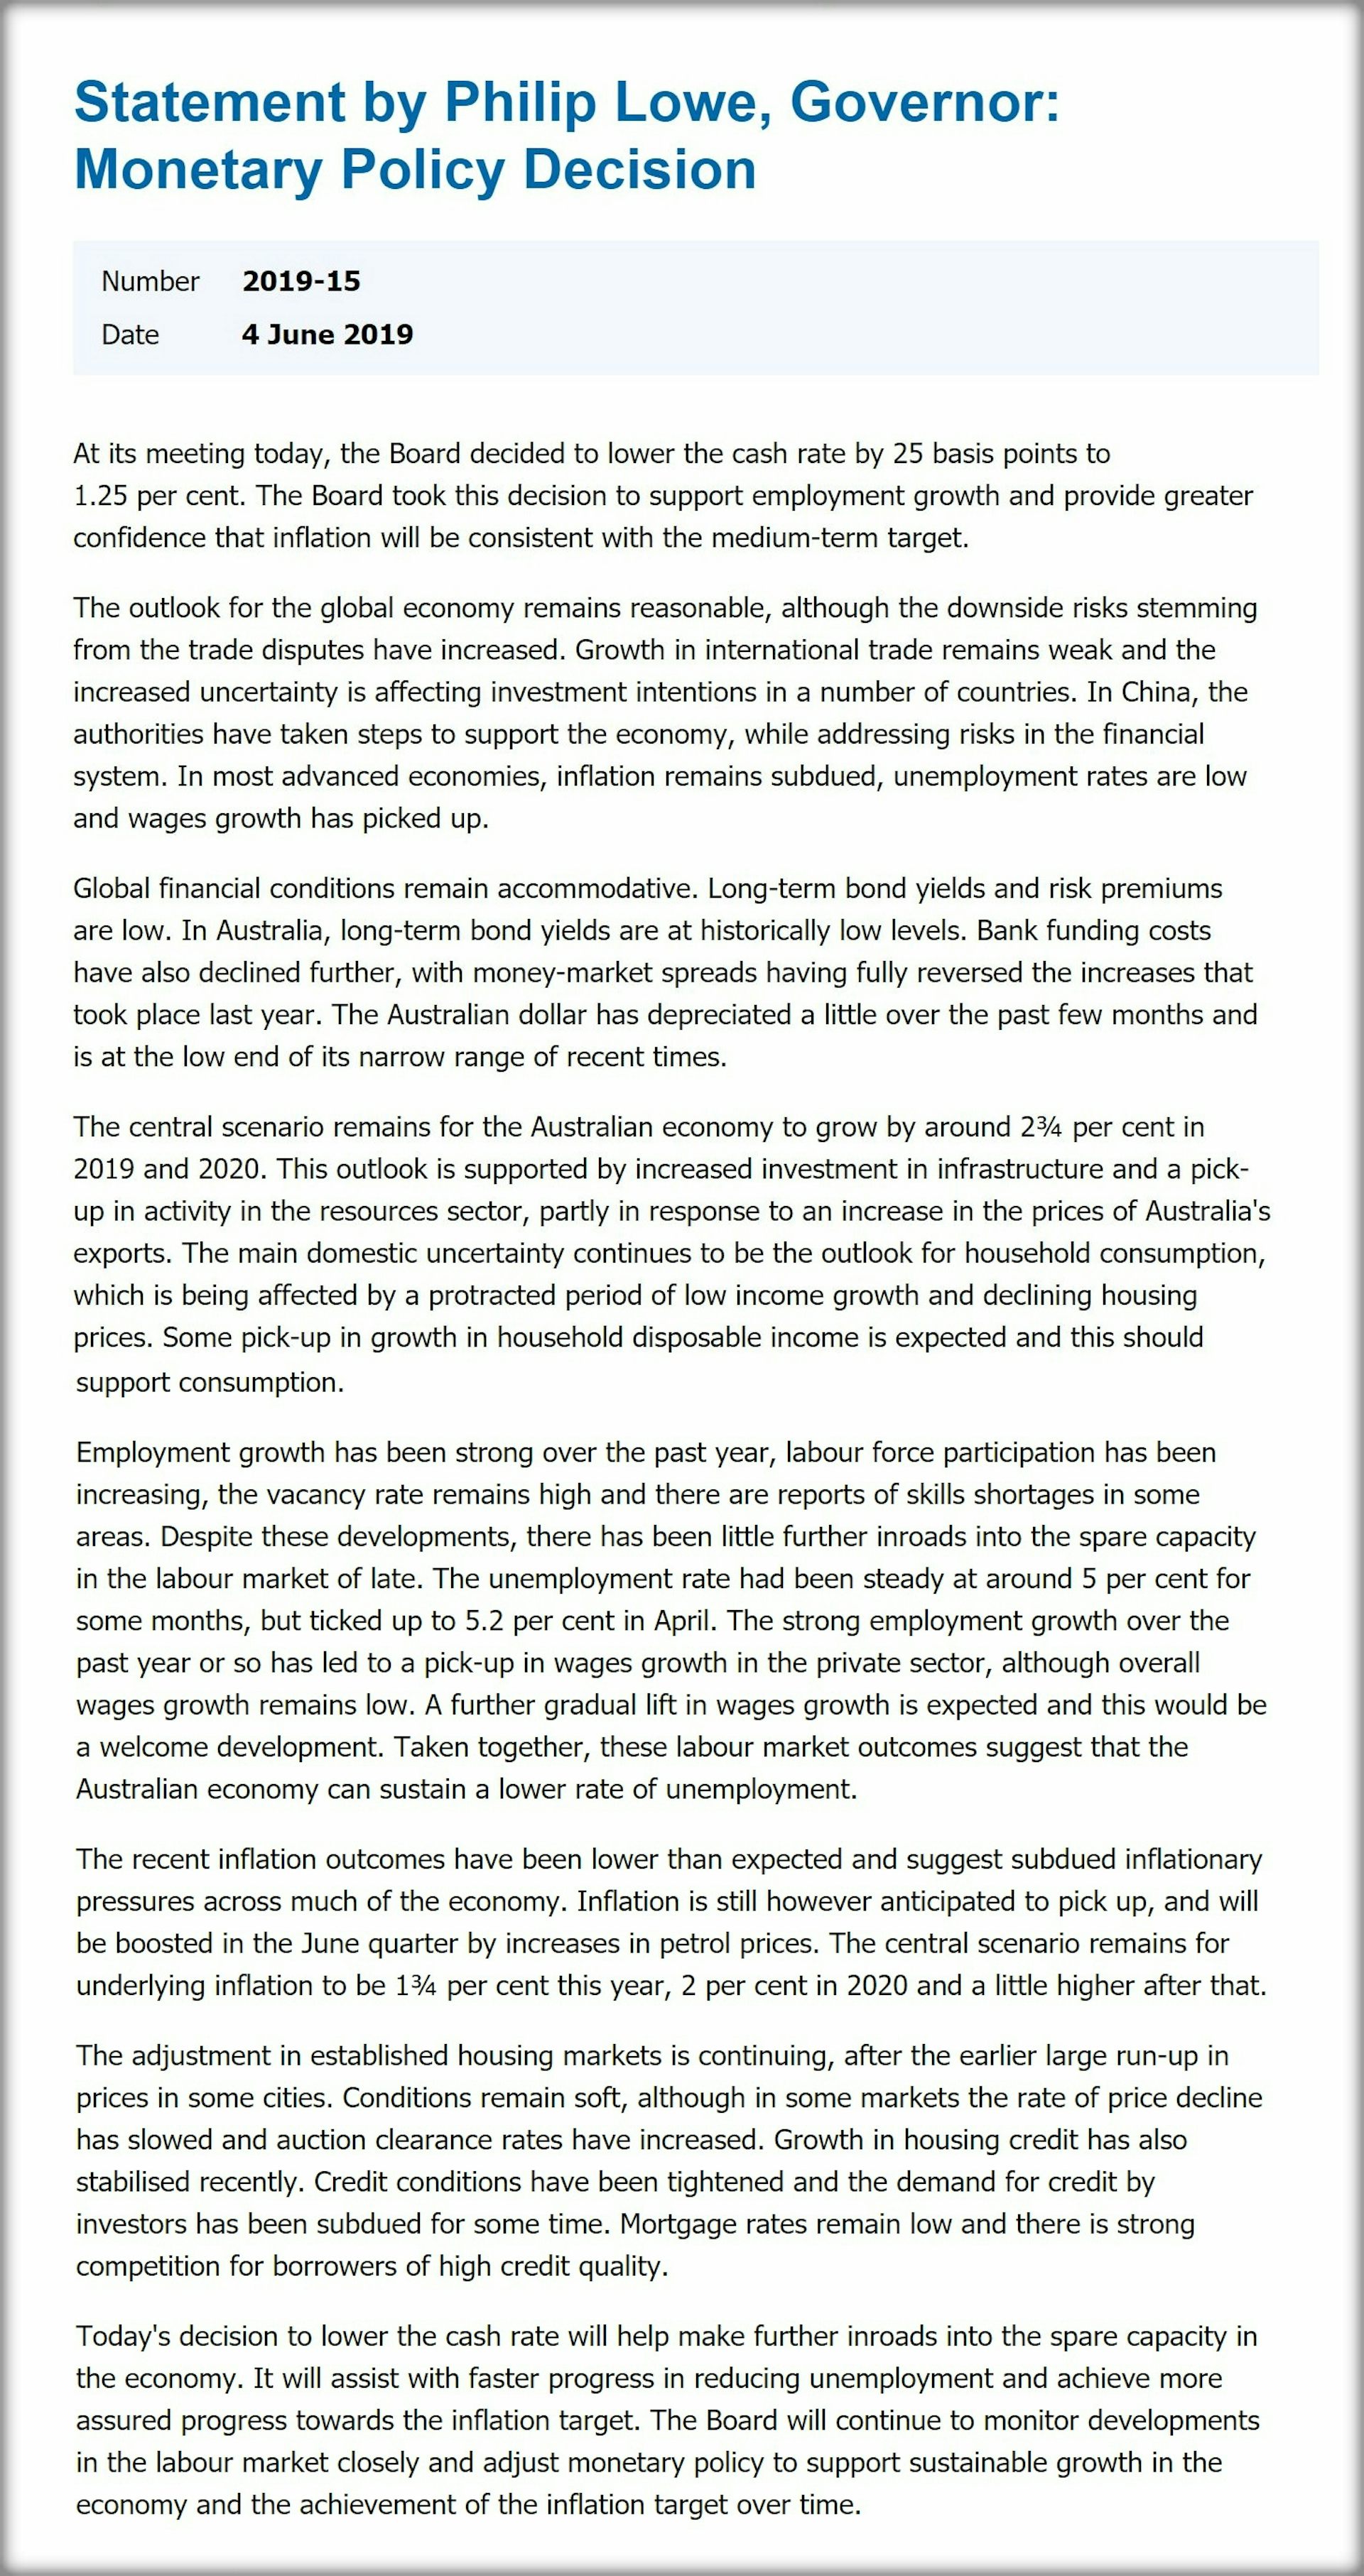
We’ve been doing it by ourselves. As Reserve Bank Governor Philip Lowe said in announcing the rates decision on Tuesday:

The main domestic uncertainty continues to be the outlook for household consumption, which is being affected by a protracted period of low income growth and declining housing prices.

The bank wants both inflation and employment higher, and it wants us to spend more in order to do it. Lower rates should help, although not for everybody.

Lowe acknowledged this in a speech to a Sydney business audience on Tuesday night, but he said households paid two dollars in interest for every one dollar of interest they received. So while rate cuts hurt savers, they benefit borrowers by more, and over time should benefit all households by boosting the economy. They also drive the dollar lower, making Australian businesses more competitive.

Tuesday’s cut should free up an extra A$60 a month for a typical mortgage holder. Another one will free up a total of A$120.

It’s not much, and there’s doubt about whether it will do much, but interest rates are about the only tool the Reserve Bank has.

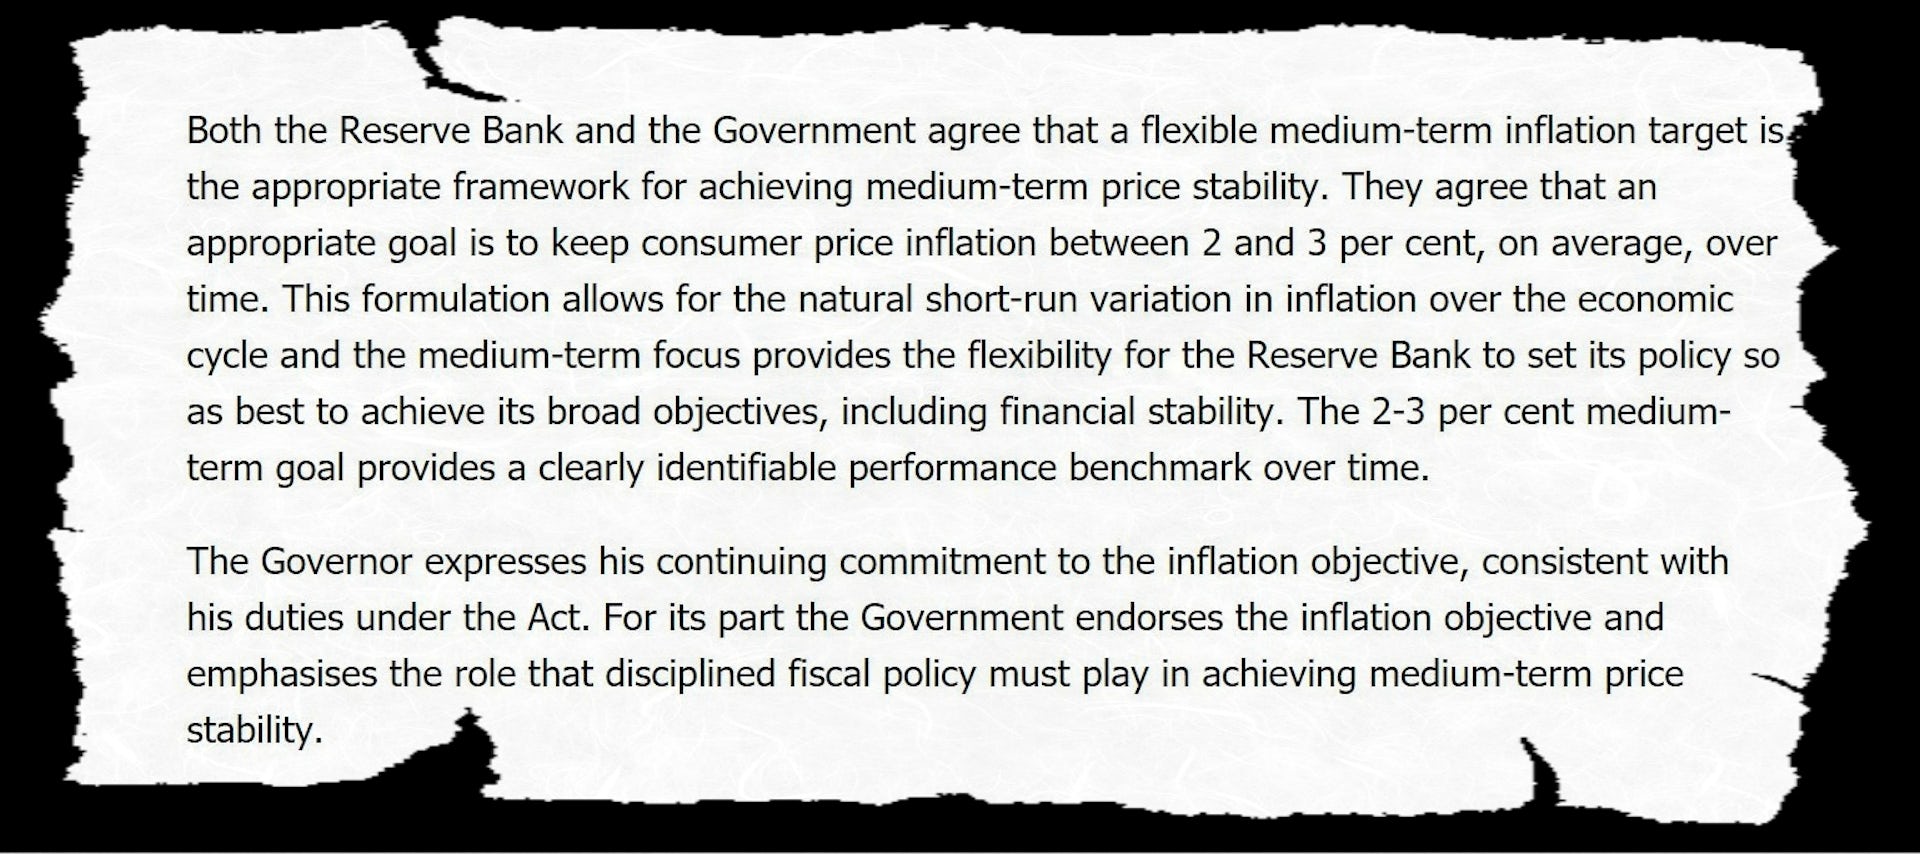
It is required by its agreement with the government to aim for an inflation rate of between 2% and 3%, “on average, over time”.

Reserve Bank of Australia

Uncomfortably for Governor Lowe, underlying inflation (abstracting from unusual moves which are quickly reversed) has been below 2% ever since he was appointed governor in late 2016.

Explaining his push for higher inflation to a business audience in Sydney on Tuesday night he said that while adherence to the target was intended to be flexible, that flexibility was “not boundless”.

If inflation stays too low for too long, it is possible that inflation expectations move lower – that Australians come to expect sub-2% inflation on an ongoing basis. If this were to happen, it would be harder to achieve the medium term inflation goal. So we need to guard against this possibility.

He is also required to aim for full employment.

He told the business audience that while for some years the bank and others had thought full employment meant an unemployment rate of 5%, the absence of inflation at 5% and the persistence of underemployment (where people wanted more hours) meant it could and should go lower.

Our judgement now is that we can do better than this – that we can sustain an unemployment rate of 4 point something.

Lower interest rates should help by making it easier for businesses to borrow to expand, and giving consumers something in their pockets to buy from them.

If you don’t succeed…

If that doesn’t happen, the bank will cut again.

Tuesday’s statement as good as said so:

The board will continue to monitor developments in the labour market closely and adjust monetary policy to support sustainable growth in the economy and the achievement of the inflation target over time.

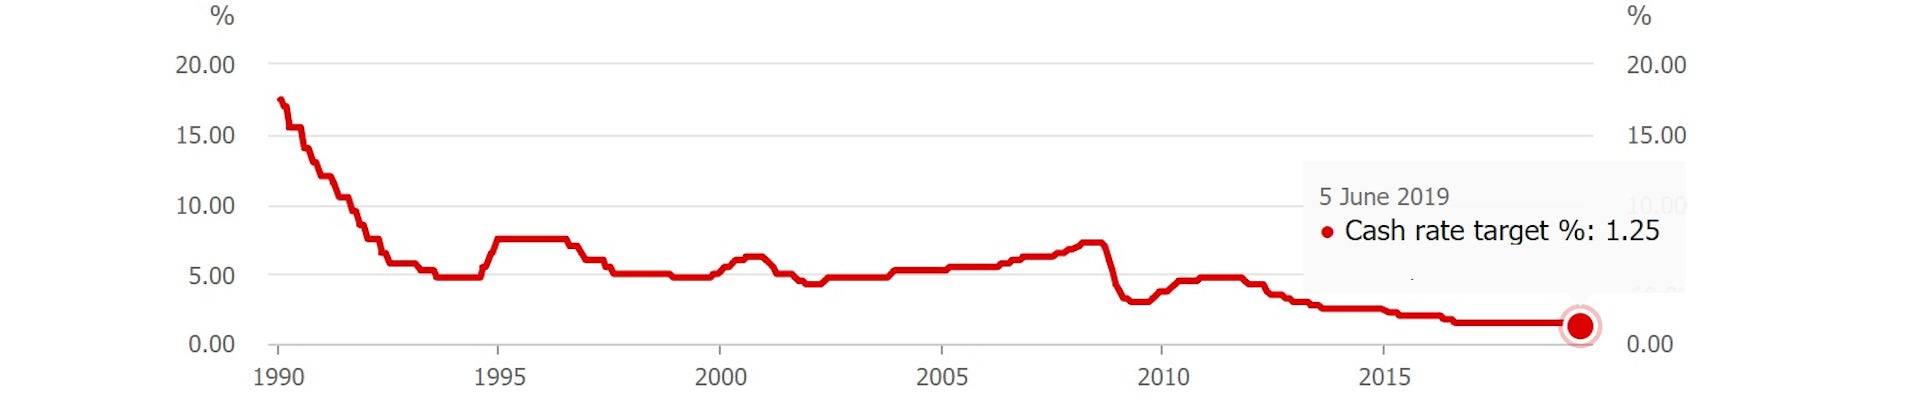
Tuesday’s cut and the next will take the bank into uncharted waters, where its so-called cash rate – what it pays to banks to deposit money with it overnight – is close to zero.

As far as can be discerned it has never been that low in the 100+ years the Reserve Bank has been in operation, originally as the Commonwealth Bank of Australia.


Reserve Bank cash rate since 1990
Reserve Bank of Australia

Should inflation still not pick up and employment still not fall as far as it believes it could, it will have to effectively cut its cash rate below zero, forcing cash into the hands of banks by aggressively buying government bonds, giving them little choice but to lend it to households and businesses, in a process known as quantitative easing. It has been done in the United States, Europe, the United Kingdom and Japan, and is by now anything but unconventional.

Governor Lowe would prefer the government to pull its weight by cutting tax and boosting spending, especially on infrastructure, and by policies that make Australia more productive.

He said so on Tuesday night

the best approach to delivering lower unemployment and a stronger economy is through structural policies that support firms expanding, investing, innovating and employing people. As we ease monetary policy, it is in the country’s interest that other policy options are considered too.

Treasurer Josh Frydenberg gets it.

He pointed out on Tuesday that the yet-to-be-approved tax offsets in the budget will give Australians on up to A$126,000 a cash bonus of up to A$1,080 when they submit this year’s tax return, far more than the rate cut.

His biggest concern, and the biggest concern of the governor, might be that they don’t spend it. Another concern would be that the banks don’t pass the rate cut on.

The ANZ has said it will only cut mortgage rates by 0.18 points instead of the full 0.25, a decision Frydenberg said “let down” customers. Westpac has cut by only 0.20 points. The National Australia and Commonwealth banks have passed on the cut in full.

On Tuesday night in Sydney Governor Lowe addressed the question of whether the banks should have passed on the full cut head on:

My usual practice in answering this question has been to explain that there are a range of other factors that influence mortgage pricing, and then say “it all depends”.

Today, though, I would like to break with my usual practice and provide a clearer answer. And that is: Yes. There has been a substantial reduction in the cost of banks raising funds in wholesale markets. Average rates on retail deposits have also come down.

This means that the lower cash rate should be fully passed through into standard variable mortgage rates. Full pass-through would also mean that the economy receives the full benefit of today’s policy decision.

The Governor is concerned that, for their own reasons, lenders such as ANZ and Westpac are forcing him to cut rates lower than he should and making an already difficult job harder.

If he has to cut further he will, but with the cash rate at just 1.25%, he would dearly love not to have to.

Reserve Bank of Australia

Read more: Cutting interest rates is just the start. It's about to become much, much easier to borrow The Conversation


Peter Martin, Visiting Fellow, Crawford School of Public Policy, Australian National University

This article is republished from The Conversation under a Creative Commons license. Read the original article.

Read more >>

Monday, May 20, 2019

Their biggest challenge? Avoiding a recession

Albo, or Plibersek, or whoever turns out to be the next Labor leader, might have had a lucky accident. Usually, it’s Labor that inherits an economy turning down.

This time, it’s the Coalition. And because of regular updates from the Reserve Bank and the Bureau of Statistics strikingly at odds with their public position that the economy is strong, they ought to be finely attuned to it.

Economic growth, the catch-all that is supposed to show us where the economy has been and where it is headed, is frighteningly small.

The Treasury’s best estimate of potential growth – how strongly the economy could be growing over time if things were well managed – is 2.75% per year.

The reality, for the two most recent quarters for which we have data, is 0.3% and 0.2%.

The economy is anaemic, despite the crowing

If you add those two numbers together and multiply by two you discover that for six months the economy has been growing at an annualised pace of just 1% – way, way short of its potential.

Stripping out population growth and minimal price growth, real living standards have been going backwards.


The result of what the Reserve Bank describes as “persistently slow growth in household incomes and declining housing prices” has been something of a strike in consumer spending. The real value of spending per household hasn’t been falling, but it hasn’t really been climbing either.

The bank says consumption growth has slowed most noticeably for discretionary items that tend to have the strongest relationship with home buying, such as furnishing and household equipment. It says growth in other types of discretionary spending, such as eating out, has also slowed. Consumption of so-called “essential” items is holding up.

We’re going to need a boost

It means we can’t rely on household spending to revitalise the economy (although the government will give it a go, stumping up a bonus of as much as $1,080 to be delivered with each tax return from July in a much-needed boost that will be disguised as a tax cut rather than spending).

Household spending accounts for three-fifths of gross domestic product. The bank identifies uncertainty over household spending, which itself derives from uncertainty over income growth, as a “key risk” for economic growth:

Should households conclude that low income growth will be more persistent than previously expected, households may adjust their spending by more than currently projected and consumption growth could remain weak for a longer period.

Labor would have helped stabilise uncertainty over income growth by immediately intervening before the Fair Work Commission to get higher wages, directing it to draw up a long-term strategy for higher wages, restoring cut penalty rates, and funding the increases of some childcare workers itself.

Having won an election opposing those things, the Coalition will have to try other things, perhaps even bigger and earlier tax cuts.


Prayer would help – prayer that international commodity markets remain strong, that the Reserve Bank cuts rates on June 4 (it is practically certain to), that it cuts them again before the end of the year (financial markets are literally 100% certain that it will) and that home prices stabilise.

Perhaps a very big boost

On the face of it, none of these would be enough to force economic growth back up. If it falls even further and continues to fall, Australia will enter a recession within this term of government, an outcome to which the academic economists polled by The Conversation in January assigned a 25% probability.

So far employment growth has been the economy’s brightest light, but in its quarterly update released a week before the election the Reserve Bank pointed out that employment growth can lag economic growth by up to nine months, meaning it might be about to turn down, although it added that it was not unusual for “trends in GDP growth and the labour market to diverge for sustained periods”.

If employment growth does turn down (and the bank says “near-term leading indicators of labour demand have softened”) it is likely to happen first in the construction and retail industries. The construction jobs will come again (and the government is doing its best to bolster them with promises of spending on infrastructure) but the retail jobs might never return, the nature of retailing having changed.

The economy matters more than the surplus

If needed in order to avoid a recession the government will have to be prepared to abandon its promised 2019-20 budget surplus. If the prospect of a recession does loom, it’ll have the political cover. And if it looms early in its term, it might still be able to deliver a budget surplus by the end.

Scott Morrison and his treasurer, Josh Frydenberg, were elected to manage the economy, and that means doing whatever is needed to avoid a recession and the long-term damage to lives and living standards it would deliver.

Speaking personally, I’ve no doubt they are up to the task, just as Labor would have been. In a way it’s a pity they didn’t adopt one of Labor’s key economic promises, which was to have a new budget in August, to refresh things.

And it matters more than superannuation

And they’ve got to focus on lifting living standards over the longer term where, conveniently, they have a big advantage over Labor.

Labor has a blindspot when it comes to superannuation. It wants to lift compulsory contributions from 9.5% of salary to 10% on July 2021, and then by another 0.5% the next year and another 0.5% the next year and so on for five consecutive years, apparently regardless of what it will do to incomes now.

It’s a good thing that, unlike Labor, the Coalition will be relaxed about pushing out the timetable if the economy can’t stand it, as it has done before.


Read more: The next government can usher in our fourth decade recession-free, but it will be dicey


Before the election it was preparing to respond to the landmark Productivity Commisson report that found that unintended multiple accounts and the defaulting of new workers into entrenched underperforming funds were costing members an extraordinary A$3.8 billion per year.

The Coalition can set up super for the future

Weeding out the chronic underperformers, clamping down on unwanted multiple accounts and insurance policies, and letting workers choose funds from a short menu of good funds and stay in them for life would give the typical worker entering the workforce an extra A$533,000 in retirement.

The commission recommended a full-blown independent inquiry into how much superannuation we need.

Labor, wedded to a series of increases, would never have done it. The Coalition can.


Read more: No surplus, no share market growth, no lift in wage growth. Economic survey points to bleaker times post-election The Conversation


Peter Martin, Visiting Fellow, Crawford School of Public Policy, Australian National University

This article is republished from The Conversation under a Creative Commons license. Read the original article.

Read more >>

Friday, May 10, 2019

Labor's costings broadly check out. The days of black holes are behind us, thankfully

Is there a “big black hole” in Labor’s election costings? It’s unlikely.

The final campaign before the arrival of the Parliamentary Budget Office in 2012, the 2010 Gillard versus Abbott contest, was full them.

Abbott was in opposition, Joe Hockey was his treasury spokesman. A treasury analysis of the costings document he produced, delivered to the newly-elected independent members of parliament to help them decide who would form government found errors including double counting, purporting to spend money from funds that sweren’t there, using the wrong time period to calculate savings, and booking debt interest saved from a privatisation without booking the dividends that would be lost.

All up, the mistakes were said to amount to A$11 billion.

Opposition costings used to be awful

In order to give his calculations a veneer of respectability Hockey engaged two accountants from the Perth office of a firm then known as WHK Horwath and wrongly said they had audited them.

“If the fifth-biggest accounting firm in Australia signs off on our numbers it is a brave person to start saying there are accounting tricks,” he told the ABC. “I tell you it is audited. This is an audited statement.”

It wasn’t. The letter of engagement later seen by Fairfax Media explicitly said the work was “not of an audit nature”. Its purpose was to “review the arithmetic accuracy” of Hockey’s work.

The Institute of Chartered Accountants later fined the two accountants who it found had breached professional standards by allowing their work to be represented as an audit.

Three years on, with the Parliamentary Budget Office in place, Hockey’s costings were comparatively controversy-free, as were Chris Bowen’s when Labor was in opposition in 2016.

Now, they’re fairly controversy-free

Costings have become straightforward. The Parliamentary Budget Office prepares the best possible estimate of the cost of each policy, then a panel of eminent Australians goes over its calculations and adds the costs together.

Labor’s panel this time was the same as its panel last time: Professor Bob Officer, who chaired the commissions of audit for the Howard and Kennett Coalition governments, Dr Michael Keating, who used to head the department of prime minister and cabinet and finance under the Hawke and Keating governments, and company director James MacKenzie.

They found the Parliamentary Budget Office costings to be “of a similar quality as budget estimates generally”.

They provided “a reasonable basis for assessing the net financial impact on the Commonwealth budget”.

Labor’s costings are propped up by savings

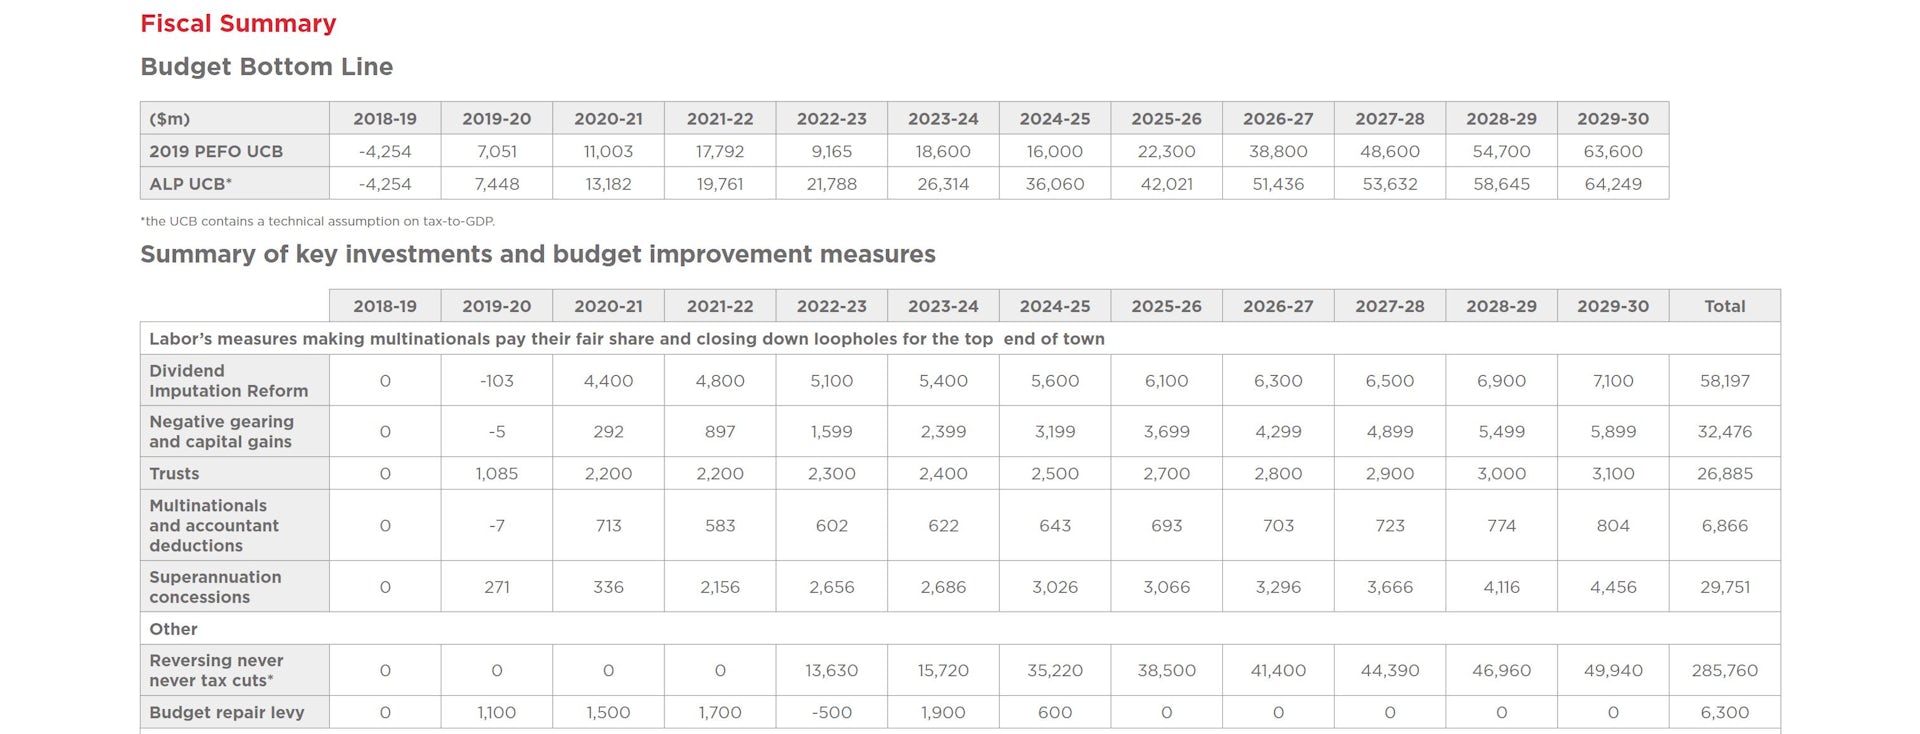
That impact was a return to “strong surplus” of $22 billion under Labor in 2022-23, four years ahead of the Coalition, in a year which the Coalition is forecasting a surplus of less than half the size – $9.2 billion.


Extract from Labor’s costings document. Australian Labor Party

Labor is able to do it because it will raise (or avoid spending) more than the Coalition. Over ten years it will save

  • $58 billion by winding back payouts of dividend imputation cheques to people who don’t pay tax

  • $32.5 billion by winding back negative gearing and capital gains tax concessions

  • $29.8 billion by reducing superannuation tax concessions

  • $26.9 billion by more fully taxing trusts

  • $6.9 billion by cracking down on multinational tax avoidance and the use of high fees for tax advice as tax deductions, and

  • $6.3 billion from reintroducing for four years the Coalition’s temporary budget repair levy of 2% on the part of high earners’ income that exceed $180,000

Treasurer Josh Frydenberg attacked the costing saying Labor had confirmed “$387 billion in higher taxes; higher taxes on retirees, higher taxes on superannuants, higher taxes on family businesses, on homeowners and renters and low-income earners,” which it had, although it had hardly been a secret.

The tax measures are how Labor builds its bigger surpluses.

The best an opposition can produce

Frydenberg said Labor had failed explain the “economic impact these higher taxes will have across the economy”, a charge Labor had responded to earlier by saying that wasn’t a service the Parliamentary Budget Office provided.

It was work the treasury was able to do, but the resources of the treasury weren’t available to the opposition.

Besides which, a fair chunk of those savings would be spent, on programs such as Labor’s Medicare cancer plan, its pensioner dental plan, extra hospital funding and greater childcare subsidies. They would boost the economy.

Unlike the Coalition, Labor isn’t locking in tax changes years out into the future (although its costings set aside $200 billion for extra tax cuts at some point over the next ten years); it is giving itself flexibility in order to manage the economy as needed when the time came.


Read more: Why Labor's childcare policy is the biggest economic news of the election campaign


Frydenberg identified as the “big black hole in Labor’s costings”, what he said was its “failure to account for the increase in spending that they have promised with changes to Newstart, to aid, to research and development”.

Four years out is conventional

It wasn’t much of black hole. Labor has not promised changes to the Newstart unemployment benefit – it has instead promised to review it. Without the result of the review or without an indication of how much Newstart might be lifted or when it would be lifted, it’d be a hard thing to cost.

Frydenberg’s other beef was with programs Labor’s document costed in detail for four years but not in detail for ten. But that is how his own budget presented its figures. It’s how every previous budget has presented its costings.

Since the late 1980s it’s been the convention to cost programs in detail only four years ahead. Before that, the budget convention was to cost programs in detail only one year ahead.


Read more: Mine are bigger than yours. Labor's surpluses are the Coalition's worst nightmare


It is possible that Labor’s costings document is less than perfect. It is possible that the three eminent Australians who lent their names to it have been hoodwinked. But the contours of the document are clear. Labor will tax more and spend more than the Coalition, and deliver bigger surpluses.

But it only plans to tax more up to a certain point: 24.3% of gross domestic product, which was the tax take in the final year of the Howard government. The Coalition’s limit is 23.9% of GDP, which will mean it finds it harder than Labor to build up a big surplus quickly.

The days of black holes are behind us, thankfully.The Conversation


Peter Martin, Visiting Fellow, Crawford School of Public Policy, Australian National University

This article is republished from The Conversation under a Creative Commons license. Read the original article.
Read more >>

Mine are bigger than yours. Labor's surpluses are the Coalition's worst nightmare

On Friday morning the Coalition’s worst dream will come true.

All throughout the campaign, and all through the two terms in office and three prime ministers and three treasurers who preceded it, they’ve argued they are better than Labor at managing money. They had budget surpluses under Howard that Labor didn’t have under Rudd and Gillard.

In the last election, Labor allowed them to get away with it. Its costings document actually forecast a better budget position than the Coalition’s over ten years (because it rejected the Coalition’s expensive company tax cuts) but a worse position over the immediate four-year “forward estimates”, because of its more generous programs.

The Coalition focused on the four years, not the ten, and painted Labor as irresponsible.

Bigger, sooner surpluses

On Friday morning, Labor won’t make the mistake again. Yes, it’ll detail (and have year-by-year costs for) programs that are more generous than the Coalition’s, among them cheaper childcare, its Medicare cancer plan and its pensioner dental plan.

But it’ll be able to more than pay for them in every one of the next ten years because of a number of courageous decisions that’ll save money, the most financially important of which is the decision to stop sending company tax refund cheques to people who don’t pay tax. It’ll save A$5 billion in the first year and more in future years because the cost of the refunds has been ballooning.

The result will be a larger budget surplus in every one of the next ten years, including each year of the forward estimates and including the financial year about to start, which is when the budget is scheduled to return to surplus.


Read more: Words that matter. What’s a franking credit? What’s dividend imputation? And what's 'retiree tax'?


So big will be these bigger surpluses that Labor has its budget on track to hit the Coalition’s target of 1% of gross domestic product four years earlier than the Coalition in 2022-23 rather than 2026-27.

That means that in Labor’s first budget, which it will deliver in August this year if elected as a means of resetting forecasts, its projections will show the long-awaited surplus of 1% of GDP within the forward estimates, rather than beyond them as in the Coalition’s budget.

Labor’s 1% of GDP will be A$22 billion, twice the surplus of $9.2 billion the Coalition plans to deliver in that year.

All Labor needed was courage, and the ability to withstand complaints from people who own shares but don’t pay tax and are naturally upset about losing government cheques they’ve become used to.

And lower government debt

Bigger surpluses and the much more rapid delivery of a substantial surplus will mean much quicker reductions in government debt. The budget had the government on track to eliminate net debt by 2030. Labor’s costings will have it on track to eliminate it much sooner.

Despite what the Coalition would like to claim, the key reason Labor’s surpluses will be bigger isn’t that Labor won’t be matching its longer-term tax cuts. Bracket creep means tax rates need to be cut or thresholds adjusted from time to time to ensure the personal tax take doesn’t climb too high. Labor’s costings recognise this, including a built-in assumption of tax cuts after the tax take hits 24.3% of GDP, a figure cunningly selected because it was the tax take when Howard left office.

If delivered as income tax cuts, at about the time the Coaltion’s high-end tax cuts are due, it’ll cost A$200 billion, but the method of delivery will depend on circumstances at the time.

With future tax cuts baked in

Labor’s “technical assumption” that the tax take won’t climb beyond 24.3% of GDP is different to the Coaltion’s “guarantee” that it won’t climb beyond 23.9% of GDP. It is a technical assumption rather than a promise, of the kind usually included in budget documents as a way of allowing for inevitable future tax cuts.

Without it, Labor’s surplus projections would have been much bigger and would have been hard to believe. With it, the projections should be credible.


Read more: Election tip: 23.9% is a meaningless figure, ignore the tax-to-GDP ratio


The secret sauce in Labor’s better budget projections isn’t that it isn’t adopting the Coalition’s tax cuts. It is that it’s tackling the handing out of billions of dollars in dividend imputation cheques to people who don’t pay tax in a way the Coalition wasn’t prepared to.

Not that it didn’t think about it. A file list seen by Fairfax Media shows Treasury created a file entitled “Tax Policy - Dividend Imputation” in the lead-up to then Treasurer Scott Morrison’s 2017 budget.

The tax reform discussion paper commissioned by his predecessor, Joe Hockey, found “revenue concerns with the refundability of imputation credits”.


Read more: Vital Signs: When it came to the surplus, both Bill and Scott were having a lend The Conversation


Peter Martin, Visiting Fellow, Crawford School of Public Policy, Australian National University

This article is republished from The Conversation under a Creative Commons license. Read the original article.
Read more >>