Tuesday, August 30, 2022

What is productivity, and how well does it measure what we do?

One word gets mentioned more than “jobs” and more than “skills” in the briefing paper for Thursday’s jobs and skills summit. It’s “productivity”.

Which is odd, because although many of us think we know what productivity is, and although many more assume productivity can be easily measured, it’s a surprisingly slippery concept.

In a report released earlier this month, the Productivity Commission (yes, we have an entire commission devoted to productivity) makes the idea sound simple.

It presents an equation:

productivity = output divided by input

The commission makes the reasonable point that producing more output (of anything – flowers, healthcare, food) per unit of input, so long as the quality is maintained, ought to be the goal of life.

Who wouldn’t want to clean a house in five hours instead of ten? Who wouldn’t want to manufacture a car in five hours instead of ten?

Who wouldn’t want more for less?

You could use the freed-up time to kick back or make more of what you really want. And because you were producing more per hour worked, you would be in a good position to get a pay rise.

The commission is careful not to say you would get a pay rise. Instead it says that where there have been sustained pay rises above inflation, they have almost always been underpinned by increased productivity.

How much of the pay-off from an increase in output per hour worked goes to wages depends, among other things, on bargaining power.

Since 1990, the share of the spoils (technically, the share of total factor income) going to profits has climbed from 24% to 31%, while the share going to wages has fallen from 55% to 50%.


But it ought to be beyond doubt that the only guaranteed way to be able to lift living standards is to lift productivity. Beyond a certain point, working more hours won’t help, because, in the words of the commission, “there are only so many hours in the day to work”.

Nor will using more resources. They are finite. The only certain way to continue to get more of what we want is to get more from what we’ve got – which is the definition of productivity.

And just lately, productivity growth has slowed to a crawl, to what the briefing paper for the summit describes as the lowest rate in half a century.

Lifting productivity has become harder

It’s probably not because we’ve run out of ideas, although it might be because we used up a lot of good ones. Back when enterprise bargaining was introduced in the early 1990s, when we were asked to find improved ways of doing things at work in return for pay rises, we did it. But it became harder to keep finding gains as big.

More broadly, the extraordinary success of the productivity gains we made in manufacturing and agriculture have made them less important as employers. Now most of us (almost 90%) work in services. And services are hard to automate.

Worse still, it’s hard to tell what the output of many services is. There’s a reason the debate about the government’s commitment to defence is couched in terms of spending. It’s hard to tell what we get.

Productivity has become harder to measure

What about hairdressing? A hairdresser who trims twice as many heads per day isn’t necessarily twice as good, even if the quality of each trim remains the same. Part of a good hairdresser’s service is the quality of attention they offer each customer.

It’s the same for health care and education. That’s one of the reasons the Australian Bureau of Statistics doesn’t produce estimates of the productivity of the “health care and social assistance” or “education and training” industries, two of Australia’s biggest industries.

And many education and health services are provided free or subsidised, making the price charged an unhelpful measure of output.

(The bureau is planning to introduce “experimental” estimates of the productivity of the education industry next year, but it is finding it hard. It wants to define the output as the “organised communication of knowledge from teacher to student”, which gives an idea of how murky the whole idea is.)

Putting quality of work and life on the summit’s agenda

Economy-wide, the Productivity Commission relies on the bureau’s rough and ready measure: gross domestic product per hour worked, but it’s misleading for the same reason.

Labor came to office promising every Australian living in aged care would receive an average of 215 minutes of care per day.

When that happens, it will be a drag on measured productivity – on GDP per hour worked. Yet it will hugely improve the lives of Australians.

It makes sense for the summit to focus on productivity, given that measured productivity growth has slowed, but it should only be part of the conversation.

Other more personal things matter as well, among them the quality of our lives, the quality of our care, and the quality of our jobs – something those attending would be wise not to forget.The Conversation

This article is republished from The Conversation under a Creative Commons license. Read the original article.

Read more >>

Monday, August 29, 2022

Is education or immigration the answer to our skills shortage? We asked 50 economists

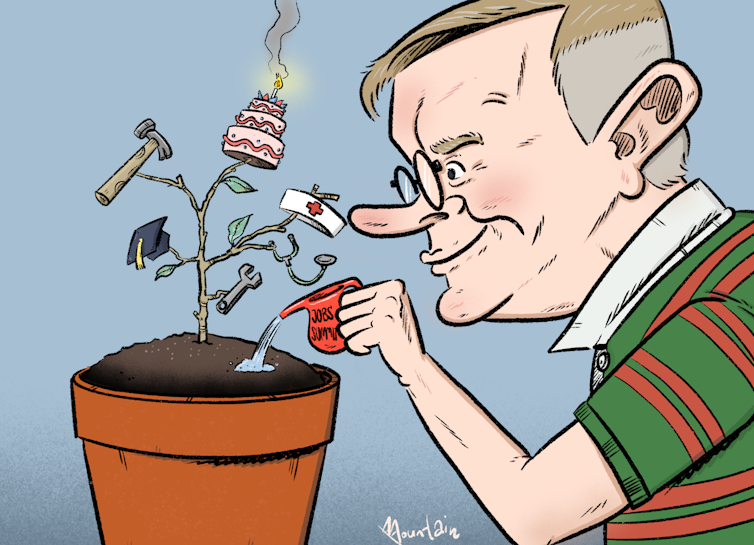
Wes Mountain/The Conversation, CC BY-ND
Investing in Australians’ education is far more important than immigration in resolving the nation’s skills shortages, according to leading economists surveyed in the lead-up to this week’s jobs and skills summit.

The 50 top Australian economists polled by the Economic Society of Australia and The Conversation are recognised by their peers as leaders in their fields, including economic modelling, labour markets and public policy.

Asked to select from a list of topics to be discussed at the summit, and which offered the most promise of delivering better outcomes, two-thirds picked “education and skills”. Only one-third picked “migration policy”.


The biggest concerns among those who picked “education and skills” relate to school and vocational education.

The Australian National University’s Bruce Chapman, who designed Australia’s higher education loans scheme (HECS) in the late 1980s, described funding for vocational education as a “mess”.

Vocational training is a “mess”

“There are up-front fees alongside no-charge regimes, both of which are poor and inequitable,” Chapman said. “A small number of courses offer income-contingent loans along the lines of the university scheme, but most do not.”

Universities have income-contingent loans that don’t require payments until the recipient’s income climbs above A$48,361.

If applied to all vocational education courses (including TAFE courses), it would allow reasonable charges and protect students from hardships and default.

“Governments should have been aware of this for the 34 years that HECS has existed, but have shown no leadership in the area,” Chapman said.

High school outcomes remain poor

Saul Eslake said all levels of Australian education – from primary school, up to vocational education and universities – are “failing to equip Australians with the skills required for the jobs of both today and the future”.

Among the many causes of that failure were inequities in how education funding is distributed, which have led to sustained gaps between Australia’s high and low socio-economic students’ results.

Paul Frijters suggested levelling the playing field between private and public schools by ditching subsidies to private schools, banning mobile phones in schools, and allowing children with low grades to repeat years instead of setting standards so low they were generally promoted.

Almost half of those surveyed wanted measures to promote productivity. Julie Toth, formerly with the Australian Industry Group and now with the digital property settlement company PEXA, suggested shifting governments’ focus away from “creating local jobs” to automating tasks wherever possible.

“We should be aiming to reduce the need for lower-skill and lower-value tasks and jobs, rather than simply seeking more bodies to do them,” she said.

Full working rights for refugees

Of those who nominated “migration policy” as a priority, two warned against using more migration to fix skills shortages. Labour market economist Sue Richardson said she knew of no evidence that migration increased either productivity or the living standards of pre-existing Australians.

“It does increase aggregate gross domestic product,” she said. “But that is just because the population is bigger”. It enabled Australia to avoid a close examination of why it did not generate the skills it needed itself.

Margaret Nowak of Curtin University pointed to the absurdity of not giving refugees and those awaiting determination an unfettered right to work. She said it would be an “easy early win”.

“We already have in this country a ready and willing supply of labour,” Nowak said. “We should get rid of the paranoia and ideology inherent in the current administration of the policy and welcome our resident refugees into full participation and education rights.”

Many economists also nominated workforce participation, care jobs and equal pay for women as key priorities for the summit.

Calibrating care

Several, including RMIT University’s Leonora Risse, called for more accurate measurement of the benefits generated by the care sector, “in the same way as we compute the cost/benefit dividend of government investments in other infrastructure”.

Risse said a proper measure of the economy-wide value of the care sector could be factored into the budget, and used to provide a mechanism to lift the wages and status of care workers.

Macquarie University’s Lisa Magnani said the pandemic had shown Australia has a crisis of care work “manifested in the shortage of teachers, in overworked hospital workers, in exhausted parents”. Traditional measures of labour productivity failed to capture the impact of care jobs on wellbeing, as well as their economic value.

Alison Preston of The University of Western Australia said health care and social assistance had become Australia’s biggest employing industry, eclipsing retail and construction.

Specific measures to assist the health care and social assistance sector’s 76% female workforce included extending parental leave, minimising the need to hold multiple jobs, and setting and monitoring employment standards.

One of the 50 surveyed economists nominated a summit priority that was not on the proffered list. John Quiggin of the University of Queensland nominated “full employment”, which he thought had been the original idea for the summit.

Regardless of the present state of the labour market it was important to renew to full employment in the 1945 Employment White Paper, and to consider measures along the lines of the proposed Green New Deal in the United States.


Detailed responses:


This article is republished from The Conversation under a Creative Commons license. Read the original article.

Read more >>

Tuesday, August 23, 2022

If the PM wants wage rises, he should start with the 1.6 million people on state payrolls

If Prime Minister Anthony Albanese really wants to boost wage growth, there’s a simple way to do it.

And if he did that one simple thing, analysis prepared for The Conversation shows some of our most trusted but least well-paid workers – teachers and nurses – could be among the wage winners.

During the election campaign, the Labor leader made a public push for wages growth. He held aloft a $1 coin and said that’s what his government would be asking for: a boost in the minimum wage from $20.33 an hour to $21.36, which would lift it 5.1%, which was the inflation rate at the time.

After the election that’s what the government asked for. The Fair Work Commission delivered slightly more for Australia’s lowest-paid – an increase of 5.2% – and somewhat less for higher earners: an increase of 4.6%.

Then the inflation rate climbed to 6.1%. That figure, for the year to June, far eclipsed total wage growth of 2.6% over the same period and rendered even what the commission had delivered out of date, sending real (inflation adjusted) wages backwards by the most in 25 years.

Next week’s Jobs Summit is, in part, an attempt to do something about wages. But the issues paper released ahead of the summit is curiously bereft of ideas about how.

The paper says wages have traditionally climbed with labour productivity (which is output per hour worked) and that productivity growth has fallen to its lowest in 50 years.

It says if businesses invested more in labour-saving technology and workers got a better mix of skills, productivity growth would climb, but (and it’s a big but) that growth would only flow through to wages “over the medium term”.

Which leaves… not much happening for wages in the meantime.

Silent on what the states should do

The other things the paper notes are that fewer workers are covered by enterprise agreements and more by Fair Work Commission awards (presumably because enterprise agreements have expired, or aren’t high enough) and that 23% of workers are casuals (a figure that hasn’t changed much in 20 years).

What the summit paper doesn’t mention, but ought to, is that governments set wages – the wages of their own employees.

The lowest-paid quarter of the workforce has its wages set by the Fair Work Commission, either via the minimum wage or awards.

The Fair Work Commission looks after these people by usually increasing their wages in line with the consumer price index, and often by more.


Private employers are offering more, where they can

Most of the rest of the workforce gets only what their employers agree to, and the good news here is that, increasingly, employers are offering more.

Two years ago, as COVID took hold, the private employers who did lift wages offered an average of 0.8%. One year later, in the year to June 2021, they offered 2.7%. In the year to June this year they offered 3.8%.

Of course many private employers can’t offer much. They are small, and are being squeezed by soaring costs.

But governments budget in billions, and can afford to offer whatever they think they should, covering it with tax or borrowing.

The Commonwealth government, under Albanese, employs one quarter of a million Australians. The states, with whom Albanese could have a word, employ 1.6 million – many of them teachers and nurses.

Yet far from increasing their wages in line with inflation, or even in line with private sector increases, Australia’s states have been extraordinarily stingy.

Governments are offering as little as 1.5%

Victoria’s wages policy, announced in January, is for a cap on annual increases of 1.5%. Western Australia, despite its large budget surplus, was limiting increases to 2.5%. In July it lifted the offer to 3% with a one-off $2,500 cost of living payment.

NSW has a ceiling of 3%, which falls back to 2.5% after two years. (And the NSW ceiling is lower than it seems. It includes employers’ super contributions, which are to climb by 0.5 percentage points a year for the next few years, making the quoted ceiling of 3% a ceiling of 2.5% for take-home pay.)

Using Bureau of Statistics figures to examine the increases actually paid (as opposed to offered) shows Western Australian public sector wages climbed just 1.1% in the year to June. South Australian public sector wages climbed 1.7%.

In Victoria and NSW, the increases were 2% and 2.1%. Only Queensland, which shelled out 4%, paid anything approaching the rate of inflation.

Nurses and teachers hit hard

This stinginess hits most the two biggest groups of state government employees: teachers and nurses.

Whereas public wages as a whole climbed 2.4% over the past year, the wages of public education and training workers climbed 2.2%.

A Bureau of Statistics breakdown prepared for The Conversation shows that in NSW and Victoria those workers (mainly teachers) got just 2%. In Victoria, health care and social assistance workers (largely nurses) got 1.7%.

Economic research suggests the states are stingy, in part because they can be. They are the only big employer of nurses, teachers, police and public servants.

The PM could have a word

If Albanese means what he says about wages keeping pace with inflation, his next step should be to ask his mates in the states to do more. Most of the premiers are from his side of politics. All of them will be at the Jobs Summit.

There are signs he is putting his own house in order. His departments have been told not to enter into new agreements while the previous penny-pinching wages policy is under review, and he has backed a big rise for aged care workers (whose wages the Commonwealth funds) in a submission to the Fair Work Commission.

But going easy on the states, as he has so far, while telling private sector employers with far smaller financial resources to lift wages, makes it look as if he is not serious.

If he genuinely believes wages ought to keep pace with inflation, he ought to name and shame his Labor mates.The Conversation

This article is republished from The Conversation under a Creative Commons license. Read the original article.

Read more >>

Tuesday, August 16, 2022

Why unemployment is set to stay below 5% for years to come

Unfathomably, Australia’s unemployment rate has sunk to 3.5%. Even harder to believe is that it will soon sink lower – perhaps even this week, when the update is released on Thursday – and after that, if the ANZ’s forecasts are correct, dip below the next threshold to two-point-something for the first time since 1974.

That this can be happening at a time when interest rates are soaring and households are tightening their belts belies standard analysis.

So what’s driving this new ultra-low unemployment? It’s been harder for employers to get workers, because borders were closed, and because of unusually high rates of people off sick.

But digging further into the economic data reveals something we haven’t seen before – which has already changed the lives of almost 100,000 Australians.

Time lost to illness has almost doubled

Even now, an awful lot of workers on whom employers normally depend are sick, or on reduced hours, caring for someone who is sick.

In the years before COVID (and in the first two years of COVID itself), typically 3% of the workforce worked less than usual hours in any given week as a result of illness or injury. Calculations by the University of Melbourne’s Jeff Borland suggest so far this year it’s been 5.2%.

The effect isn’t quite as dramatic when you examine the number of hours lost. Pre-COVID (and in the first two years of COVID) 2% of working hours were lost to illness. So far this year, with so many of us ill, it’s been 3.8%.

As a sign at a doctor’s surgery I visited the other day read:

The whole world is short-staffed, be KIND to those who show up.

Borland illustrates what sickness is doing to employment by talking about a cafĂ© with five staff. He says if one is away one day per week on average, the cafe might have to put on a sixth to cover – if it can. Unfilled vacancies are higher than ever.

It’s also true (at least until now) we’ve been spending big-time, spurred on by pent-up demand from when we were all in lockdown, as well as ultra-low interest rates and generous government support.

We escaped the jobless ‘escalator’

But there’s something else explaining our new ultra-low unemployment, something that flows from the nature of the labour market – and how it’s different from the market for goods in shops.

You can see it most clearly when unemployment climbs.

In the half century we have been collecting modern employment statistics, unemployment has shot up dramatically three times:

  • in the mid 1970s, when it jumped from 2.1% to 5.4% in a matter of months and never came back down

  • in the early 1980s, when it jumped from 5.3% to 10.3%, and took six years to come back down

  • in the early 1990s, when it jumped from 5.8% to 11.2%, and took seven years to come back down.


Each time, unemployment went up by the escalator, and down by the stairs.

Remarkably, as the graph shows, that’s not what happened during the global financial crisis or COVID. Instead, both times the government and Reserve Bank went hard and early with as much support as it took to prevent unemployment climbing too far.

If unemployment had shot up as it had in earlier crises, it might have taken the best part of a decade to get down.

The long-lasting scars of unemployment

Economists use an ugly word to describe the reasons why unemployment stays high long after the reason for high unemployment has passed. It’s “scarring”.

Each person who loses their job or who is unable to get a first job when unemployment shoots up can lose confidence and up-to-date work experience.

Then, as things improve and employers begin hiring again, people who have been out of work for longer get pushed back in the queue. Employers find it safer to take on new graduates or people with more recent experience.

The more those who were unlucky during a crisis get pushed to the back of the queue, the less employable they seem – and the less employable they become.

This puts a new higher “floor” under the unemployment rate, because it gets to the point where employers would rather not fill a vacancy than put on someone who’s been continually passed over.

It’s a phenomenon well known to the Treasury and Reserve Bank. What’s less well known, and is only now becoming apparent, is that it can work in reverse.

Almost 100,000 lives already transformed

If employers are forced to hire people they wouldn’t have in other circumstances, because they’ve run out of every other conceivable option, those people become employable. They either develop the right skills, or employers discover they are not so bad after all. The floor under the unemployment rate drops.

We haven’t seen this before – at least, not in the past half century – because employers have never before been given no other option but to employ people they would really rather not.

People are regarded as long-term unemployed (and harder to employ) if they’ve been out of work for one year or more. In the year to June 2022, the number of long-term unemployed fell from 218,200 to 130,100.

That fall is far more important than the fall in the total number of unemployed from 682,400 to 493,900.

It means those Australians are more likely to be employed than shunned for years to come. It means future employments rates are more likely to start with a “2”, a “3” or a “4” than a “5”.

It means we’ve bought ourselves long-lasting lower unemployment, whatever happens from here on.

It also means the best part of 100,000 lives have been transformed. It means the best part of 100,000 people no longer face years on JobSeeker.

And it means we’ve discovered something really useful.

Just as a crisis that renders people near unemployable can lift the floor under unemployment for years to come, a crisis that forces employers to take on people rendered near unemployable can cut it, perhaps for a very long time.The Conversation

This article is republished from The Conversation under a Creative Commons license. Read the original article.

Read more >>

Sunday, August 14, 2022

‘It’s important not to overreact’: top economists on how to fix inflation


Wes Mountain/The Conversation, CC BY-ND

Australia’s top economists are divided about how to tackle ballooning inflation of 6.1% that’s forecast to climb to a three-decade high of 7.75% by the end of the year.

Three of the 48 leading economists surveyed by the Economic Society of Australia and The Conversation say Australia should be able to tolerate an inflation rate of 8% or higher.

Seven expect inflation to fall back to an acceptable level without the need for any further action other than Reserve Bank adjustments to interest rates.

That view was lent weight by news from the United States last week that annual inflation slid from 9.1% to 8.5% in July, after inflation of zero over the month.


Asked how high an inflation rate Australia should be prepared to tolerate, most nominated a rate at the top of or above the Reserve Bank’s 2-3% target band.

Twelve nominated a rate well above the target band.

Ten said the step-up in inflation was primarily caused by events overseas not within Australia’s power to control.

The economists polled are recognised as leaders in their fields, including economic modelling and public policy. Among them are former Reserve Bank, Treasury and OECD officials, and a former member of the Reserve Bank board.


Beyond rate rises, what could be done?

There are three kinds of actions governments can take to bring consumer price inflation down

  • actions that suppress consumer spending (“demand”)

  • actions that boost the supply of goods and services (“supply”)

  • actions that directly restrain prices

Invited to choose from a menu of options, and add options to the menu, the panel placed slightly greater weight on measures to restrain demand than measures to boost supply, and greater weight on both than measures to directly restrain prices.

The most popular measure, backed by 37% of those surveyed, was winding back government spending. Almost as popular, backed by 33%, was a super-profits tax on fossil fuel producers, with the proceeds used to reduce cost of services.


Another tax measure – increased income taxes with the proceeds used to reduce cost of services – was backed by 17%. Two of those surveyed wanted to abandon the legislated Stage 3 tax cuts for higher earners due to take effect in 2024.

But several of those who advocated winding back government spending or boosting tax did so without enthusiasm, believing that while the government should be prepared to assist the Reserve Bank in suppressing consumer demand, suppressing demand wouldn’t tackle the main reasons prices were climbing.

The risks of doing too much

The Australian National University’s Robert Breunig said much of the inflationary pressure had come from things such as oil prices that were beyond the power of Australians to influence, making it “important not to overreact”.

Melbourne University banking specialist Kevin Davis said what appeared to be high inflation might actually mainly be a series of short-term supply-induced price rises, making it hard to see how choking demand could do much good.

Australia’s current ultra-low unemployment rate was an achievement that should be celebrated, rather than put at risk without a good reason.

If high inflation did stay for a while and spread to wages, a welcome side effect would be more affordable housing.

Curtin University macroeconomist Harry Bloch made the point that while measures to suppress demand in Europe and the United States would indeed have an impact on global energy and food prices, that wasn’t true of measures to suppress demand in Australia, which is too small to influence global prices.

Consulting economist Rana Roy disagreed, saying the fact that high inflation wasn’t primarily caused by excess demand was no reason not to treat it by containing demand. Whatever the cause, containing demand would contain inflation.

Mala Raghavan from the University of Tasmania and Leonora Risse from RMIT University suggested winding back or delaying spending in two areas where it was clear the government was contributing to domestically-driven higher prices: subsidies for, and spending on, construction and infrastructure.

Withholding gas, boosting immigration

The most popular ideas for boosting the supply of goods and services to take pressure off inflation were reserving a portion of Australian gas and other commodities for domestic use, and boosting immigration, supported by 33% and 29% of the economists surveyed.


Reserving a portion of Australian east coast gas for use in Australia would help decouple Australia’s east coast gas prices from sky-high international prices as has happened in Western Australia, which reserves 15% of its gas for domestic use.

Boosting immigration would take pressure off costs by easing labour shortages.

Federation University’s Margaret McKenzie suggested investigating blockages in supply chains and offering diplomatic and industry support to bust them.

Subsidising childcare, subsidising fuel

The most popular idea for directly restraining prices was increased subsidies for childcare, supported by 25% of the economists surveyed, several of whom suggested it could also boost the supply of workers who had previously been prevented from working by unaffordable childcare.


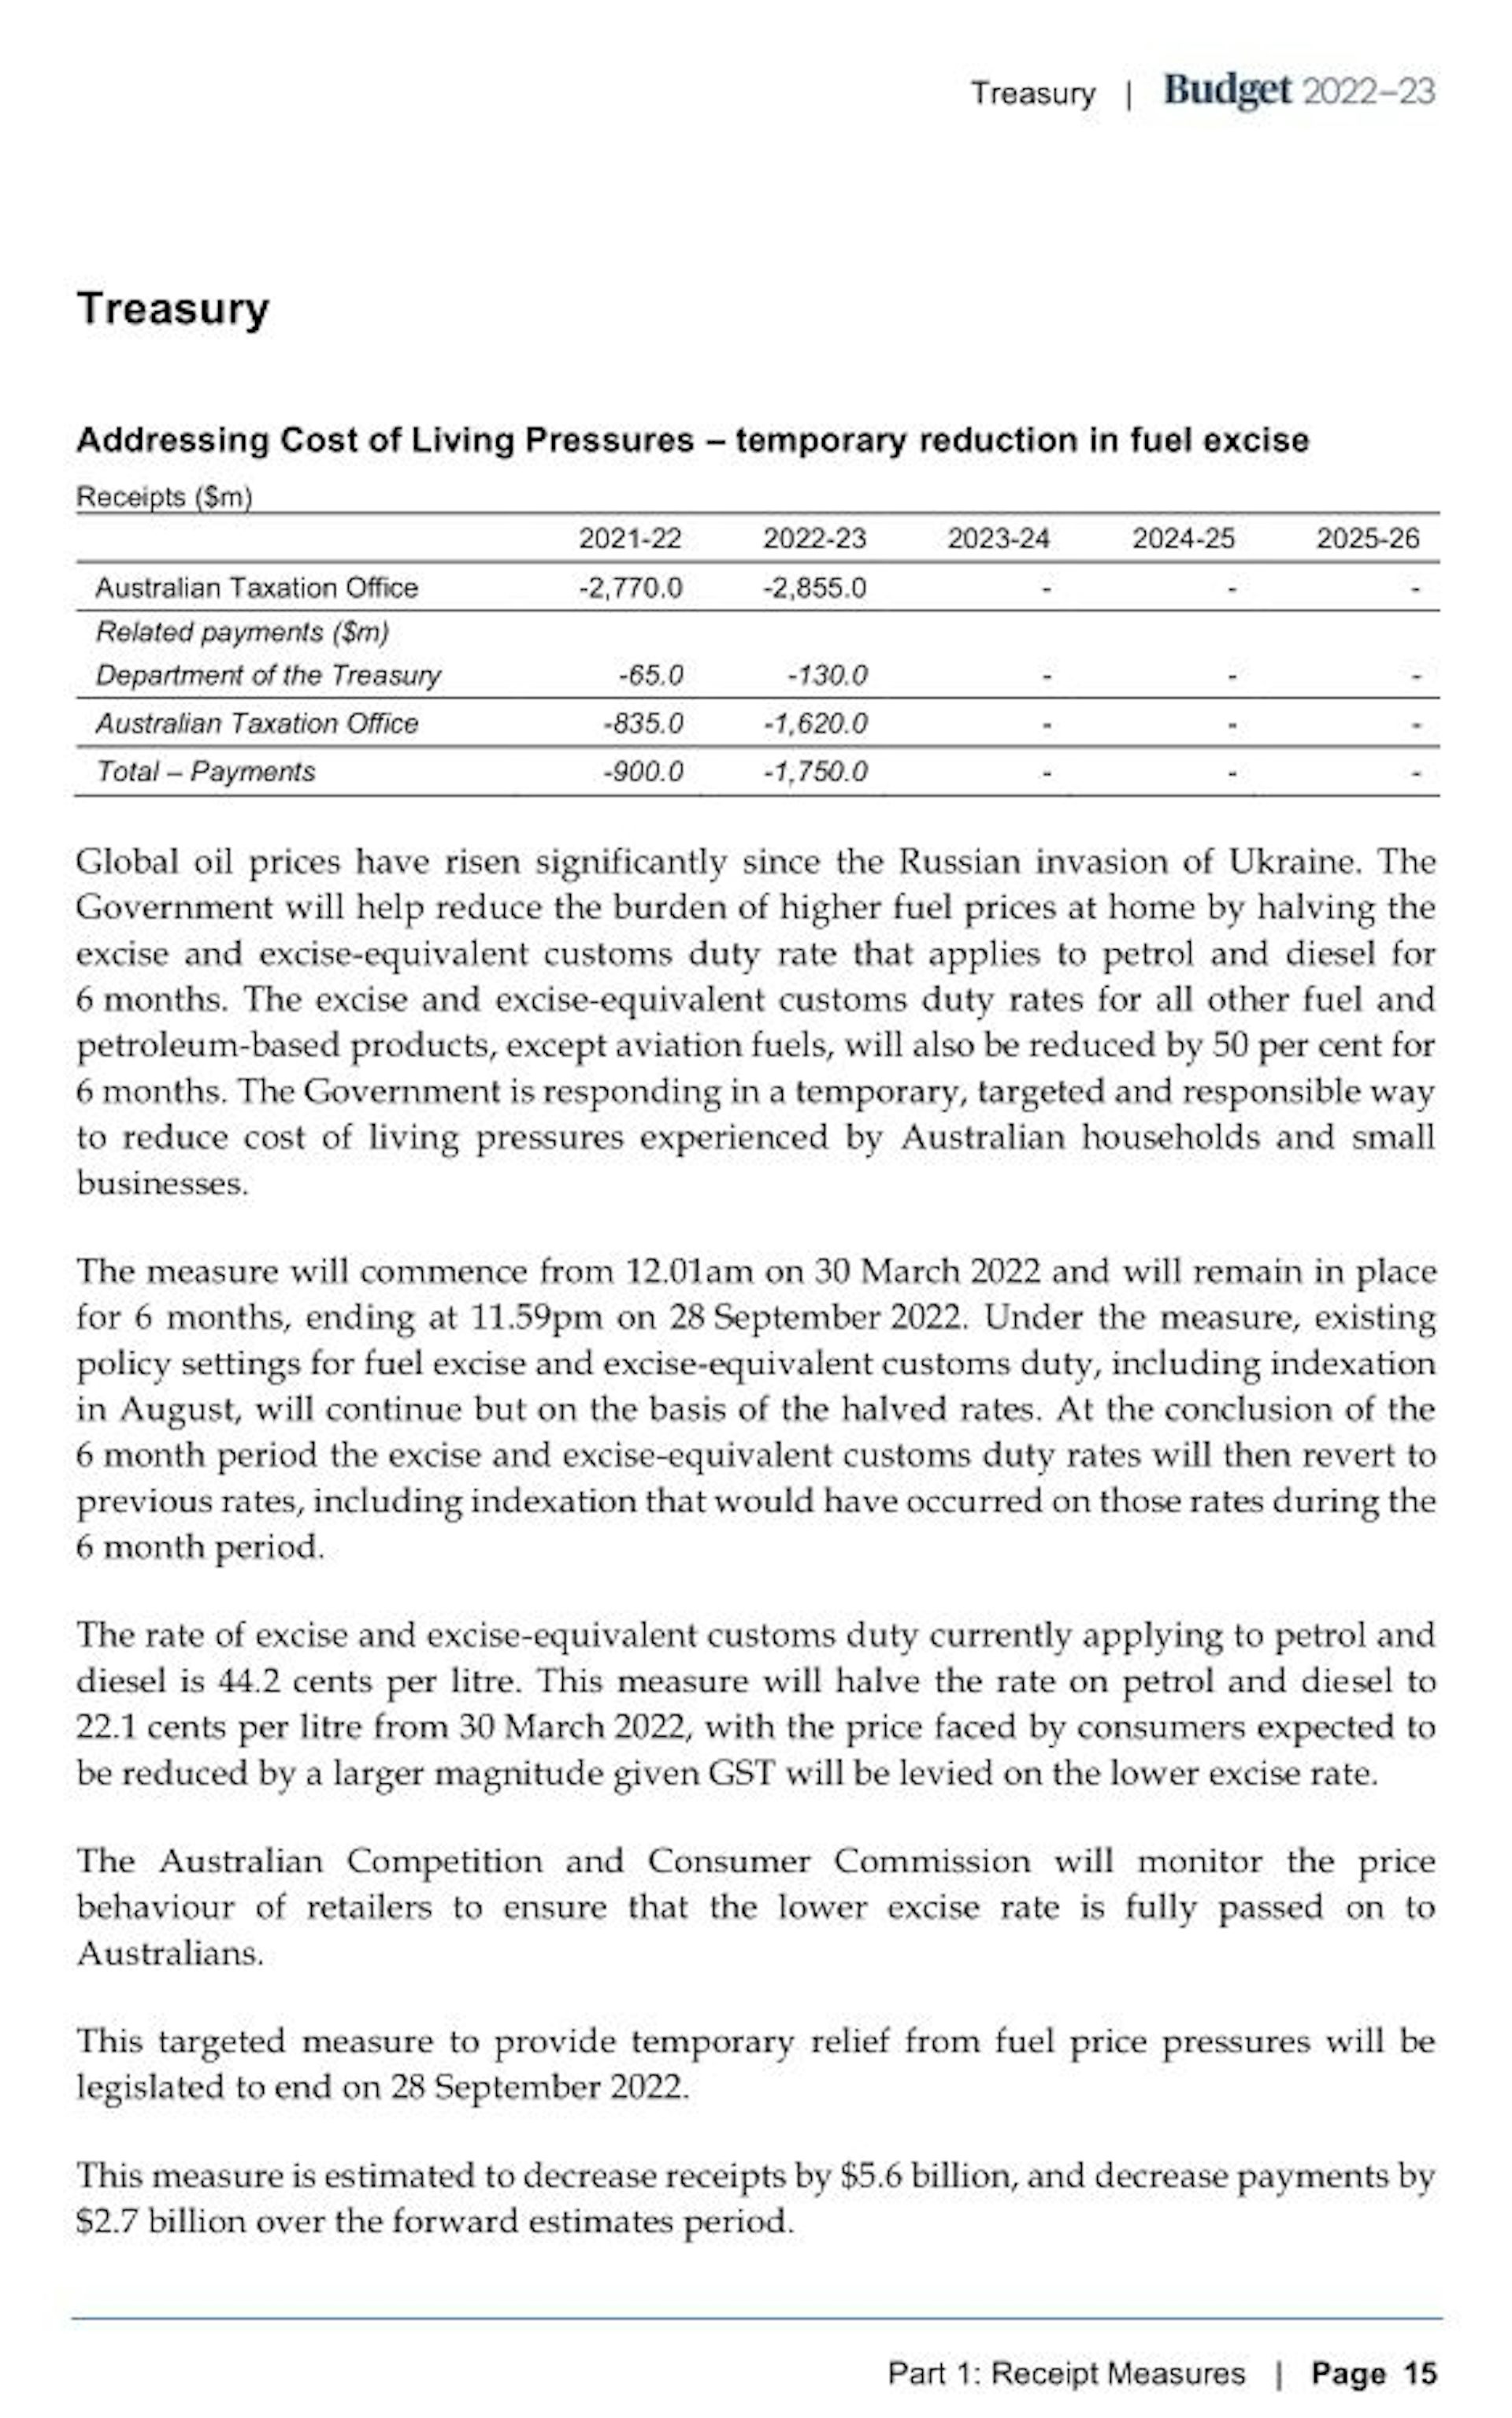
Other ideas that would directly restrain some prices included pushing for below-inflation wage rises in the Fair Work Commission and extending the six-month cut in fuel excise due to expire in September.

Former Reserve Bank board member Warwick McKibbin warned against pursuing low inflation for its own sake, saying when the economy was weak or in recession a high rate of inflation could be more easily justified than at other times.

He said the Reserve Bank should stop targeting inflation and instead target the rate of growth in national spending, an idea he will be putting to the independent review of its operations.


Detailed responses:

The Conversation

This article is republished from The Conversation under a Creative Commons license. Read the original article.

Read more >>

Tuesday, August 02, 2022

The RBA is hiking rates because it’s scared it can’t contain inflation

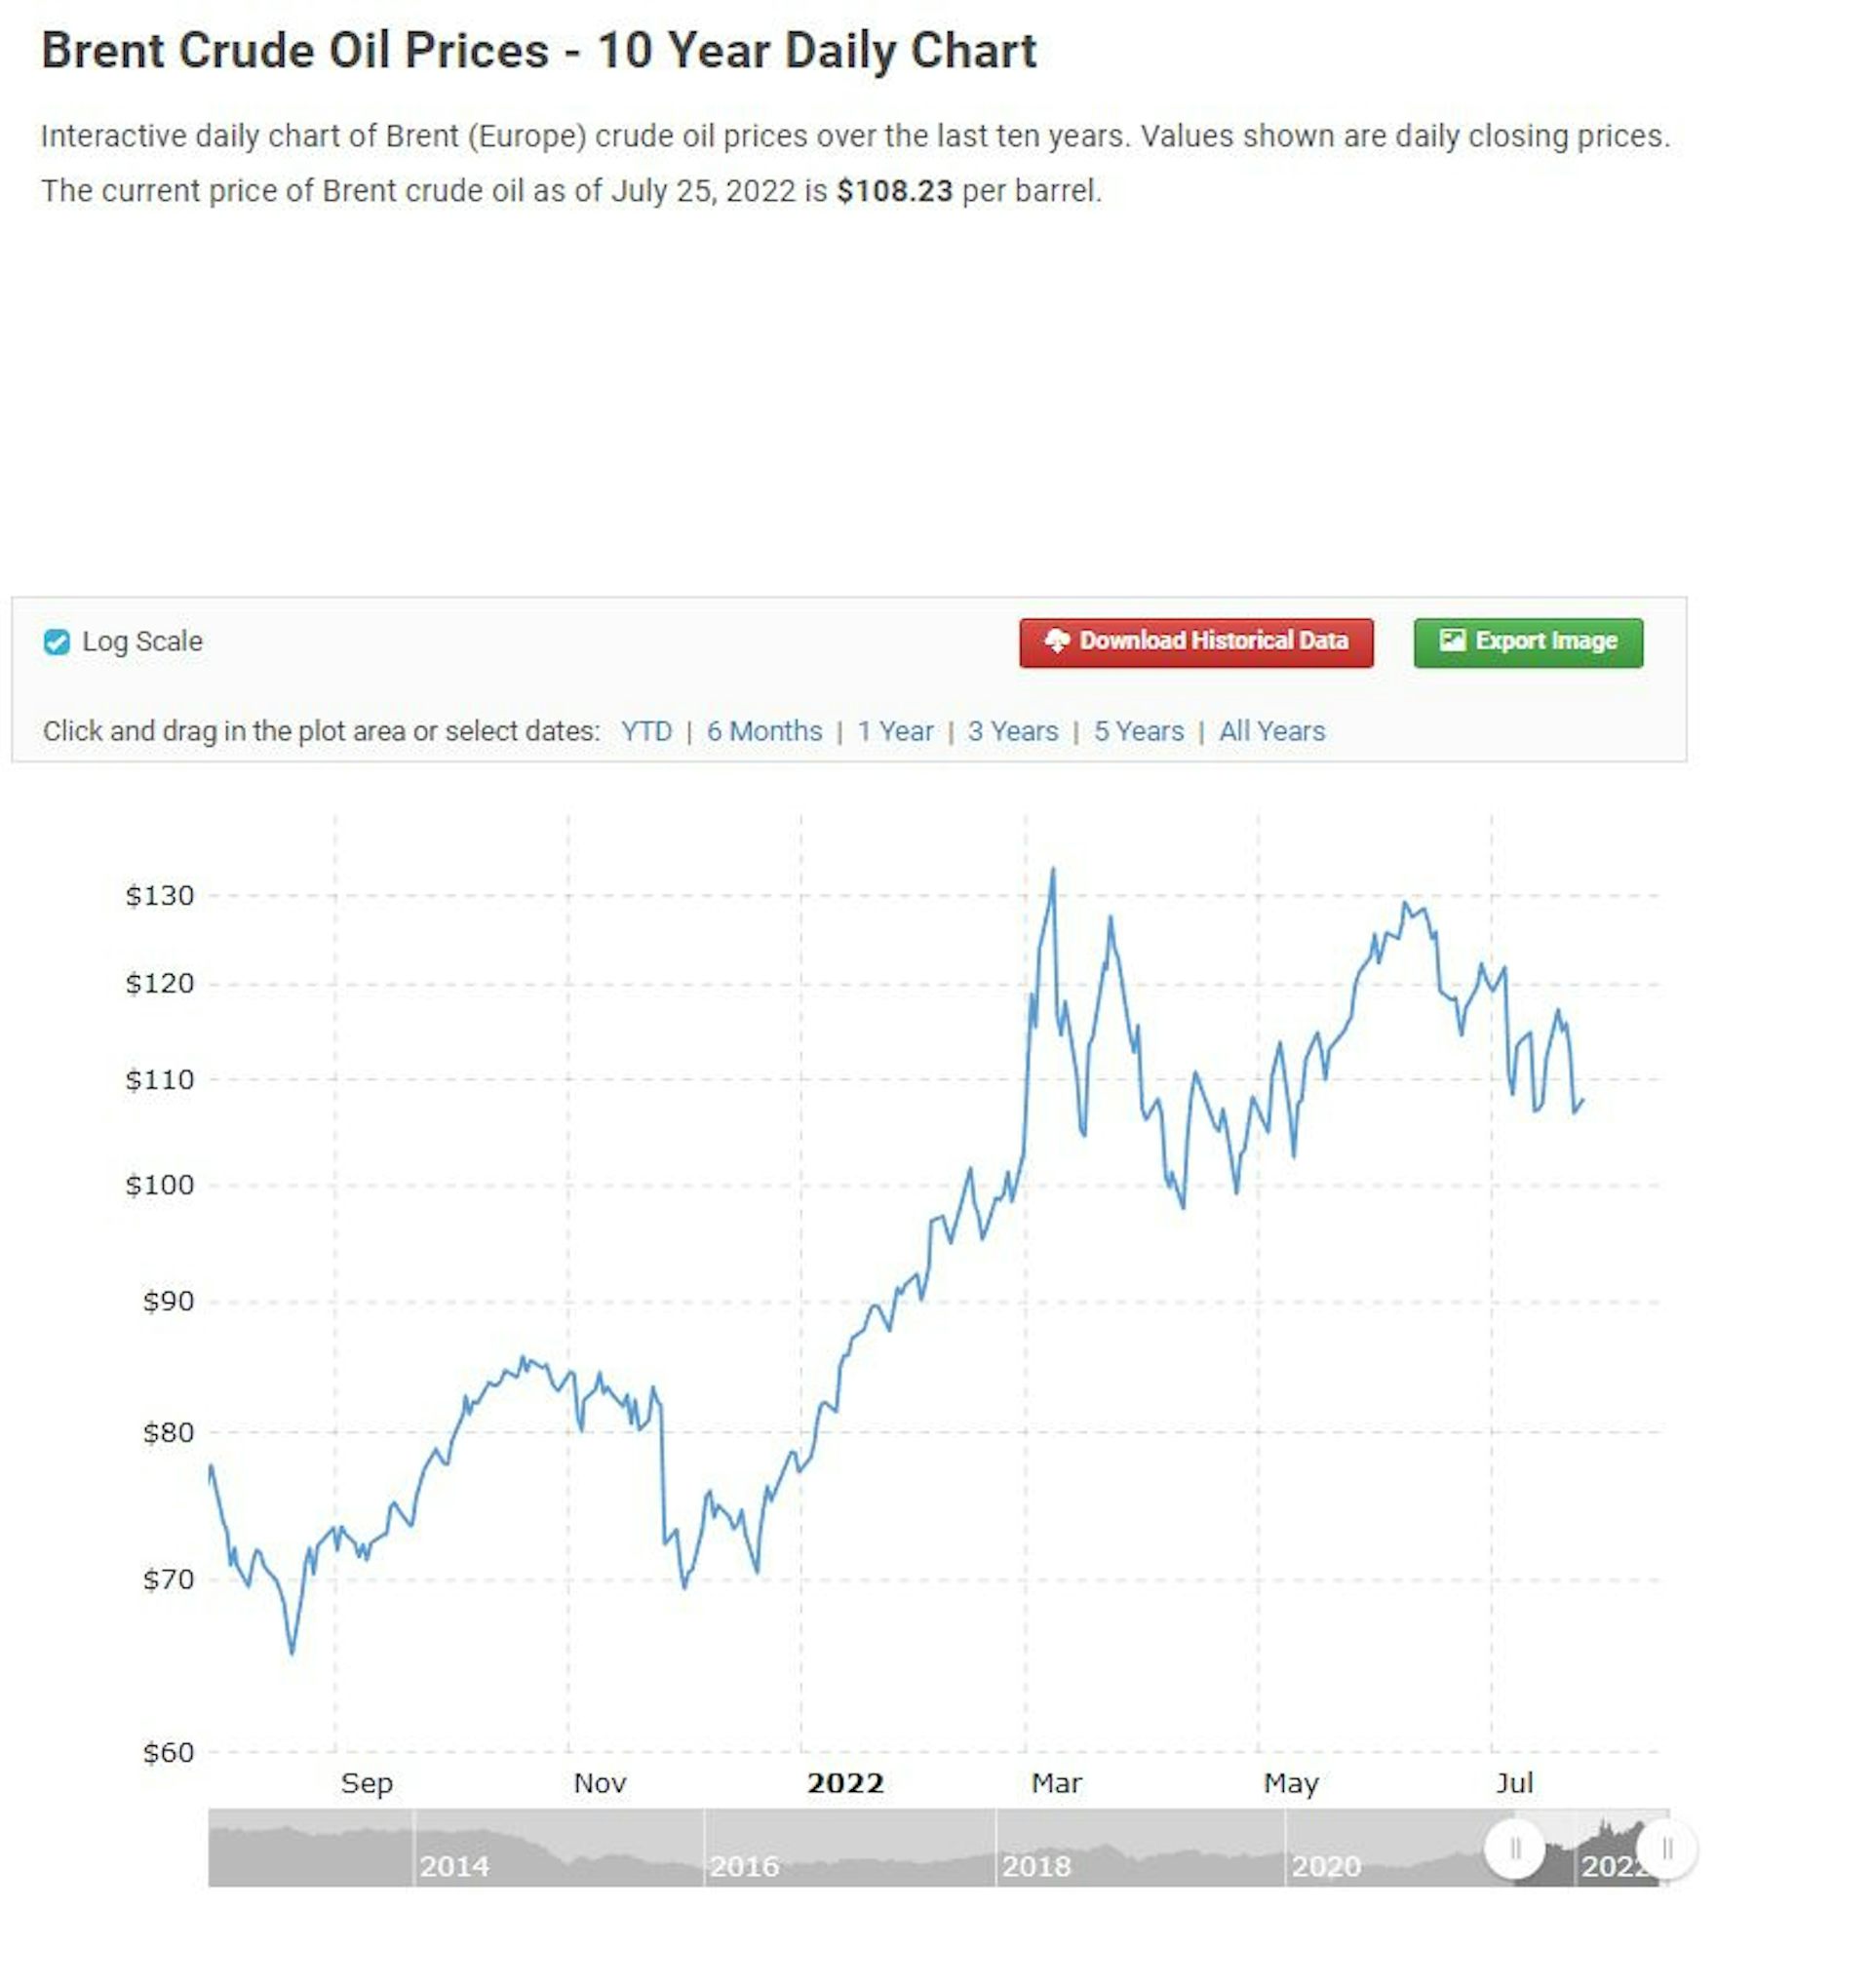
There are signs inflation pressures are easing. Oil prices are down almost 20% on their peak in March. They’ve been falling consistently for a month.

The average capital city unleaded price is down from A$2.11 per litre in early July to a more bearable $1.74.

The money market is pricing in much lower inflation than we presently have over the next one to four years, and consumers’ inflation expectations (although still high at 6.3%) eased off a bit between June and July.

So why did the Reserve Bank just hike its cash rate by an outsized 0.50 percentage points for the third consecutive month, taking it to 1.85%?

Partly because it knows what is to come.

Higher inflation in store

The 6.1% inflation figure released last week was for the year leading to the quarter that ended in June. Since then, in July, we’ve been hit by massive electricity price increases, some as high as 19%, and gas prices that have manufacturers screaming.

The monthly inflation gauge compiled by the Melbourne Institute (the Bureau of Statistics hasn’t yet gone monthly) kicked up 2.1% in July, the biggest monthly jump in two decades.

And there’s something else.

The Reserve Bank’s deepest fear might be that it can’t contain inflation, and that its apparent success over three decades has owed a lot to luck.

Reserve banks blessed by luck

Inflation fell to low levels throughout the world around the world at about the time it fell to low levels in Australia. From the mid 1990s, inflation fell to 2-3% in the US, the UK, Canada and just about every other Western nation, as China deluged the world with low-priced goods and companies began offshoring.

It got to the point where almost as many prices were falling as rising.

The US economic historian Adam Tooze says it’s reasonable to ask whether we had inflation at all from the mid 1990s onwards.

The Bank for International Settlements defines inflation as a “largely synchronous increase in the prices of goods and services” – a situation where prices broadly climb together.

Little real inflation for 30 years

It needs to be largely synchronous to qualify as inflation because otherwise the amount a dollar can buy isn’t clearly changing – any such effect is overwhelmed by changes in the mix of goods and services a dollar can buy.

It is only when prices start to move together, as they are now, that inflation gets normalised and becomes entrenched.

Twenty years ago, in June 2002, by my count 20 of the 87 types of items that made up the consumer price index fell in price. Ten years ago, 32 fell in price.

By economist Saul Eslake’s count, this June only 15 of what are now 90 expenditure classes fell in price – what appears to be the lowest number in decades.

Suddenly, price rises are synchronised

It means the Reserve Bank is having to deal with broad-based inflation of a kind it hasn’t faced since it began targeting inflation in the early 1990s.

Just about the only tool it has to do it – higher interest rates – makes people poorer.

Higher interest rates work in other ways as well.

  • they increase the reward for saving, diverting some money from spending

  • they make it harder to borrow, diverting more money from spending

  • and they push up the exchange rate, making imported goods cheaper – or they would have, were other central banks not also pushing up their rates, meaning the Australian dollar is no higher than it was when the bank began pushing up rates in May.

But their chief effect is impoverishing variable mortgage holders, to the tune of hundreds of dollars a month.

The more variable mortgage rates go up (Tuesday’s hike will push up the ANZ standard rate from 4.24% to 4.74%) the less mortgage holders have to spend on other things, and the less they will add to price pressure.

That’s the idea. And it is disingenuous to pretend otherwise.

Mortgage buffers are scant protection

In a speech last month Reserve Bank Deputy Governor Michele Bullock said households in aggregate were “well positioned”.

They had saved $260 billion since the start of the pandemic, much of which had gone into redraw facilities and offset and deposit accounts.

Around half were almost two years ahead on mortgage payments, or more. They had “large buffers”.

But, as University of Newcastle economist Bill Mitchell points out, by the bank’s own logic, this just means it will have to squeeze them harder.

It wants Australians to spend less and, if they use their buffers to keep spending as they have, it will have to either give up, or push rates higher until they do.

RBA Governor Philip Lowe says he is navigating a “narrow path” to curb inflation without too much pain. He can’t be certain he knows the way.The Conversation

This article is republished from The Conversation under a Creative Commons license. Read the original article.

Read more >>

Tuesday, July 26, 2022

Labor is winding back reforms meant to hold super funds accountable to their members

Who could even question a requirement that super funds act in the best financial interests of their members?

Labor’s new assistant treasurer Stephen Jones, that’s who.

While the treasurer himself has been working on Thursday’s major economic statement, Jones has asked the treasury to consider concerns relating to the “regulatory complexity” of a requirement that funds act in their members best financial interests – a requirement that on the face of it is straightforward.

Oddly, he titled the announcement “Review to strengthen super,” a title he might need to rework if the review finds the duty should be weakened.

The Coalition strengthened the requirement a year ago as part of a suite of reforms called “Your Future, Your Super”, changing it from a duty to act in the “best interests” of members to the best “financial” interests of members.

The difference between the two is that whereas spending members funds on things such as corporate hospitality or wellbeing services or news websites might arguably be in the best interests of members, it need not be in the best financial interests of members.

And that’s what superannuation funds are meant to be for – to grow rather than spend the trillions entrusted with them for workers’ retirements.

To make sure the funds do it, the Coalition reversed the onus of proof. If questioned, fund directors needed to be able to demonstrate that their spending was in the best financial interests of their members, or at least in what they thought at the time would be their members best financial interests.

‘Best financial interests’ up for review

That might be the “regulatory complexity” the assistant treasurer is referring to –a requirement directors use their members funds to grow their members funds, and be able to demonstrate that’s what they were attempting if asked.

It’s good news for members, whose compulsorily-acquired funds the directors are managing, but troubling for some directors (in industry funds most directors are union and employer representatives), and Jones listened to the directors.

He has backed them on another concern.

The Coalition’s regulations require funds to itemise their spending on political donations and payments to related parties and industrial bodies, as well as their spending on marketing, in a statement to members before each annual meeting.

Jones has drafted regulations that remove the requirement for itemisation while leaving in place the requirement for funds to report the totals to members.

It won’t save the funds work (they still have to itemise each payment in order to prepare the totals), but it will save them embarrassment.

And he is tampering with perhaps the most important super reform of them all.

Performance test up for review

Last year for the first time each of the 80 MySuper funds (the funds into which new employees can be defaulted) was graded on its performance.

Thirteen failed. They weren’t being graded on absolute returns. That would have been unfair. They were graded on returns over the past seven years given their stated investment strategy.

If their strategy had been to (say) invest all of their members funds in shares, and shares did badly, that would be fine so long as the fund’s shares didn’t do significantly worse than the share market as a whole over seven years, which is a way of saying it is a hard test to fail.

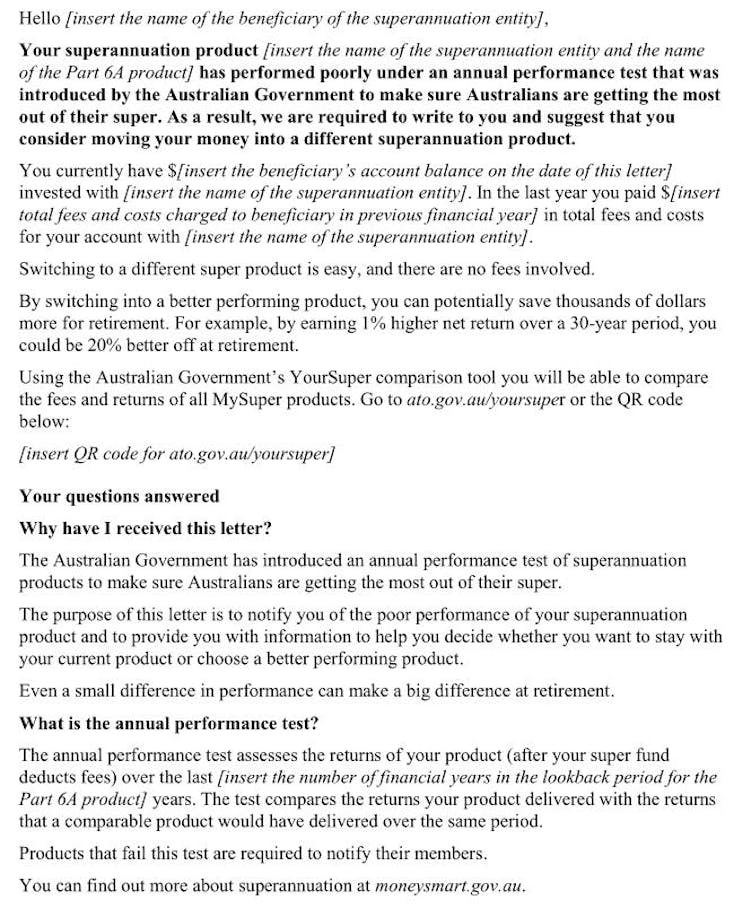
Under the Your Future, Your Super rules the 13 funds that failed were required to write to their members telling them they had performed badly and suggesting they switch to a better-performing product.

The second test will be this year. Any funds that fail two years in a row get banned from accepting new members.

Not that it’s likely to come to that. Eleven of the 13 have merged or are in the process of merging with better funds, which is how the system is supposed to work. It is weeding out dud funds, advancing members interests.

Even the fear of failing is advancing members interests. Industry observers say funds likely to fail are cutting their fees to ensure they don’t. The performance test is on returns net of fees.

Twelve month pause

From next year the test was to be extended to all super funds, whether default or not, so it could really weed out the duds. The Productivity Commission found non-default funds performed notably worse than default funds.

But Jones says he’ll stop the extension – “pause” is his word – for 12 months while the treasury rechecks the system for “unintended outcomes”.

Hundreds of funds (some of them bad) will be given a reprieve, something that was itself unintended when the system was set up.

There are genuine concerns about the test. It is backward looking, as it has to be, and funds in difficulty will have it made worse by an exodus of members when the results are published.

But these are concerns for the directors of the funds, not their members. And Australians put more of their money into super than anything other than housing.

A landmark 2018 Productivity Commission inquiry found much of the system was a “mess” that allowed poorly performing funds to produce $660,000 less in retirement than well-performing funds.

Your Future, Your Super was the government’s response to that. It’s already achieved a lot. Until the new minister hit pause, it was about to achieve more.The Conversation

This article is republished from The Conversation under a Creative Commons license. Read the original article.

Read more >>

Tuesday, July 19, 2022

‘Wellbeing’ will give future budgets more rigour than any before

What if the most important thing in Jim Chalmers’ first budget is the thing his critics are writing off as a gimmick?

Australia’s new treasurer has a lot on his plate. He has commissioned a complete review of the way the Reserve Bank works, he is drawing up a statement to parliament he says people will find “confronting” and he is preparing the second of two budgets in one year; in October, updating the Coalition’s budget in March.

In what some see as a gimmick, it will be Australia’s first budget to benchmark its measures against their impact on the wellbeing of the Australian people: Australia’s first “wellbeing budget”.

When Chalmers proposed the idea in opposition, the treasurer at the time, Josh Frydenberg, described it as “laughable”.

Wellbeing was “doublespeak for higher taxes and more debt”.

Frydenberg asked parliament to imagine Chalmers delivering his first budget, the one he will deliver on October 25, “fresh from his ashram deep in the Himalayas, barefoot, robes flowing, incense burning, beads in one hand, wellbeing budget in the other”.

But here’s the thing. In an important way, Chalmers first “wellbeing budget” will have more rigour than any of the budgets prepared by Frydenberg or any of his predecessors.

It’ll be the first to have a stab at cost-benefit analysis.

Budgets are usually three things: a statement of accounts, with measures that will have an impact on the accounts (and sometimes measures that won’t), as well as the legislation needed to authorise another year’s worth of expenditure.

What they don’t do, as a rule, is assess the impact of those measures, even the impact on the economy.

Measures without outcomes

Frydenberg’s first budget for example, in 2019, included a measure named “lower taxes for hard-working Australians”.

The budget papers described what the measure would do and its impact on the budget, but not its impact on the economy.

The calculations may well have been carried out, but they weren’t included in the budget, as was typical. The budget papers told us what was being done, but not what it would do.

Until 2014 the budget papers at least told us who the budget would make better off and worse off. The standard table identified the impact of the budget as a whole on 17 different types of households at different types of incomes.

Prime Minister Tony Abbott and Treasurer Joe Hockey removed it in their first budget, perhaps because they didn’t want the winners and losers to become apparent, and it hasn’t returned.

The budget papers neither tell us what the budget will do to economic growth, nor what it will do to incomes, nor what it will do to the environment or anything else other than the budget’s bottom line.

Which is a pity, because the budget is massive.

The government takes in just short of one quarter of all the dollars spent in Australia and pays out slightly more than one quarter of the dollars earned.

The balance between that income and spending is called the budget deficit or surplus. It matters, but so too does what that income and spending does.

Encompassing rather than replacing GDP

What Chalmers is proposing, and what New Zealand and Scotland are doing, and what Canada is working towards, is a scorecard of how budget measures affect the things that matter, including how much we produce: gross domestic product.

During the first Rudd government, Angela Jackson was deputy chief of staff to Finance Minister Lindsay Tanner. Reflecting on that time at last week’s Australian Conference of Economists, she said it was astounding that the expected effects of budget measures weren’t made explicit.

It meant what happened couldn’t be assessed against expectations.

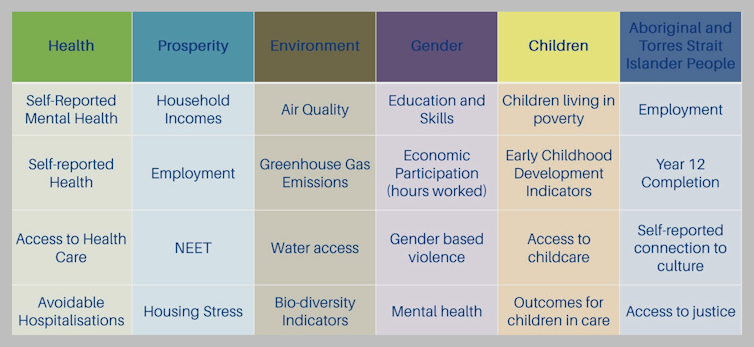
Introducing measurables wouldn’t be about supplanting GDP, but about including it along with other measures of prosperity as outcomes against which the budget could be assessed, along with measures of health, the environment, gender, children’s welfare, and the welfare of Aboriginal and Torres Strait Islander people.

It would let us see whether we are making progress or going backwards on the environment (where we seem to be going backwards) and on living standards, inequality, health and other things, and what the budget is doing about it.

The Australian Bureau of Statistics was on to this back in 2008 when it introduced a short-lived publication called Measures of Australia’s Progress that reported on whether what came to be 26 key indicators were going forwards or backwards.

Australia’s Treasury was on to it earlier, in 2004, introducing its own wellbeing framework for internal use. It understands the concept.

Taking that concept public will improve or weed out budget measures before they are announced. They will need to demonstrate that they can improve wellbeing, or at least not make it worse.

After it is established, it will require future treasurers to level with the public about the impact of what they are proposing in the same way as Coalition treasurer Peter Costello’s Charter of Budget Honesty required future treasurers to level with the public about the cost of what they were proposing.

It’s already shaping up as Chalmers’ most important legacy.The Conversation

This article is republished from The Conversation under a Creative Commons license. Read the original article.

Read more >>

Friday, July 01, 2022

Sky-high mortgages, 7.1% inflation, and a 20% chance of recession. How the Conversation’s panel sees the year ahead

Homeowners will face mortgage rates near 5.5% in a little over a year, according to a survey of 22 leading Australian economists.

The Conversation’s 2022-23 forecasting survey predicts an increase in the Reserve Bank’s cash rate from its present 0.85% to a peak of 3.1% by next August.

If fully passed on, the series of rate hikes would lift the cost of payments on a variable $500,000 mortgage by about $600 per month and the cost of payments on a $800,000 mortgage by about $1,000 per month.

Sydney and Melbourne home prices would slide 6-7%.

The panel believes the Reserve Bank will push its cash rate to its highest point since the 2010-2012 resources boom in an effort to contain inflation, which it expects to jump from its present 5.1% to a peak of 7.1% before the end of the year.

Panel members put the risk of an overreaction by authorities bringing on a recession at a 40% chance in the United States, and a lower 20% probability in Australia.

Now in its fourth year, The Conversation’s survey draws on the expertise of leading forecasters in 20 Australian universities and financial institutions, among them economic modellers, former Treasury, International Monetary Fund and Reserve Bank officials, and a former member of the Reserve Bank board.

Inflation

The panel expects the next inflation figure to be released later this month to show prices climbed 6.7% in the year to June – the most since the early 1990s.

Panelist Saul Eslake says it hard to be confident about when inflation will peak without being confident about when and how the conflict in Ukraine will end, although he says it is difficult to see energy prices climbing higher, and there is some evidence COVID-related supply disruptions are beginning to ease.


On balance the panel expects inflation to peak at 7.1% towards the end of this year before declining next year.


Interest rate rises

The panel expects the equivalent of five 0.25 point increases in the Reserve Bank’s cash rate in the next six months, and just short of another two 0.25 point increases in the six months that follow.


On balance, the panel expects the cash rate to stop climbing when it gets to 3.1% next August, but some members expect much steeper increases.

Warwick Mckibbin, a former member of the Reserve Bank board, expects a cash rate of 4.5% (implying mortgage rates of 6.75%) by March, and he says that is less than required.

He says the cash rate needs to climb above the 3.5% that would normally be thought of as neutral, and stay there for a sustained period to bring inflation back to the Reserve Bank’s target.

Former Commonwealth Treasury and financial markets economist Warren Hogan sees rates climbing for as many as five years, although his forecast is for four.

RBC Capital Markets head of economics Su-Lin Ong believes that won’t be needed to cool the economy, as the expiry of the ultra-cheap three-year fixed rate mortgages taken out during COVID will deliver a “market-induced tightening”.


Recession risk in the US and Australia

The panel believes the United States is at a much greater risk than Australia of a miscalculation in which rates are pushed so high to contain inflation that they bring on a recession.

The US economy has already turned down in the first three months of this year, and the panel expects it to finish the year just 2.2% larger than when the year began. The panel expects unusually low economic growth of 2.6% in China.


In the United States, the task of defining the start and end of recessions is assigned to the National Bureau of Economic Research’s business cycle dating committee.

The panel believes there is a 40% chance it will call a recession in the next two years, with the most likely start being March 2023.


The panel assigns a lower 20% probability to a recession in Australia (commonly defined as two consecutive quarters of negative economic growth) and believes the most likely start date is August 2023.


Economic growth

Absent recession, the panel expects economic growth to decline in line with forecasts in the March budget from year-on-year growth of 4.25% in 2021-22 to 2.5% over the coming five years.


Living standards

The substantial increase in wage growth the panel expects from 2.4% in the year to March to 3.6% by June next year will be nowhere near enough to prevent real wages sliding.

Even with inflation down to 4.8% by then as forecast, real wages would go backwards by a further 1.2%.


Weighing on further increases in wages growth will be a forecast nudge up in the rate of unemployment, from 3.9% to 4.2%.

ANZ chief economist Richard Yetsenga says while reopening Australia to skilled migrants, temporary visa holders, students and backpackers will add to the supply of workers, it should also boost already very strong consumer spending, limiting any increase in unemployment.


The panel expects outsized real growth in household spending of 4.5% in 2022-23 boosted by what Barrenjoey Capital’s chief economist Jo Masters describes as elevated household savings, combined with continuing fixed rate mortgages and the low and middle income tax offset payments due to hit accounts from July.

The broadest measure of living standards, real net disposable income per capita, should continue to advance, although modestly.


Home prices

The panel expects mortgage rate driven falls in home prices to reach 6-7% in Sydney and Melbourne over the coming year.

Julie Toth of Swinburne University and Nous Group expects the biggest impact in low and medium income suburbs, where buyers are more vulnerable to mortgage increases.


Markets

The panel nonetheless expects solid growth in non-mining business investment of 6.4% (and mining investment of 7.6%), and an iron ore price above US$100 an ounce but sliding down from its present US$130 to US$108.

It expects the Australian share market to end the financial year 2% lower.


After a year in which the 10-year bond rate that determines the government’s cost of borrowing soared from 1.5% to 3.7%, panelists expect only a small further increase in 2022-23, to 3.9%.

After sliding from 75 US cents to 69 US cents, they expect the Australian dollar to climb modestly to 72 cents during 2022-23, putting some downward pressure on inflation.


The Conversation Economic Panel

Click on economist to see full profile.

Download the 2022-23 economic surveyThe Conversation

Peter Martin, Visiting Fellow, Crawford School of Public Policy, Australian National University

This article is republished from The Conversation under a Creative Commons license. Read the original article.

Read more >>

Wednesday, June 29, 2022

Australians are more millennial, multilingual and less religious: what the census reveals

Census data to be released Tuesday shows Australia changing rapidly before COVID, gaining an extra one million residents from overseas in the past five years, almost all of them in the three years before borders were closed.

For the first time since the question has been asked in the census, more than half of Australia’s residents (51.5%) report being either born overseas or having an overseas-born parent.

More than one quarter of the one million new arrivals have come from India or Nepal.

The census shows so-called millennials (born between 1981 and 1995) are on the cusp of displacing baby boomers as Australia’s dominant generation.

Although the number of baby boomers (born between 1946 and 1965) has changed little, as a proportion of the population boomers have fallen from 25.4% in 2011 to 21.5%. Millennials have climbed from 20.4% to level pegging at 21.5%.

The changes are reflected in the answer to the question about religion, the only non-compulsory question in the census. Almost 40% of the population identified as having no religion, up from 30% in 2016, and 22% in 2011.

Whereas 47% of millennials identify as having no religion, only 31% of boomers fail to identify with a faith. Nearly 60% of boomers are Christian, compared to 30% of millennials.

The share of the population identifying as Christian has slipped from 52% to 44%. Other religions are growing, but remain small by comparison. Hinduism climbed from 1.9% of the population in 2016 to 2.7%. Islam climbed from 2.6% to 3.2%.

The five-yearly snapshot

Conducted every five years since 1961, and before that less often from 1911, and asking questions of every Australian household, the census provides information about the ways society is changing that couldn’t be obtained in any other way.

In the past five years the number of people who use a language other than English at home has climbed 792,000 to more than 5.6 million. 852,000 Australian residents identify as not speaking English well or at all.

Mandarin remains the most common language other than English used at home, used by 685,300 people, followed by Arabic with 367,200 people.

The real value is in the detail

The real value of the census is in the locational details. The information released on Tuesday will identify locations with any characteristic that needs particular services, such as the areas with more people who identify as not speaking English well or at all. It will also show which parts of Australia are growing in population and which parts are shrinking.

The broad-brush information released on Monday showed the number of single-parent families had climbed past one million. The information released on Tuesday will identify the suburbs and towns in which they live.

The information released on Monday showed the overall proportion of Australians owning their homes was little changed. The information released on Tuesday will report those proportions by age group and city.

New questions

Two new separate questions in the 2021 census ask about service in defence forces and long-term health conditions.

One quarter of veterans are aged 65-74, reflecting conscription during the Vietnam War.

More than two million Australians suffer long-term mental health conditions; more than two million suffer arthritis; and more than two million suffer asthma.

Tuesday’s figures will offer more detail on the locations of sufferers and details such as their income and occupations, as well as details such as whether those who’ve served in defence were conscripts, serving in Vietnam.

Saved from the axe

Seven years ago the Australian Bureau of Statistics tried to axe the five-yearly census, making it 10-yearly – as in the United Kingdom and the United States – to save money.

The outcry from planners and researchers who relied on the census resulted in the bureau being given an extra A$250 million to ensure it continued.

Tuesday’s is the first of three census data releases. In October, the bureau will release information about education and employment and travel to work.

Early next year it will release location-specific socio-economic information and estimates of homelessness.The Conversation

Peter Martin, Visiting Fellow, Crawford School of Public Policy, Australian National University

This article is republished from The Conversation under a Creative Commons license. Read the original article.

Read more >>

Wednesday, June 15, 2022

Australia already has a UK-style windfall profits tax on gas – but we’ll give away tens of billions of dollars unless we fix it soon

The really bizarre thing about calls for a UK-style windfall profits tax on gas is that Australia’s already got one.

Gas prices have soared to levels never envisioned in the lead-up to 2015, when three resource giants spent A$80 billion building terminals in Queensland with the potential to export three times the east coast gas Australia had been using.

At the time, the “netback” international gas price (net of the cost of liquefying and shipping) was barely A$10 a gigajoule, and wasn’t expected to climb much higher.

Suddenly, in the space of a year, it has jumped to three times that level. Local industrial customers are now being asked to pay a barely-credible $382 a gigajoule – and gas suppliers were about to ask for $800, before the energy market operator stepped in and capped prices at a still “crippling” $40 a gigajoule.

Gas generators aren’t keen to power up

So expensive is gas that on Monday, when almost a quarter of Australia’s coal-fired power generating units were out of action and it looked as if NSW and Queensland would be plunged into darkness, gas generators were sitting on their hands rather than powering up.

They only acted when ordered to by the energy market operator.

In Britain, where export gas prices have climbed just as high (and one of the same companies, Shell, is involved) Prime Minister Boris Johnson has imposed a 25% windfall profits tax on oil and gas producers.

The special tax will help fund support for households struggling with high bills, and will be phased out when oil and gas prices return to normal.

Australia already has a special tax on gas

There are precedents here for singling out an entire industry for an extra tax. Scott Morrison did it in 2017 with a special tax on big banks, which continues to this day.

The Rudd and Gillard governments tried it with a short-lived 40% super-profits tax on the mining industry, which was based on … well, it was based on the longstanding 40% resource rent tax applying to the oil and gas industry.

That’s right. Australian oil and gas producers have had to shell out 40% of their profits in tax, in addition to 30% company tax on profits, for years.

That’s a total big enough to ensure the windfall profits resulting from Russia’s invasion of Ukraine are well and truly taxed along the lines announced in the UK, allowing Australia’s government to grab most of the windfall and use it to support households suffering from high energy prices. Or so you would think.

And yet the amount collected is tiny: $2.4 billion, which is no more than was collected in 2005. At times, it has fallen as low as $1 billion. In the words of the Grattan Institute’s Tony Wood, himself a former energy executive, it is a “rather strange thing to have a tax that nobody pays”.

Australian Institute analysis of Tax Office data suggests that none of the big three Queensland gas exporters has paid any income tax since their projects began in 2015, except for $3 billion paid by Santos, once, on revenue of $5.3 billion.

Designed for oil, used for gas

In 2016 Morrison commissioned retired public servant Michael Callaghan to inquire into why the minerals resource tax was raising so little money.

Callahan found it well designed for oil, which it was set up to tax in 1988, but poorly designed for gas.

One of the two biggest problems was “uplift”. Profits are taxed after deducting earlier losses. These losses are carried forward using an uplift rate.

For oil projects, the uplift rate on losses doesn’t much matter because they start making profits fairly soon.

Gas projects are much more expensive and take many more years to produce a return, making the uplift rate significant.

Australia applies two uplift rates: the long-term bond rate plus 5% (for general losses), and the long-term bond rate plus 15% (for exploration losses).

So much can the long-term bond rate plus 15% grow over time that Callaghan found it allowed exploration deductions to

almost double every four years, which means that a moderate amount of exploration expenditure can grow into a large tax shield

And firms hang on to the high-uplift deductions, using the low-uplift ones first.

The second big problem is that, whereas with oil it is easy to tell when the oil has been mined and the profit should be taxed, with integrated liquidated natural gas projects, it is hard to tell when the mining stops and the liquefaction starts.

Taxing in the dark

Without an observable final price for the gas before it is liquified, three methods are used – two of them complex and one a private agreement with the tax office.

Callaghan found that if the simpler “netback” method was used, the tax would raise an extra $89 billion between 2023 and 2050 including a “particularly strong” extra $68 billion between 2027 and 2039 at the prices then prevailing.

In his 2018 response Treasurer Josh Frydenberg cut the uplift rates and asked the treasury to review the method of calculating the transfer price. It was to report back “within 12 to 18 months”.

For all we know, the treasury did report back, perhaps two years ago in May 2020.

It’s a fair bet our new government will be keener than the old to actually raise more than a couple of billion from the petroleum resource rent tax, especially given the amount now available to tax.

If the extra tax was used to provide relief from high energy prices, Australia’s government could no more be criticised than could Boris Johnson’s in the UK.

And if it merely said it was thinking of properly applying the tax we’ve got, it might find Australia’s gas exporters suddenly more co-operative.The Conversation

Peter Martin, Visiting Fellow, Crawford School of Public Policy, Australian National University

This article is republished from The Conversation under a Creative Commons license. Read the original article.

Read more >>