Tuesday, October 18, 2022

Australia needs an honest conversation about tax and budgets – and Jim Chalmers is ready to talk

Jim Chalmers is a wily operator. Ahead of delivering his first budget next Tuesday, he has given himself room to do the things a treasurer needs to do.

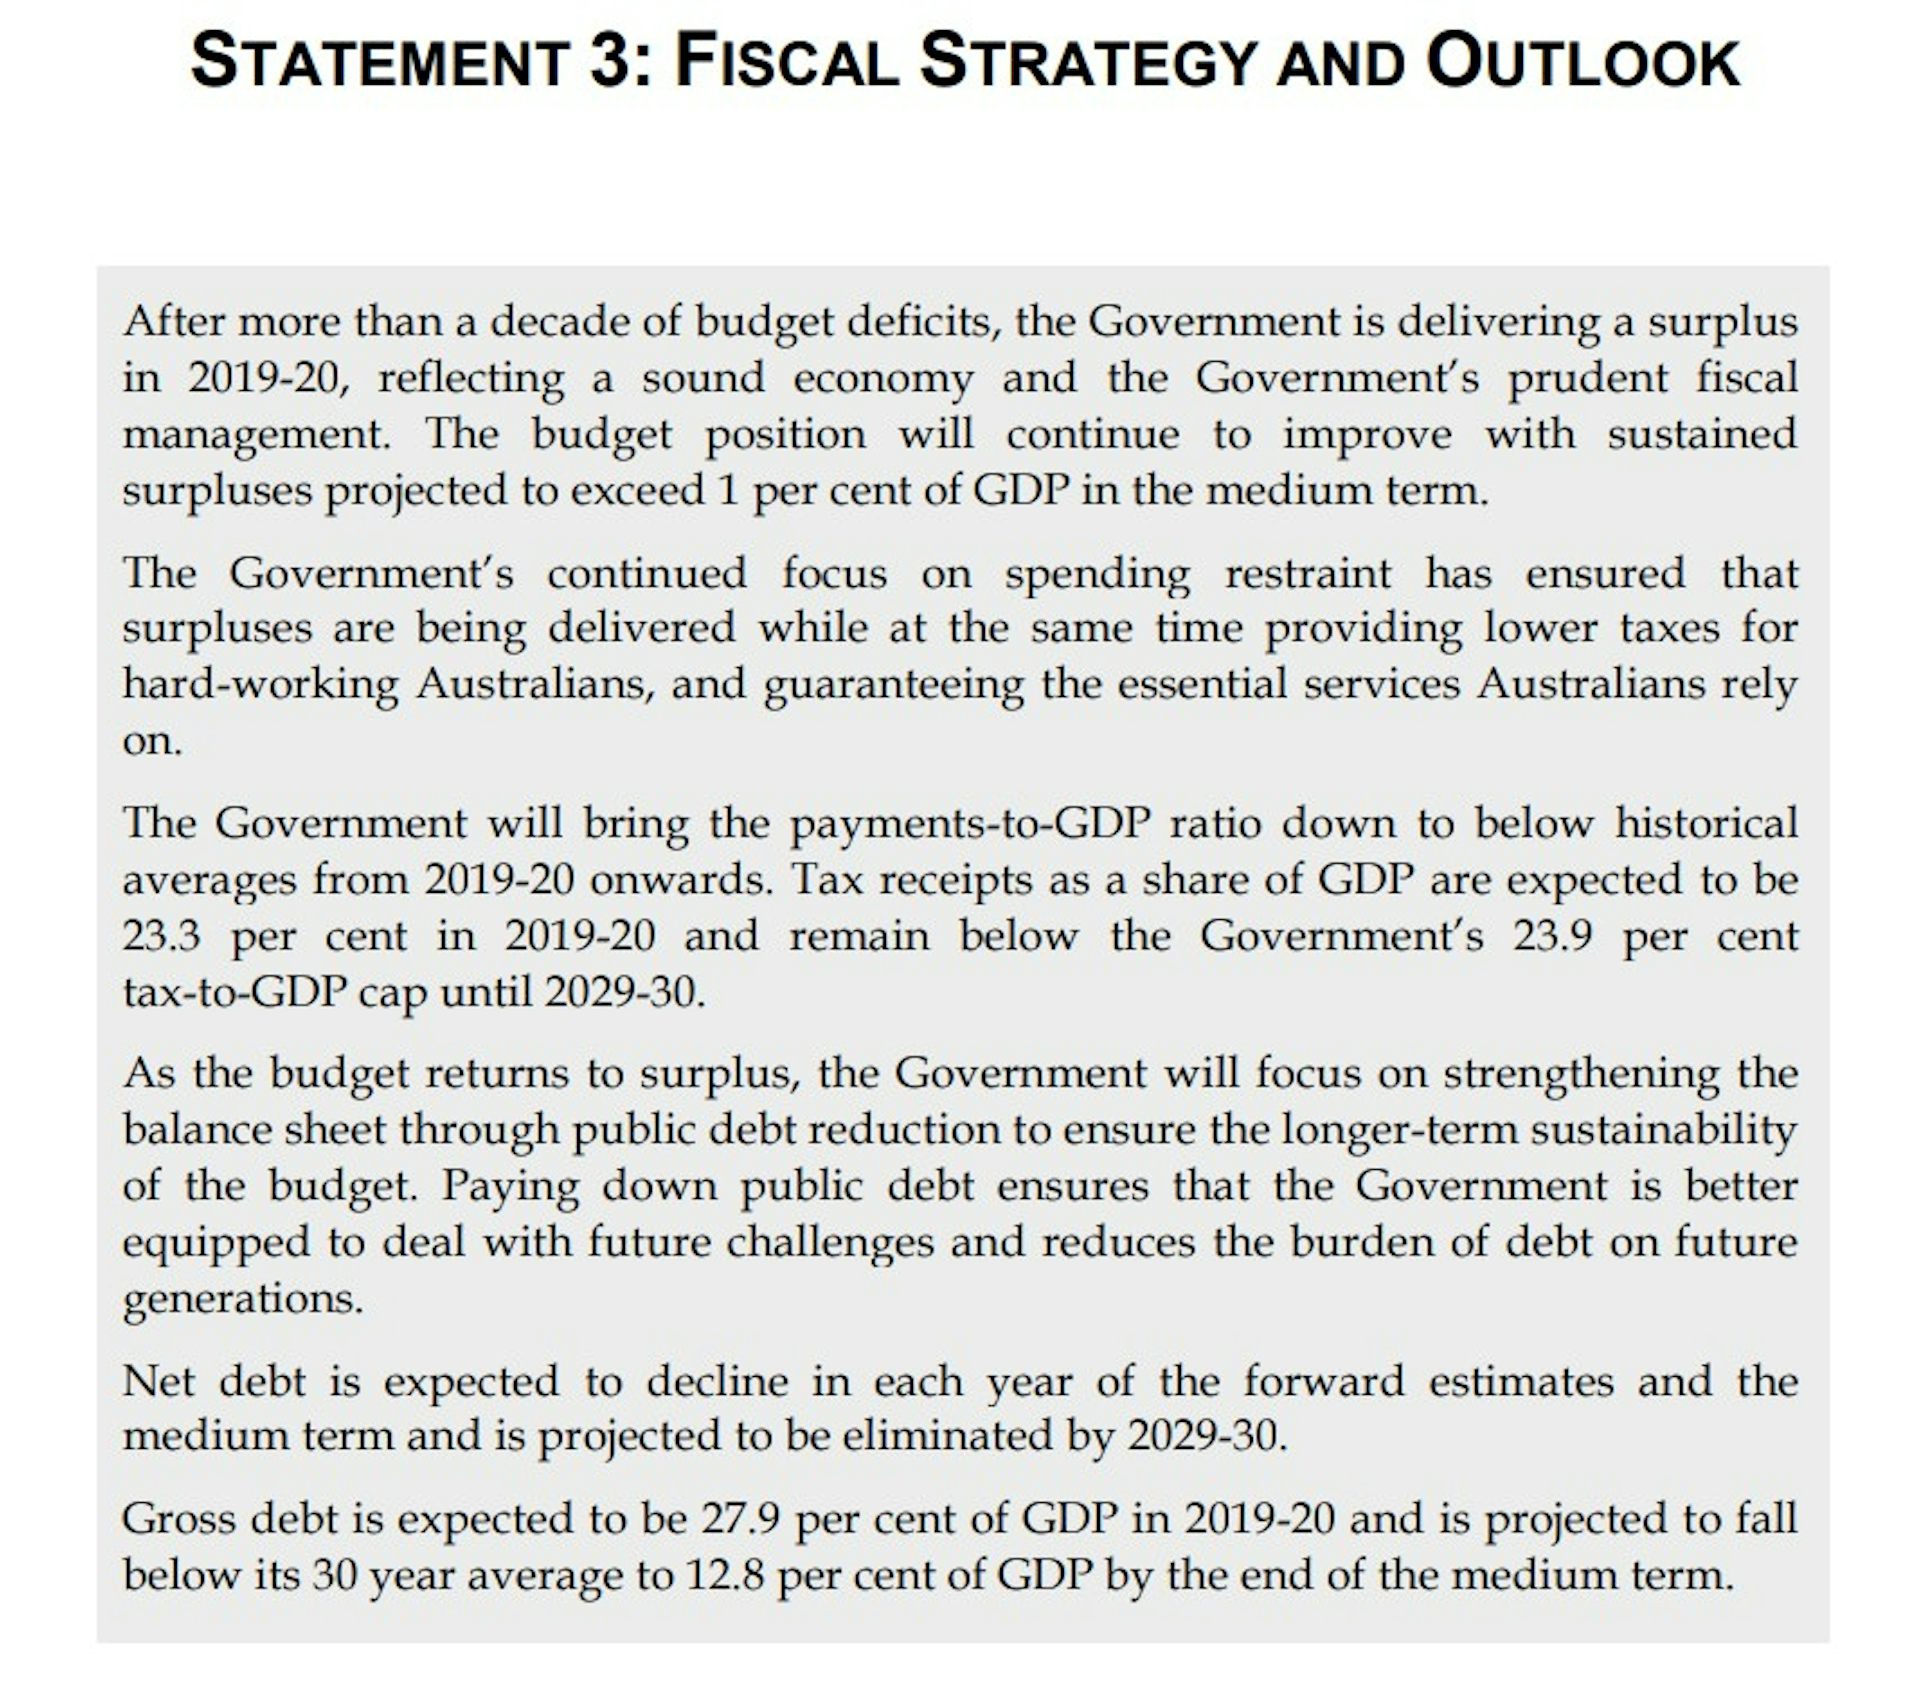
For a while, his predecessor Josh Frydenberg denied himself that room. In his first budget as treasurer under Scott Morrison ahead of the 2019 election, Frydenberg promised to get the budget “back in the black”.

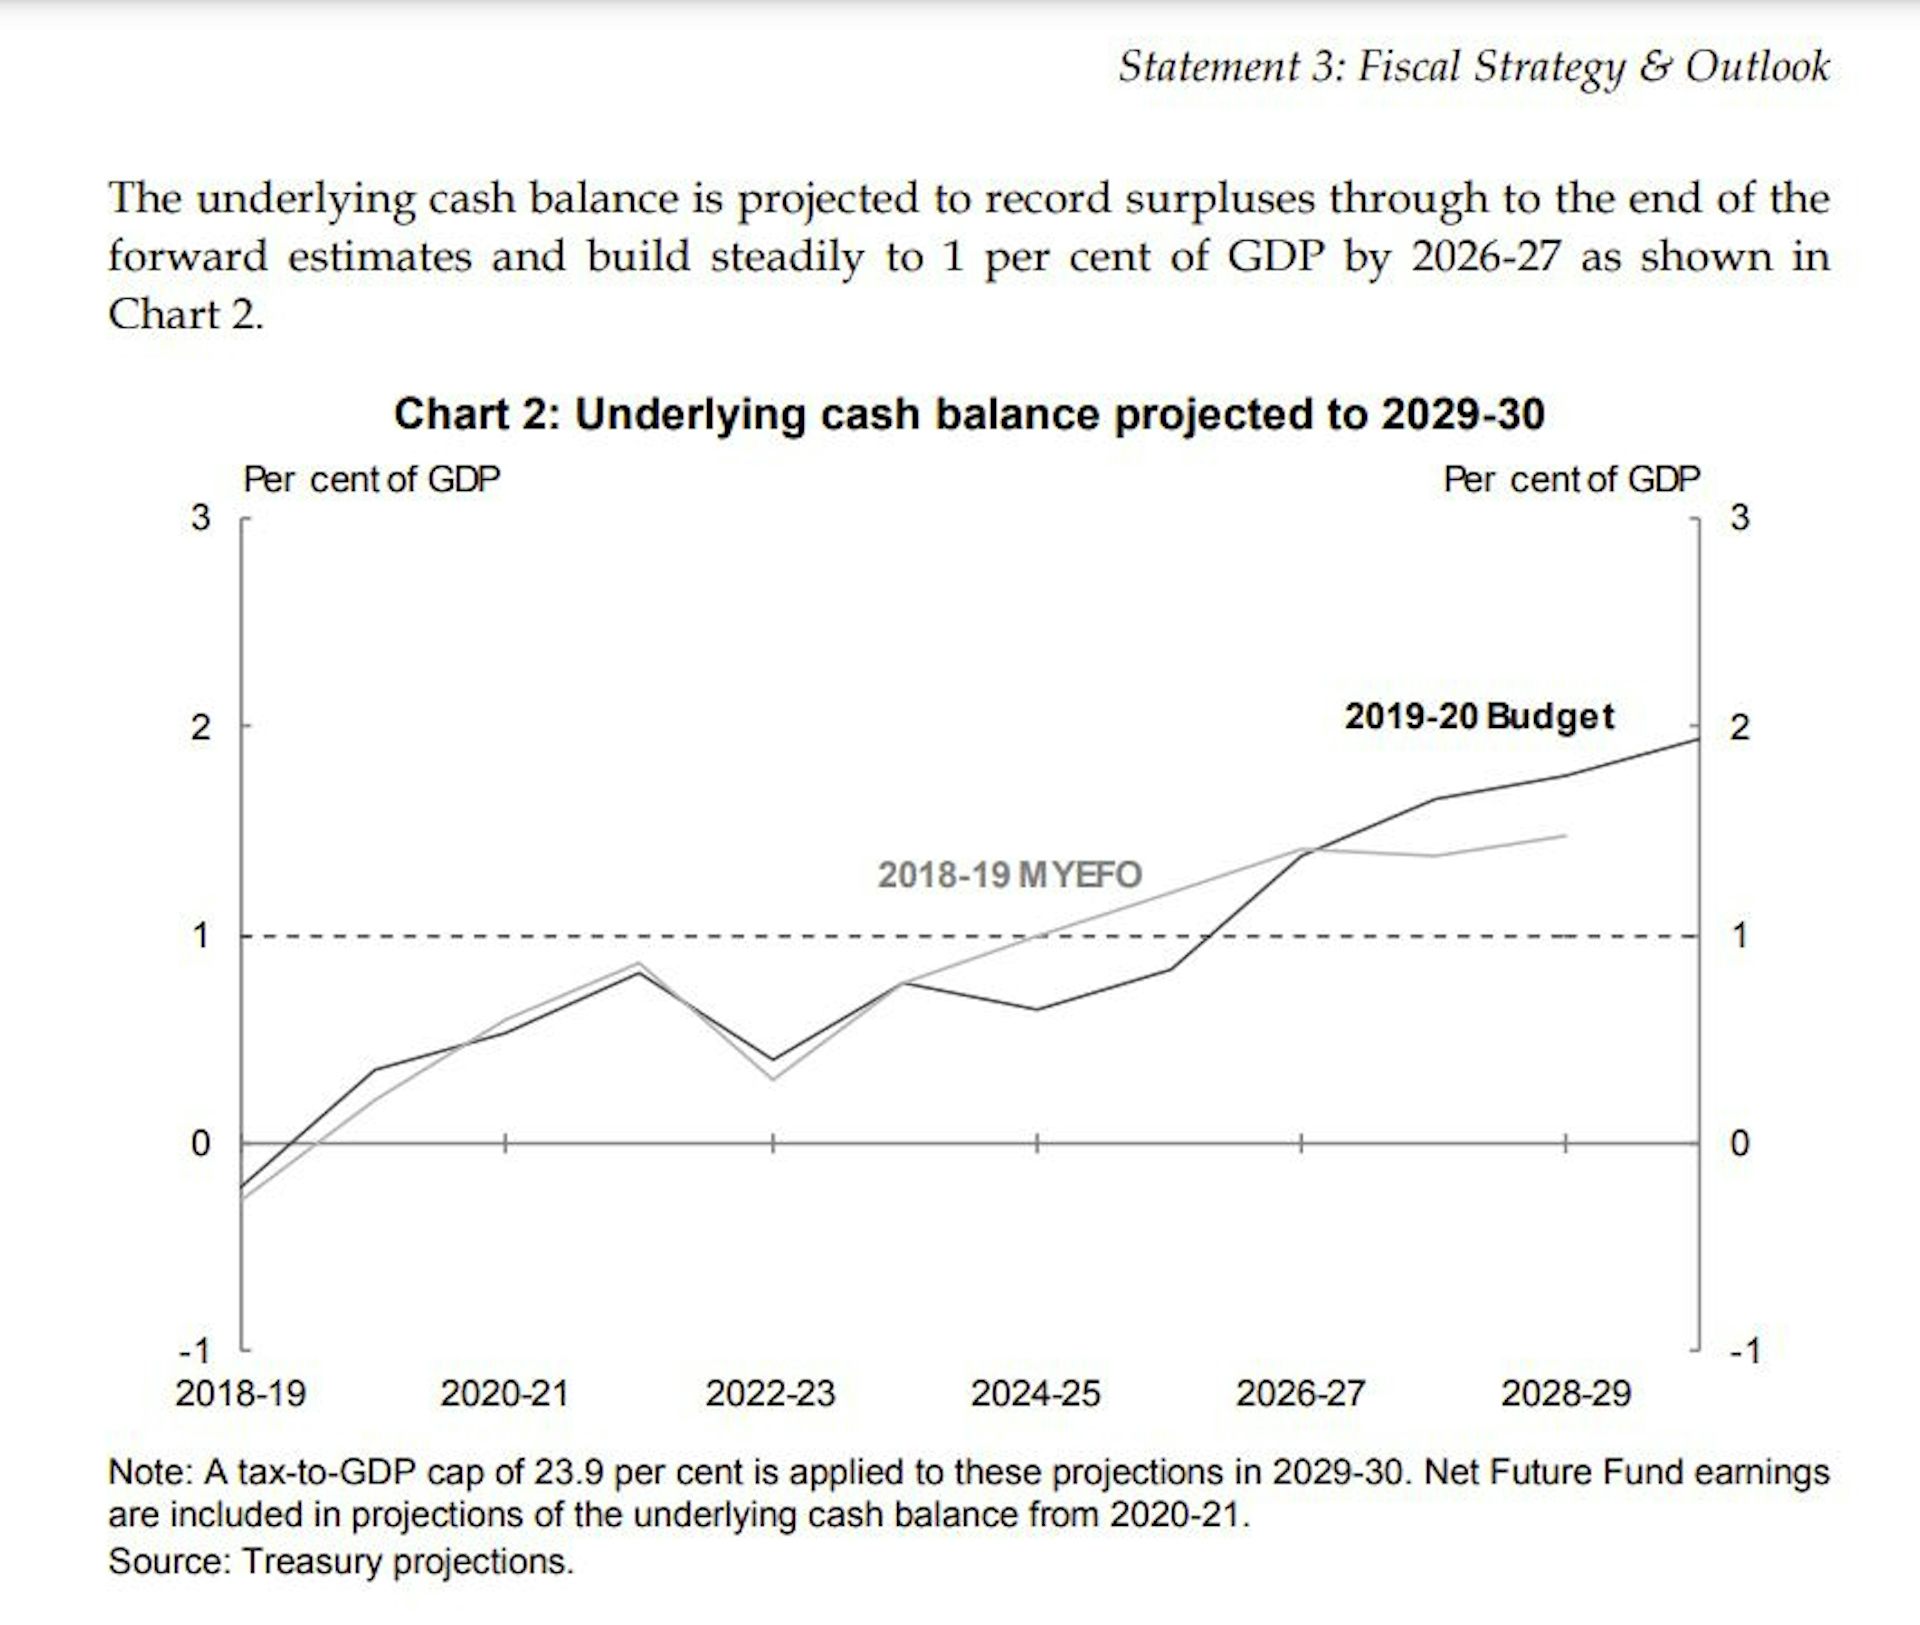
That 2019 budget forecast increasing surpluses as far as the eye could see (which was ten years, the limit of the graphs presented in the budget papers). The Liberal Party began selling “back in the black” celebratory mugs at A$35 each.

Liberal Party of Australia, 2019

The trick was that from then on, government spending would grow more slowly than the rest of the economy. As a proportion of GDP, it would slide from around 25% to 23.6% by 2029-30.

For that to happen, all sorts of government programs would have to become and stay less ambitious for ten years. But instead of details, Frydenberg’s department gave us gobbledegook – such as that lower payment projections had been

driven by lower than expected payments across a range of programs in the forward estimates flowing through to the medium term.

It made substantial extra spending near-impossible.

The 2019 budget assumed that the cost of National Disability Insurance Scheme couldn’t blow out (it has), that governments couldn’t spend more in response to aged care and disability royal commissions (they’ll have to), or pay aged care workers the big rises the Fair Work Commission is about to award, and so on.

COVID changed everything – except the tax cap

Just about every fairly foreseeable crisis couldn’t be responded to, if the assumptions in the 2019 budget were to be believed.

Not even by raising more tax. A separate “tax cap” set out in the budget said the government would never collect more than an arbitrarily chosen 23.9% of GDP.

Frydenberg tied his own hands in a way a treasurer who wanted to take charge of the nation’s finances would not have.

Until COVID. Within a year, Frydenberg junked the “back in the black” pledge and spent big, because he had to.

But he kept in place the bizarre 23.9% tax cap. The Liberal Party campaigned on it in the election, challenging Chalmers to adopt it.

No tax cap – but what comes next?

But here’s how much Chalmers really wanted the job of treasurer. In an election in which Labor repeatedly presented itself as a small target, Chalmers said “no” to the tax cap, over and over again.

Asked on ABC’s 7.30 last month whether next week’s and future budgets would be bound by the tax cap written into Frydenberg’s final budget, he said the cap had been more or less “plucked out of the air”.

And I had the courage, if I can say that, to say that before the election as well as during the election campaign.

His task was to fit the budget to the conditions Australia faced: rising inflation, falling real wages, rising interest rates, and looming recessions worldwide.

The amount he would have to spend, and the amount he would have to raise, would be the result of those deliberations.

And it would be the result of things beyond any government’s control. Unexpectedly, the Coalition almost breached its tax cap in its final year in office because of a flood of revenue flowing from higher commodity prices and a greater than expected number of Australians in jobs. It took in 23.4% of GDP.

What would it have done if it had breached the cap? Given the money back?

Growing demands on the budget

The demands on future budgets will be enormous. Not only paying for the National Disability Insurance Scheme and aged care, but also Medicare, hospitals, defence, education, rent assistance, boosting the scandalously low rate of JobSeeker, and dealing with increasingly frequent floods and climate change.

Australians expect these challenges to be taken seriously.

Labor’s actual election promises aren’t that expensive. The parliamentary budget office found a net impact of $6.9 billion over four years.

In Tuesday’s budget, Chalmers will find much of the money for those promises by cancelling decisions made in Frydenberg’s March budget. An upside of having budgets in both March and October this year is that a lot of the money committed in March hasn’t yet been spent.

How do we pay for what we need most?

But beyond that, Chalmers says he is up for a serious conversation about how we pay for the services we need and have a right to expect.

A former head of the prime minister’s department, Michael Keating, wants an expert committee (“not a royal commission made up of lawyers”) to prepare a bottom-up estimate of the extra revenue we will need to guarantee the essential services we are likely to need.

After the committee has developed the estimate, Keating wants a second inquiry to work out how best to raise it.

Economist Ross Garnaut told September’s jobs summit that as a share of GDP, total federal, state and local government tax revenue was 5.7 percentage points below the developed country average.

On one calculation, that means Australia could raise an extra A$140 billion a year and still be taxed at developed country rates. It needn’t all come from income tax. Most developed countries have much bigger goods and services taxes than we do, and many have windfall profits taxes, and effective taxes on energy exporters.

And it needn’t all be raised now. There’s no point in taxing more for the sake of taxing more. But we are likely to need to raise more in future, to help fix the kinds of problems we’re likely to face in the future.

That’s the overdue conversation we have to have, starting Tuesday.The Conversation

This article is republished from The Conversation under a Creative Commons license. Read the original article.

Read more >>

Thursday, September 22, 2022

Global recession is increasingly likely. Here’s how Australia could escape

Global stock markets are tanking on fears of recessions in the US, the UK and Europe, and the OECD is actually forecasting recessions in Europe.

So is recession now inevitable in Australia? Not at all.

The good news is there are several reasons to think Australia might be able to escape a global slide into recession – though it will need careful management.

What could push Australia into recession?

Here’s the worst case scenario. The United States keeps pushing up interest rates until it brings on a recession, and Australia gets pressured to do the same.

Here’s how it’s playing out at the moment. The US Federal Reserve has lifted rates at each of its past five meetings. The past three hikes have been massive by Australian and US standards – 0.75 percentage points each, enough to slow already-forecast US economic growth to a trickle, which is what the Fed wants to fight inflation.

But the Fed is planning to go further. Its chair, Jerome Powell says he expects ongoing increases, and last week countenanced the possibility they would throw the country into recession:

We don’t know, no one knows, whether this process will lead to a recession or if so, how significant that recession would be. That’s going to depend on how quickly wage and price inflation pressures come down, whether expectations remain anchored, and whether also we get more labour supply.

Powell is saying he is prepared to risk a recession to get inflation down.

The UK’s top banker already expects a recession

Powell’s not alone. His UK equivalent, Bank of England governor Andrew Bailey, has lifted rates seven times since December. Bailey says he is prepared to do more to fight inflation – “forcefully, as necessary” – and is actually forecasting a recession, which he says has probably started.

So alarmed is the new UK government headed by Liz Truss that on Friday it unveiled a £45 billion (A$75 billion) “growth plan” made up of tax cuts and infrastructure spending, on top of spending of £60 billion (A$100 billion) to cap household and business energy bills.

Given what’s now happening overseas, you might expect Australia’s Reserve Bank to take note and behave differently to central banks overseas.

Except it’s not quite that easy.

Pressure to follow the US

Whenever the US hikes interest rates (it’s hiked them seven times since March), investors buy US dollars to take advantage of the higher rates. This forces up the price of the US dollar in relation to currencies of countries that didn’t hike.

This means unless countries such as Australia hike in line with the US, the values of their currencies are likely to fall in relation to the US dollar – meaning their values are likely to fall in relation to the currency in which most trade takes place.

This means more expensive imports, which means more inflation.

And Australia’s Reserve Bank is trying to contain inflation.

The upshot is whenever the US pushes up rates (no matter how recklessly) there’s pressure on Australia to do the same, simply to stop inflation getting worse.

The risk of ‘a gratuitously severe recession’

Since March, when the US began pushing up interest rates more aggressively than Australia, the value of the Australian dollar has slid from US0.73 to less than $US0.65, putting upward pressure on goods traded in US dollars of about 11%.

With Australian inflation already forecast to hit 7.75% this year, way above the Reserve Bank’s 2-3% target, still more inflation is what the bank doesn’t want.

This locks countries such as Britain (whose currency has fallen to an all-time low against the US in the wake of the tax cuts) and Japan (whose government has intervened to try to stop its currency falling) into a semi-dependent relationship with the US.

Failing to follow its lead makes inflation worse.

It is why US economist Paul Krugman says there is serious risk the Fed’s actions “will push America and the world into a gratuitously severe recession”.

Going your own way can hurt your dollar

The risk isn’t merely that the US will go too far. The risk is that other countries, including ours, will ape the US in pushing up rates to maintain the value of their currencies, amplifying the effect of a US recession and making it global.

It’s often said that central banks hunt in packs. What’s less often noted is the pressure they are under to follow each other.

In Australia, AMP chief economist Shane Oliver puts it starkly: if the Reserve Bank doesn’t follow the US Fed, the Australian dollar might crash.

But here’s the good news. We know Australia can avoid the worst of global economic downturns, because we’ve done it before.

How Australia has avoided past recessions – and can again

Australia avoided recession during the 1997 Asian financial crisis, we escaped the 2001 US “tech-wreck”, and we avoided the “great recession” during the global financial crisis.

In part, this has been due to excellent judgement. Our Reserve Bank was able to take clear-eyed decisions about when to follow the US on rates and when not to.

At times it was helped by high commodity prices, which are high again following Russia’s invasion of Ukraine and which are supporting our currency, even though we are increasing rates less aggressively than the United States.

At the right moment, Australia’s Reserve Bank would be wise to decouple from the US. If the Fed pushes up rates to the point where it is about to bring on a US recession, Australia would be well advised to stand back and not lift rates, letting the collapse of the US economy bring down inflation by itself.

If Australia’s Reserve Bank thinks that moment is approaching, it should consider shrinking the size of its rate rises (the last four have been 0.5 percentage points).

Its next meeting is next Tuesday. Because of its importance, the Bureau of Statistics is bringing forward the publication of its new monthly measure of inflation to this Thursday, publishing the results for both July and August at once.

But the bank will need more than information. It’ll need the intuition and common sense that has kept us out of trouble in the past.The Conversation

This article is republished from The Conversation under a Creative Commons license. Read the original article.

Read more >>

Tuesday, September 20, 2022

The Mint and Note Printing Australia make billions for Australia – but it could be at risk

Briefly, in the days after the death of the queen, we were afforded a glimpse into the machine that makes Australia’s money.

Assistant Treasury Minister Andrew Leigh turned up at the Royal Australian Mint to explain the process by which a portrait of the King Charles will replace the portrait of the queen on the heads-side of coins minted from 2023.

(And yes, he noted “for the avoidance of doubt, for any conspiracy theorists out there, all coins bearing the face of Queen Elizabeth II will remain legal tender”.)

The Mint makes an extraordinary 120 million to 140 million coins per year (even more, as much as 175 million when Australians stocked up on cash during the first year of COVID), and it is a money-making operation in more ways than one.

20 cents to make a $2 coin

Usually it costs the Mint far less to make each coin than each one becomes worth the moment it is sold to a bank (before metal prices climbed, it cost the mint about 20 cents to make a $2 coin, and about 15 cents to make a 50 cent coin).

The profit – the huge markup – goes straight to the Commonwealth budget as non-taxation revenue, tens of millions per year. It’s called “seigniorage”, an ancient French word that refers to the profit only a seignior (feudal lord) can make from the exclusive right to mint coins.

This financial year the government expects A$59 million, next year $67 million.

That the government can keep making money from seigniorage appears to defy common sense. Surely we’ve got just about all the coins we need. Merely replacing coins as they get worn out doesn’t earn seigniorage.

But a previous head of the Mint, Ross MacDiarmid, let the cat out of the bag in 2014 when he told a Senate committee:

most of the coins that we provide are against coins that disappear down the back of chairs, down the back of car seats, into rubbish dumps and, in some cases, are taken overseas.

Asked whether he was seriously suggesting a hundred million or so coins per year disappear, MacDiarmid replied he was.

This means the government makes tens of millions per year replacing – at a huge markup – things we have lost.

And it’s just the beginning. The $5, $10, $20, $50 and $100 notes made by Note Printing Australia for the Reserve Bank have an astronomical markup.

32 cents to make a $100 note

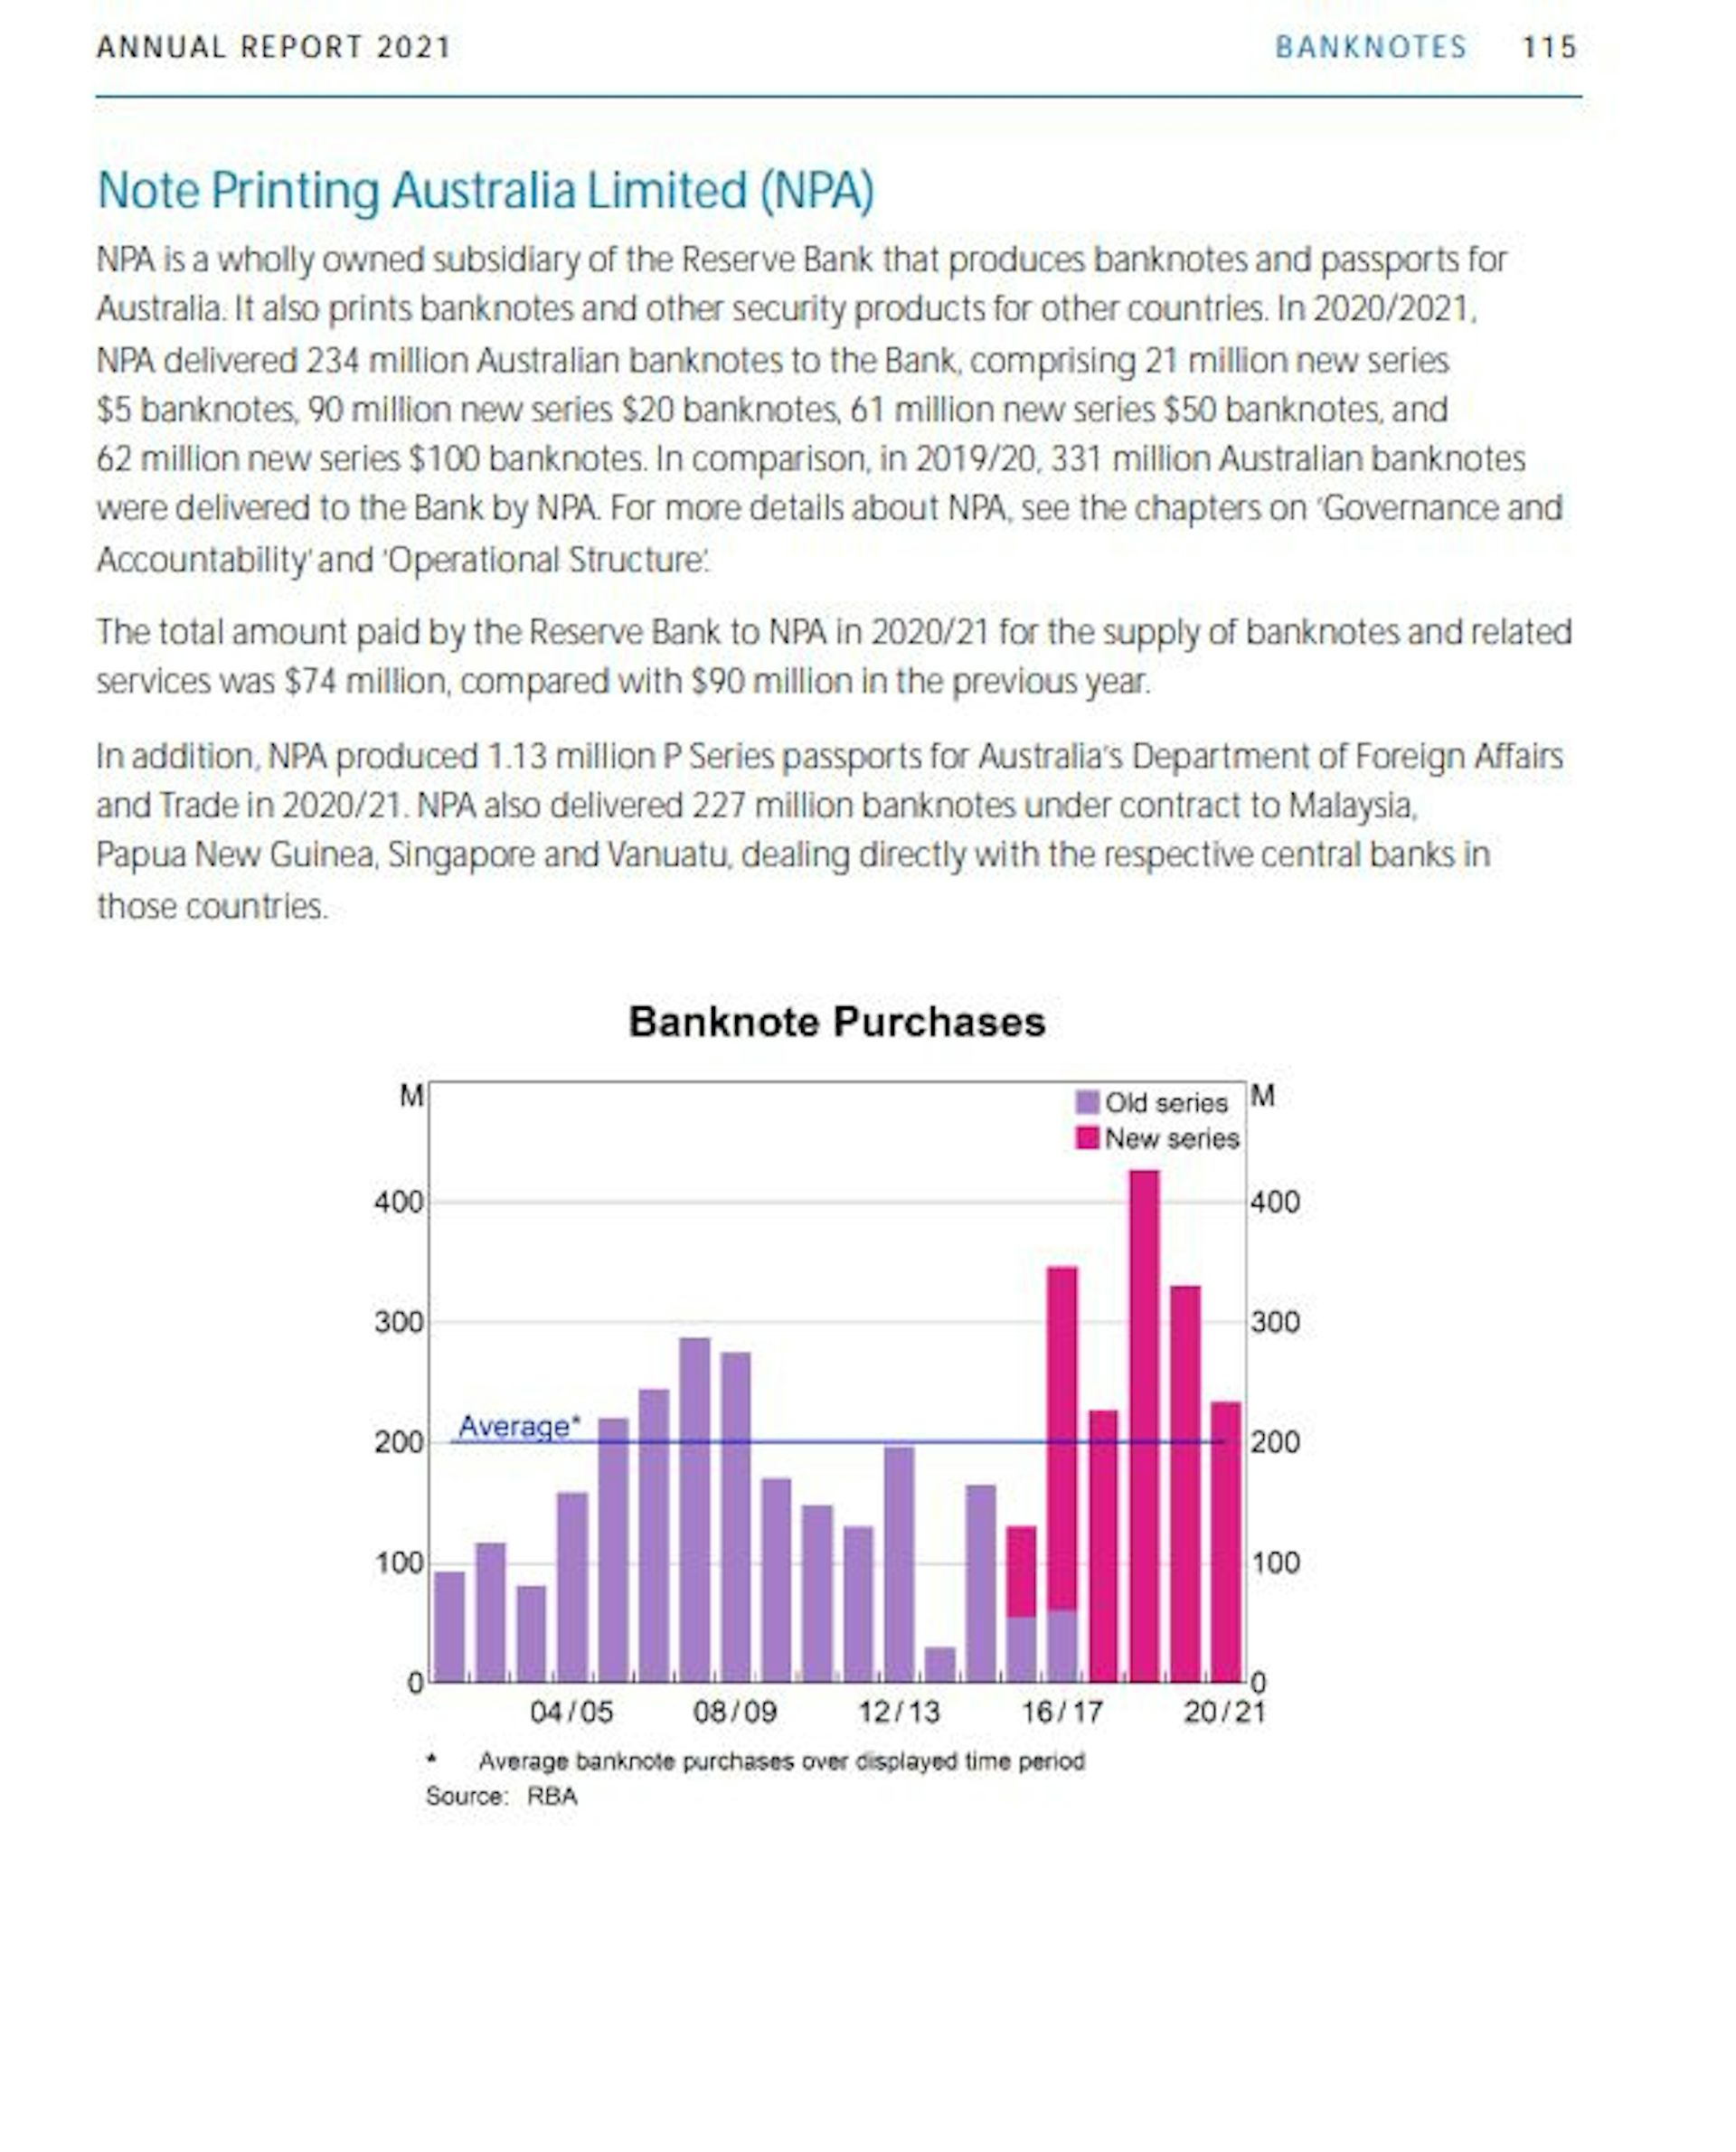
In 2020-21, Note Printing Australia delivered 234 million notes to the bank for a fee of $74 million, suggesting they cost about 32 cents each to make. Most were $50 and $100 notes, sold to private banks for $50 and $100 each.

That profit is accounted for differently to the profit for coins, and is hard to find.

One estimate, in an international study of 90 countries at the end of the 1990s, found Australia’s income from seigniorage of notes and coins to be low compared to other countries at 2.6% of government spending.

2.6% is an enormous amount. These days that’d be $16.3 billion, which is about what we spend on the Pharmaceutical Benefits Scheme.

$6-10 billion per year

The Reserve Bank measures seigniorage differently, using a formula that can produce odd results because it depends on the rate of interest. Before COVID, its view was that it only made about $1 billion per year from seigniorage, a figure it doesn’t usually calculate and doesn’t report to the government.

A simpler calculation would take the $6.8 billion of extra notes the bank supplied in 2020-21, deduct the $74 million it cost to print the notes and about as much again for the payments it makes to commercial banks to encourage them to hold sufficient stocks and return worn notes and come up with $6.6 billion.

A year earlier, as we stocked up on cash as COVID took hold, the bank would have made $10 billion.

An end to easy money?

The profits from printing notes don’t flow directly to the budget, except in part via Reserve Bank dividends, but they help by keeping the bank self-funding.

Profits from notes and coins are under threat. For the Reserve Bank it’s the threat of us one day wanting less cash – although for the moment, while we are using less cash in transactions, we are holding on to more for safekeeping than ever.

For the Mint, it’s the reality that we are using less cash. In 2020-21 it produced $82.2 billion worth of new coins, down from $114 billion a decade earlier.


Its other threat is the soaring price of metal. Mint chief executive Leigh Gordon revealed last week it was costing north of 12 cents to make each five-cent piece.

Earlier this year, after nickel prices soared in the wake of Russia’s invasion of Ukraine, he said even 20 cent coins were about to lose money.

Cheaper coins to the rescue?

Nickel prices have since come down, and one of the oddities of pricing is that it costs far less to make the largely copper and aluminium $1 and $2 coins (about eight cents each) than it does the nickel-heavy 10 and 20 cent coins (14-28 cents), but the Mint is preparing.

In 2016 the Mint developed a proposal to cheapen the metal content of its five, ten and 20 cent coins and shrink the size of its 50 cent coins, which it says was favourably received by retailers and banks who wanted coins that weighed less. The idea was submitted to the Treasury, but “not progressed”.

In the meantime it has partnered with Woolworths to produce limited edition “Olympic” and “Wiggles” coins that are delivered as change through cash registers rather than through banks, for which it charges a touch over $2.

There’s a lot that can be done, and every time there’s a crisis, we seem to rediscover cash. But eventually the money-making machine will stop.The Conversation

This article is republished from The Conversation under a Creative Commons license. Read the original article.

Read more >>

Tuesday, September 13, 2022

The certainty of ever-growing living standards we grew up with under Queen Elizabeth is at an end

Much has been written about how, with the passing of the Queen, we have lost one of our last continuing links to the second world war.

We have, but we have also lost something even more profound – the link she gave us back to when the kind of world we know began.

On Tuesday last week Queen Elizabeth appointed a new prime minister of Britain, Liz Truss, who was born in 1975.

Seven decades earlier, Elizabeth II ascended to the role alongside Prime Minister Winston Churchill, who was born in 1874.

That her first and last prime ministers were born a century apart is remarkable enough. But it is particularly significant that the thread of her reign extended all the way back, through Churchill, to the 1870s. That’s when it is possible to argue the expectations we grew up with began.

As the new UK Prime Minister was sworn in last week, University of California, Berkeley economist Bradford DeLong published his long-awaited Slouching Towards Utopia.

It’s an account of what he calls “the long 20th century”, a century he says began in 1870.

Why 1870, and not 1901, or even a century earlier at the start of the industrial revolution?

Because, DeLong says, right up until the 1870s living standards hadn’t changed much.

More importantly, living standards hadn’t changed much since the dawn of recorded time.

Until 1870, we weren’t much better off

In the millennia leading up to the birth of agriculture, what humans were able to produce barely increased at all.

In the 10,000-odd years between the year minus-8000 and the industrial revolution in 1500, our ability to produce food and other things increased tenfold, still not enough to be noticed over our (short) lifetimes.

Our ability to produce more than doubled again between 1500 and the 1870. But so did population, which kept most people desperately short of calories – and in near continual childbirth in an attempt to produce surviving sons – while necessitating smaller farm sizes that blunted the benefits of mechanisation.

From the 1870s, life got a lot better – fast

Then, from the decade of Churchill’s birth, things went spectacularly right.

Delong writes that in 1870 the daily wages of an unskilled male worker in London, the city then at the forefront of economic growth, would buy him and his family about 5,000 calories worth of bread. In 1600 it had been 3,000 calories.

He says today the daily wages of such an unskilled worker would buy 2,400,000 calories worth of bread: nearly 500 times as much.

The population grew, but our ability to produce things grew far faster. It grew to the point where, even in our lifetimes, we could see things getting better.

In the words of Billy Joel, every child had “a pretty good shot to get at least as far as their old man got”.

Unimaginable change in one lifetime

From the 1870s on, continual improvements in living standards became a birthright – not for everyone, but for humanity as a whole.

As did the development of once unimaginable products. The motor car, the radio, the television and the computer became ubiquitous during Queen Elizabeth’s life.

With more to go around, it became easier to share rather than take things. Democracies grew to the point where they became natural.

Economically, DeLong credits the development of research labs, modern corporations and cheap ocean transport that “destroyed distance as a cost factor”.

From the 1870s onwards, people were able to get what they wanted from where it was made, and were able to seek better lives by travelling to where they were needed.

University of California, Berkeley Professor Bradford DeLong’s economics lecture on ‘Slouching toward Utopia’.

Most economists didn’t see it coming

The market economy was necessary for this explosion in living standards, but not sufficient. People had bought and sold things for prices for millennia, but the prices had little to work with.

Almost no one saw such an extraordinary change coming.

The leading economist of the 1870s, John Stuart Mill, wrote it was “questionable if all the mechanical inventions yet made have lightened the day’s toil of any human being”. They had merely “enabled a greater population to live the same life of drudgery and imprisonment”.

Mill wanted population control. He wanted the expanding “pie” to be split among the people we had, rather than the hordes that would grow to cut each slice back to size.

The fathers of communism, Karl Marx and Frederick Engels, saw things more clearly. They expected technology and the taming of nature to produce so much wealth that there would one day be more than enough to go around, making the problem one of how to make sure it went around.

DeLong sees the long 20th century that began in 1870 as an ever-shifting battle between those who wanted the market to determine the distribution of wealth (believing it was the best way to grow the pie), against those who believed such unfairness wasn’t what they signed up for.

The end of certainty

How long did that “long 20th century” last? DeLong thinks it ended in 2010, making it a long century of 140 years. Since the global financial crisis, we have been unable to return economic growth to anything like the pace of those 140 glorious years.

Today, DeLong says material wealth remains “criminally” unevenly distributed. And even for those who have enough, it doesn’t seem to make us happy – at least “not in a world where politicians and others prosper mightily from finding new ways to make and keep people unhappy”.

DeLong sees “large system-destabilizing waves of political and cultural anger from masses of citizens, all upset in different ways at the failure of the system of the twentieth century to work for them as they thought that it should”.

Not only are we not near the end of the Utopian rainbow, Delong says the end of the rainbow is “no longer visible, even if we had previously thought that it was”.

King Charles III inherits a future with no guarantee of ever-increasing living standards, no guarantee human ingenuity will prevail over global warming, and no guarantee democracy will prevail.

It’s almost impossible to predict what the rest of this century has in store. But that’s how it was in the 1870s too – when even the brightest minds of the time couldn’t imagine what was to come.The Conversation

This article is republished from The Conversation under a Creative Commons license. Read the original article.

Read more >>

Tuesday, September 06, 2022

Australians on unemployment benefits are set for two record paydays – but it’s a sign of a broken system, long overdue for a fix

Australians on our humiliatingly-low unemployment benefit are about to get their biggest payday ever.

On September 20, the single rate of JobSeeker will climb A$25.70 per fortnight from $642.70 to $668.40. That’s the biggest automatic increase since the payment began at the turn of the 1990s, and twice as big as the next-biggest.

But it will still be a pitiful $17,378 a year – not even two-thirds of the way to meeting the Melbourne Institute’s poverty line of around $28,600 a year.

If the official forecasts turn out to be correct, the next increase (on March 20) will be of a similar order, meaning JobSeeker will have jumped 7.75% in a year, which ought not to be surprising, because inflation will have reached 7.75%.

Until now, pensioners have had a better deal

JobSeeker is linked to inflation, the rate of increase in prices, which has been low since the early 1990s. Wages and national income per person have climbed faster.

Pensioners, including age pensioners, have had a better deal. Since the 1990s, their incomes have been linked to male total average earnings, with a bonus clause that gives them inflation if male earnings don’t climb enough.

The difference between the growth in male earnings and inflation hasn’t amounted to much in any given year – typically 0.6 percentage points, meaning that if inflation was 2.5%, wages were likely to climb 3.1%.

But because wages nearly always grew by more than inflation, even if not by much, over time the compounding of those differences came to matter a lot.


JobSeeker (when it was called Newstart) used to be close to the age pension. In 1997 JobSeeker was A$321.50 per fortnight, and the age pension was $347.80.

But an accumulation of larger percentage increases in the pension (and a one-off increase in the pension) meant that by 2019, on the eve of COVID, the pension was 50% bigger.

Projections based on the then-prevailing rates of inflation and wages growth suggested that, unless something changed, the pension would be twice as much as JobSeeker by 2070.

So weak had JobSeeker become in relation to general living standards (well below the poverty line) that early in COVID in 2020 the Coalition effectively doubled it by adding on a $550 per fortnight coronavirus supplement.

Not enough to ‘meet the cost of groceries’

In an implicit acknowledgement that JobSeeker was no longer enough to feed and house people, then Treasurer Josh Frydenberg said the temporary bonus would allow unemployed people to “meet the costs of their groceries and other bills”.

When the temporary supplement ended, the treasurer lifted JobSeeker by only a little – $50 a fortnight, making the point that unemployment was meant to be temporary, whereas the age pension was for the remainder of a pensioner’s life.

There are two other important differences.

One is that the age pension goes to an identifiable voting bloc – three in every five of the Australians aged 65 and older. Dudding them would cost votes. There aren’t as many unemployed, and many of them are just passing through unemployment.

Matching JobSeeker to the pension would cost billions

The other difference is that JobSeeker is now so low relative to the pension that boosting it from its present $642.70 per fortnight to anything like the pension rate of $901 per fortnight would cost multiples of the $2.2 billion per year the government budgeted for the $50 increase.

Unemployed Australians (and those on Youth Allowance and other payments that have only increased in line with the consumer price index) seemed condemned to live an income so low as to raise concerns even 12 years ago about:

its effectiveness in providing sufficient support for those experiencing a job loss, or enabling someone to look for a suitable job

And no, those concerns about Australia’s comparatively low unemployment benefits weren’t raised from the Australian Council of Social Service – it was from the hardly radical Organization for Economic Co-operation and Development (OECD), in 2010.

These days the OECD is headed by former Liberal minister Mathias Cormann.

Former prime minister John Howard has expressed regret about allowing JobSeeker to fall so low relative to the pension.

In opposition, Anthony Albanese said it was not enough to live on.

Abbott tried to put pensions in line with jobless benefits

Just for now, the collapse in wages growth and the resurgence in inflation has frustrated what seems to have been a deliberate decision to allow JobSeeker to grow more slowly than the pension.

But it ought to be frustrated for good. Whatever the arguments for setting JobSeeker lower than the pension (the Centre for Independent Studies says pensions are for those out of work for “legitimate reasons”) there’s no defensible argument for a system that allows one to keep falling relative to the other.

Tony Abbott’s Coalition government deserves credit, sort of, for acknowledging this. In its first “horror budget” in 2014, it promised to put pension increases on the same footing as increases in the unemployment benefit.

“We promised at the last election not to change pensions in this term of government and we won’t,” his treasurer told parliament.

But beyond the next election, from September 2017, pensions would only increase in line with inflation, in tandem with unemployment benefits.

Like much of the rest of that budget, the measure didn’t survive a change of treasurer and prime minister.

Cheaper than the Stage 3 tax cuts

In the lead-up to the 2019 election, Labor promised an independent review of JobSeeker. Albanese withdrew the promise ahead of the 2022 election, saying the budget could not withstand it.

His commitments were about priorities. The starting cost of the previous government’s legislated Stage 3 tax cuts, supported by Labor, is $17.7 billion per year, which is less than making JobSeeker match the rate of the pension.

Half of the Stage 3 benefits accrue to Australians earning $180,000 or more.

Beyond the September 20 increase, lifting JobSeeker further in future would change the lives of Australians on $17,378.

In a Radio National interview on Monday, Albanese sounded as if he was open to doing something soon.

When inflation comes down, he won’t be able to rely on unusually high price rises to do the work for him.The Conversation

This article is republished from The Conversation under a Creative Commons license. Read the original article.

Read more >>

Tuesday, August 30, 2022

What is productivity, and how well does it measure what we do?

One word gets mentioned more than “jobs” and more than “skills” in the briefing paper for Thursday’s jobs and skills summit. It’s “productivity”.

Which is odd, because although many of us think we know what productivity is, and although many more assume productivity can be easily measured, it’s a surprisingly slippery concept.

In a report released earlier this month, the Productivity Commission (yes, we have an entire commission devoted to productivity) makes the idea sound simple.

It presents an equation:

productivity = output divided by input

The commission makes the reasonable point that producing more output (of anything – flowers, healthcare, food) per unit of input, so long as the quality is maintained, ought to be the goal of life.

Who wouldn’t want to clean a house in five hours instead of ten? Who wouldn’t want to manufacture a car in five hours instead of ten?

Who wouldn’t want more for less?

You could use the freed-up time to kick back or make more of what you really want. And because you were producing more per hour worked, you would be in a good position to get a pay rise.

The commission is careful not to say you would get a pay rise. Instead it says that where there have been sustained pay rises above inflation, they have almost always been underpinned by increased productivity.

How much of the pay-off from an increase in output per hour worked goes to wages depends, among other things, on bargaining power.

Since 1990, the share of the spoils (technically, the share of total factor income) going to profits has climbed from 24% to 31%, while the share going to wages has fallen from 55% to 50%.


But it ought to be beyond doubt that the only guaranteed way to be able to lift living standards is to lift productivity. Beyond a certain point, working more hours won’t help, because, in the words of the commission, “there are only so many hours in the day to work”.

Nor will using more resources. They are finite. The only certain way to continue to get more of what we want is to get more from what we’ve got – which is the definition of productivity.

And just lately, productivity growth has slowed to a crawl, to what the briefing paper for the summit describes as the lowest rate in half a century.

Lifting productivity has become harder

It’s probably not because we’ve run out of ideas, although it might be because we used up a lot of good ones. Back when enterprise bargaining was introduced in the early 1990s, when we were asked to find improved ways of doing things at work in return for pay rises, we did it. But it became harder to keep finding gains as big.

More broadly, the extraordinary success of the productivity gains we made in manufacturing and agriculture have made them less important as employers. Now most of us (almost 90%) work in services. And services are hard to automate.

Worse still, it’s hard to tell what the output of many services is. There’s a reason the debate about the government’s commitment to defence is couched in terms of spending. It’s hard to tell what we get.

Productivity has become harder to measure

What about hairdressing? A hairdresser who trims twice as many heads per day isn’t necessarily twice as good, even if the quality of each trim remains the same. Part of a good hairdresser’s service is the quality of attention they offer each customer.

It’s the same for health care and education. That’s one of the reasons the Australian Bureau of Statistics doesn’t produce estimates of the productivity of the “health care and social assistance” or “education and training” industries, two of Australia’s biggest industries.

And many education and health services are provided free or subsidised, making the price charged an unhelpful measure of output.

(The bureau is planning to introduce “experimental” estimates of the productivity of the education industry next year, but it is finding it hard. It wants to define the output as the “organised communication of knowledge from teacher to student”, which gives an idea of how murky the whole idea is.)

Putting quality of work and life on the summit’s agenda

Economy-wide, the Productivity Commission relies on the bureau’s rough and ready measure: gross domestic product per hour worked, but it’s misleading for the same reason.

Labor came to office promising every Australian living in aged care would receive an average of 215 minutes of care per day.

When that happens, it will be a drag on measured productivity – on GDP per hour worked. Yet it will hugely improve the lives of Australians.

It makes sense for the summit to focus on productivity, given that measured productivity growth has slowed, but it should only be part of the conversation.

Other more personal things matter as well, among them the quality of our lives, the quality of our care, and the quality of our jobs – something those attending would be wise not to forget.The Conversation

This article is republished from The Conversation under a Creative Commons license. Read the original article.
Read more >>

Monday, August 29, 2022

Is education or immigration the answer to our skills shortage? We asked 50 economists

Wes Mountain/The Conversation, CC BY-ND
Investing in Australians’ education is far more important than immigration in resolving the nation’s skills shortages, according to leading economists surveyed in the lead-up to this week’s jobs and skills summit.

The 50 top Australian economists polled by the Economic Society of Australia and The Conversation are recognised by their peers as leaders in their fields, including economic modelling, labour markets and public policy.

Asked to select from a list of topics to be discussed at the summit, and which offered the most promise of delivering better outcomes, two-thirds picked “education and skills”. Only one-third picked “migration policy”.


The biggest concerns among those who picked “education and skills” relate to school and vocational education.

The Australian National University’s Bruce Chapman, who designed Australia’s higher education loans scheme (HECS) in the late 1980s, described funding for vocational education as a “mess”.

Vocational training is a “mess”

“There are up-front fees alongside no-charge regimes, both of which are poor and inequitable,” Chapman said. “A small number of courses offer income-contingent loans along the lines of the university scheme, but most do not.”

Universities have income-contingent loans that don’t require payments until the recipient’s income climbs above A$48,361.

If applied to all vocational education courses (including TAFE courses), it would allow reasonable charges and protect students from hardships and default.

“Governments should have been aware of this for the 34 years that HECS has existed, but have shown no leadership in the area,” Chapman said.

High school outcomes remain poor

Saul Eslake said all levels of Australian education – from primary school, up to vocational education and universities – are “failing to equip Australians with the skills required for the jobs of both today and the future”.

Among the many causes of that failure were inequities in how education funding is distributed, which have led to sustained gaps between Australia’s high and low socio-economic students’ results.

Paul Frijters suggested levelling the playing field between private and public schools by ditching subsidies to private schools, banning mobile phones in schools, and allowing children with low grades to repeat years instead of setting standards so low they were generally promoted.

Almost half of those surveyed wanted measures to promote productivity. Julie Toth, formerly with the Australian Industry Group and now with the digital property settlement company PEXA, suggested shifting governments’ focus away from “creating local jobs” to automating tasks wherever possible.

“We should be aiming to reduce the need for lower-skill and lower-value tasks and jobs, rather than simply seeking more bodies to do them,” she said.

Full working rights for refugees

Of those who nominated “migration policy” as a priority, two warned against using more migration to fix skills shortages. Labour market economist Sue Richardson said she knew of no evidence that migration increased either productivity or the living standards of pre-existing Australians.

“It does increase aggregate gross domestic product,” she said. “But that is just because the population is bigger”. It enabled Australia to avoid a close examination of why it did not generate the skills it needed itself.

Margaret Nowak of Curtin University pointed to the absurdity of not giving refugees and those awaiting determination an unfettered right to work. She said it would be an “easy early win”.

“We already have in this country a ready and willing supply of labour,” Nowak said. “We should get rid of the paranoia and ideology inherent in the current administration of the policy and welcome our resident refugees into full participation and education rights.”

Many economists also nominated workforce participation, care jobs and equal pay for women as key priorities for the summit.

Calibrating care

Several, including RMIT University’s Leonora Risse, called for more accurate measurement of the benefits generated by the care sector, “in the same way as we compute the cost/benefit dividend of government investments in other infrastructure”.

Risse said a proper measure of the economy-wide value of the care sector could be factored into the budget, and used to provide a mechanism to lift the wages and status of care workers.

Macquarie University’s Lisa Magnani said the pandemic had shown Australia has a crisis of care work “manifested in the shortage of teachers, in overworked hospital workers, in exhausted parents”. Traditional measures of labour productivity failed to capture the impact of care jobs on wellbeing, as well as their economic value.

Alison Preston of The University of Western Australia said health care and social assistance had become Australia’s biggest employing industry, eclipsing retail and construction.

Specific measures to assist the health care and social assistance sector’s 76% female workforce included extending parental leave, minimising the need to hold multiple jobs, and setting and monitoring employment standards.

One of the 50 surveyed economists nominated a summit priority that was not on the proffered list. John Quiggin of the University of Queensland nominated “full employment”, which he thought had been the original idea for the summit.

Regardless of the present state of the labour market it was important to renew to full employment in the 1945 Employment White Paper, and to consider measures along the lines of the proposed Green New Deal in the United States.


Detailed responses:


This article is republished from The Conversation under a Creative Commons license. Read the original article.

Read more >>

Tuesday, August 23, 2022

If the PM wants wage rises, he should start with the 1.6 million people on state payrolls

If Prime Minister Anthony Albanese really wants to boost wage growth, there’s a simple way to do it.

And if he did that one simple thing, analysis prepared for The Conversation shows some of our most trusted but least well-paid workers – teachers and nurses – could be among the wage winners.

During the election campaign, the Labor leader made a public push for wages growth. He held aloft a $1 coin and said that’s what his government would be asking for: a boost in the minimum wage from $20.33 an hour to $21.36, which would lift it 5.1%, which was the inflation rate at the time.

After the election that’s what the government asked for. The Fair Work Commission delivered slightly more for Australia’s lowest-paid – an increase of 5.2% – and somewhat less for higher earners: an increase of 4.6%.

Then the inflation rate climbed to 6.1%. That figure, for the year to June, far eclipsed total wage growth of 2.6% over the same period and rendered even what the commission had delivered out of date, sending real (inflation adjusted) wages backwards by the most in 25 years.

Next week’s Jobs Summit is, in part, an attempt to do something about wages. But the issues paper released ahead of the summit is curiously bereft of ideas about how.

The paper says wages have traditionally climbed with labour productivity (which is output per hour worked) and that productivity growth has fallen to its lowest in 50 years.

It says if businesses invested more in labour-saving technology and workers got a better mix of skills, productivity growth would climb, but (and it’s a big but) that growth would only flow through to wages “over the medium term”.

Which leaves… not much happening for wages in the meantime.

Silent on what the states should do

The other things the paper notes are that fewer workers are covered by enterprise agreements and more by Fair Work Commission awards (presumably because enterprise agreements have expired, or aren’t high enough) and that 23% of workers are casuals (a figure that hasn’t changed much in 20 years).

What the summit paper doesn’t mention, but ought to, is that governments set wages – the wages of their own employees.

The lowest-paid quarter of the workforce has its wages set by the Fair Work Commission, either via the minimum wage or awards.

The Fair Work Commission looks after these people by usually increasing their wages in line with the consumer price index, and often by more.


Private employers are offering more, where they can

Most of the rest of the workforce gets only what their employers agree to, and the good news here is that, increasingly, employers are offering more.

Two years ago, as COVID took hold, the private employers who did lift wages offered an average of 0.8%. One year later, in the year to June 2021, they offered 2.7%. In the year to June this year they offered 3.8%.

Of course many private employers can’t offer much. They are small, and are being squeezed by soaring costs.

But governments budget in billions, and can afford to offer whatever they think they should, covering it with tax or borrowing.

The Commonwealth government, under Albanese, employs one quarter of a million Australians. The states, with whom Albanese could have a word, employ 1.6 million – many of them teachers and nurses.

Yet far from increasing their wages in line with inflation, or even in line with private sector increases, Australia’s states have been extraordinarily stingy.

Governments are offering as little as 1.5%

Victoria’s wages policy, announced in January, is for a cap on annual increases of 1.5%. Western Australia, despite its large budget surplus, was limiting increases to 2.5%. In July it lifted the offer to 3% with a one-off $2,500 cost of living payment.

NSW has a ceiling of 3%, which falls back to 2.5% after two years. (And the NSW ceiling is lower than it seems. It includes employers’ super contributions, which are to climb by 0.5 percentage points a year for the next few years, making the quoted ceiling of 3% a ceiling of 2.5% for take-home pay.)

Using Bureau of Statistics figures to examine the increases actually paid (as opposed to offered) shows Western Australian public sector wages climbed just 1.1% in the year to June. South Australian public sector wages climbed 1.7%.

In Victoria and NSW, the increases were 2% and 2.1%. Only Queensland, which shelled out 4%, paid anything approaching the rate of inflation.

Nurses and teachers hit hard

This stinginess hits most the two biggest groups of state government employees: teachers and nurses.

Whereas public wages as a whole climbed 2.4% over the past year, the wages of public education and training workers climbed 2.2%.

A Bureau of Statistics breakdown prepared for The Conversation shows that in NSW and Victoria those workers (mainly teachers) got just 2%. In Victoria, health care and social assistance workers (largely nurses) got 1.7%.

Economic research suggests the states are stingy, in part because they can be. They are the only big employer of nurses, teachers, police and public servants.

The PM could have a word

If Albanese means what he says about wages keeping pace with inflation, his next step should be to ask his mates in the states to do more. Most of the premiers are from his side of politics. All of them will be at the Jobs Summit.

There are signs he is putting his own house in order. His departments have been told not to enter into new agreements while the previous penny-pinching wages policy is under review, and he has backed a big rise for aged care workers (whose wages the Commonwealth funds) in a submission to the Fair Work Commission.

But going easy on the states, as he has so far, while telling private sector employers with far smaller financial resources to lift wages, makes it look as if he is not serious.

If he genuinely believes wages ought to keep pace with inflation, he ought to name and shame his Labor mates.The Conversation

This article is republished from The Conversation under a Creative Commons license. Read the original article.

Read more >>

Tuesday, August 16, 2022

Why unemployment is set to stay below 5% for years to come

Unfathomably, Australia’s unemployment rate has sunk to 3.5%. Even harder to believe is that it will soon sink lower – perhaps even this week, when the update is released on Thursday – and after that, if the ANZ’s forecasts are correct, dip below the next threshold to two-point-something for the first time since 1974.

That this can be happening at a time when interest rates are soaring and households are tightening their belts belies standard analysis.

So what’s driving this new ultra-low unemployment? It’s been harder for employers to get workers, because borders were closed, and because of unusually high rates of people off sick.

But digging further into the economic data reveals something we haven’t seen before – which has already changed the lives of almost 100,000 Australians.

Time lost to illness has almost doubled

Even now, an awful lot of workers on whom employers normally depend are sick, or on reduced hours, caring for someone who is sick.

In the years before COVID (and in the first two years of COVID itself), typically 3% of the workforce worked less than usual hours in any given week as a result of illness or injury. Calculations by the University of Melbourne’s Jeff Borland suggest so far this year it’s been 5.2%.

The effect isn’t quite as dramatic when you examine the number of hours lost. Pre-COVID (and in the first two years of COVID) 2% of working hours were lost to illness. So far this year, with so many of us ill, it’s been 3.8%.

As a sign at a doctor’s surgery I visited the other day read:

The whole world is short-staffed, be KIND to those who show up.

Borland illustrates what sickness is doing to employment by talking about a café with five staff. He says if one is away one day per week on average, the cafe might have to put on a sixth to cover – if it can. Unfilled vacancies are higher than ever.

It’s also true (at least until now) we’ve been spending big-time, spurred on by pent-up demand from when we were all in lockdown, as well as ultra-low interest rates and generous government support.

We escaped the jobless ‘escalator’

But there’s something else explaining our new ultra-low unemployment, something that flows from the nature of the labour market – and how it’s different from the market for goods in shops.

You can see it most clearly when unemployment climbs.

In the half century we have been collecting modern employment statistics, unemployment has shot up dramatically three times:

  • in the mid 1970s, when it jumped from 2.1% to 5.4% in a matter of months and never came back down

  • in the early 1980s, when it jumped from 5.3% to 10.3%, and took six years to come back down

  • in the early 1990s, when it jumped from 5.8% to 11.2%, and took seven years to come back down.


Each time, unemployment went up by the escalator, and down by the stairs.

Remarkably, as the graph shows, that’s not what happened during the global financial crisis or COVID. Instead, both times the government and Reserve Bank went hard and early with as much support as it took to prevent unemployment climbing too far.

If unemployment had shot up as it had in earlier crises, it might have taken the best part of a decade to get down.

The long-lasting scars of unemployment

Economists use an ugly word to describe the reasons why unemployment stays high long after the reason for high unemployment has passed. It’s “scarring”.

Each person who loses their job or who is unable to get a first job when unemployment shoots up can lose confidence and up-to-date work experience.

Then, as things improve and employers begin hiring again, people who have been out of work for longer get pushed back in the queue. Employers find it safer to take on new graduates or people with more recent experience.

The more those who were unlucky during a crisis get pushed to the back of the queue, the less employable they seem – and the less employable they become.

This puts a new higher “floor” under the unemployment rate, because it gets to the point where employers would rather not fill a vacancy than put on someone who’s been continually passed over.

It’s a phenomenon well known to the Treasury and Reserve Bank. What’s less well known, and is only now becoming apparent, is that it can work in reverse.

Almost 100,000 lives already transformed

If employers are forced to hire people they wouldn’t have in other circumstances, because they’ve run out of every other conceivable option, those people become employable. They either develop the right skills, or employers discover they are not so bad after all. The floor under the unemployment rate drops.

We haven’t seen this before – at least, not in the past half century – because employers have never before been given no other option but to employ people they would really rather not.

People are regarded as long-term unemployed (and harder to employ) if they’ve been out of work for one year or more. In the year to June 2022, the number of long-term unemployed fell from 218,200 to 130,100.

That fall is far more important than the fall in the total number of unemployed from 682,400 to 493,900.

It means those Australians are more likely to be employed than shunned for years to come. It means future employments rates are more likely to start with a “2”, a “3” or a “4” than a “5”.

It means we’ve bought ourselves long-lasting lower unemployment, whatever happens from here on.

It also means the best part of 100,000 lives have been transformed. It means the best part of 100,000 people no longer face years on JobSeeker.

And it means we’ve discovered something really useful.

Just as a crisis that renders people near unemployable can lift the floor under unemployment for years to come, a crisis that forces employers to take on people rendered near unemployable can cut it, perhaps for a very long time.The Conversation

This article is republished from The Conversation under a Creative Commons license. Read the original article.

Read more >>

Sunday, August 14, 2022

‘It’s important not to overreact’: top economists on how to fix inflation


Wes Mountain/The Conversation, CC BY-ND

Australia’s top economists are divided about how to tackle ballooning inflation of 6.1% that’s forecast to climb to a three-decade high of 7.75% by the end of the year.

Three of the 48 leading economists surveyed by the Economic Society of Australia and The Conversation say Australia should be able to tolerate an inflation rate of 8% or higher.

Seven expect inflation to fall back to an acceptable level without the need for any further action other than Reserve Bank adjustments to interest rates.

That view was lent weight by news from the United States last week that annual inflation slid from 9.1% to 8.5% in July, after inflation of zero over the month.


Asked how high an inflation rate Australia should be prepared to tolerate, most nominated a rate at the top of or above the Reserve Bank’s 2-3% target band.

Twelve nominated a rate well above the target band.

Ten said the step-up in inflation was primarily caused by events overseas not within Australia’s power to control.

The economists polled are recognised as leaders in their fields, including economic modelling and public policy. Among them are former Reserve Bank, Treasury and OECD officials, and a former member of the Reserve Bank board.


Beyond rate rises, what could be done?

There are three kinds of actions governments can take to bring consumer price inflation down

  • actions that suppress consumer spending (“demand”)

  • actions that boost the supply of goods and services (“supply”)

  • actions that directly restrain prices

Invited to choose from a menu of options, and add options to the menu, the panel placed slightly greater weight on measures to restrain demand than measures to boost supply, and greater weight on both than measures to directly restrain prices.

The most popular measure, backed by 37% of those surveyed, was winding back government spending. Almost as popular, backed by 33%, was a super-profits tax on fossil fuel producers, with the proceeds used to reduce cost of services.


Another tax measure – increased income taxes with the proceeds used to reduce cost of services – was backed by 17%. Two of those surveyed wanted to abandon the legislated Stage 3 tax cuts for higher earners due to take effect in 2024.

But several of those who advocated winding back government spending or boosting tax did so without enthusiasm, believing that while the government should be prepared to assist the Reserve Bank in suppressing consumer demand, suppressing demand wouldn’t tackle the main reasons prices were climbing.

The risks of doing too much

The Australian National University’s Robert Breunig said much of the inflationary pressure had come from things such as oil prices that were beyond the power of Australians to influence, making it “important not to overreact”.

Melbourne University banking specialist Kevin Davis said what appeared to be high inflation might actually mainly be a series of short-term supply-induced price rises, making it hard to see how choking demand could do much good.

Australia’s current ultra-low unemployment rate was an achievement that should be celebrated, rather than put at risk without a good reason.

If high inflation did stay for a while and spread to wages, a welcome side effect would be more affordable housing.

Curtin University macroeconomist Harry Bloch made the point that while measures to suppress demand in Europe and the United States would indeed have an impact on global energy and food prices, that wasn’t true of measures to suppress demand in Australia, which is too small to influence global prices.

Consulting economist Rana Roy disagreed, saying the fact that high inflation wasn’t primarily caused by excess demand was no reason not to treat it by containing demand. Whatever the cause, containing demand would contain inflation.

Mala Raghavan from the University of Tasmania and Leonora Risse from RMIT University suggested winding back or delaying spending in two areas where it was clear the government was contributing to domestically-driven higher prices: subsidies for, and spending on, construction and infrastructure.

Withholding gas, boosting immigration

The most popular ideas for boosting the supply of goods and services to take pressure off inflation were reserving a portion of Australian gas and other commodities for domestic use, and boosting immigration, supported by 33% and 29% of the economists surveyed.


Reserving a portion of Australian east coast gas for use in Australia would help decouple Australia’s east coast gas prices from sky-high international prices as has happened in Western Australia, which reserves 15% of its gas for domestic use.

Boosting immigration would take pressure off costs by easing labour shortages.

Federation University’s Margaret McKenzie suggested investigating blockages in supply chains and offering diplomatic and industry support to bust them.

Subsidising childcare, subsidising fuel

The most popular idea for directly restraining prices was increased subsidies for childcare, supported by 25% of the economists surveyed, several of whom suggested it could also boost the supply of workers who had previously been prevented from working by unaffordable childcare.


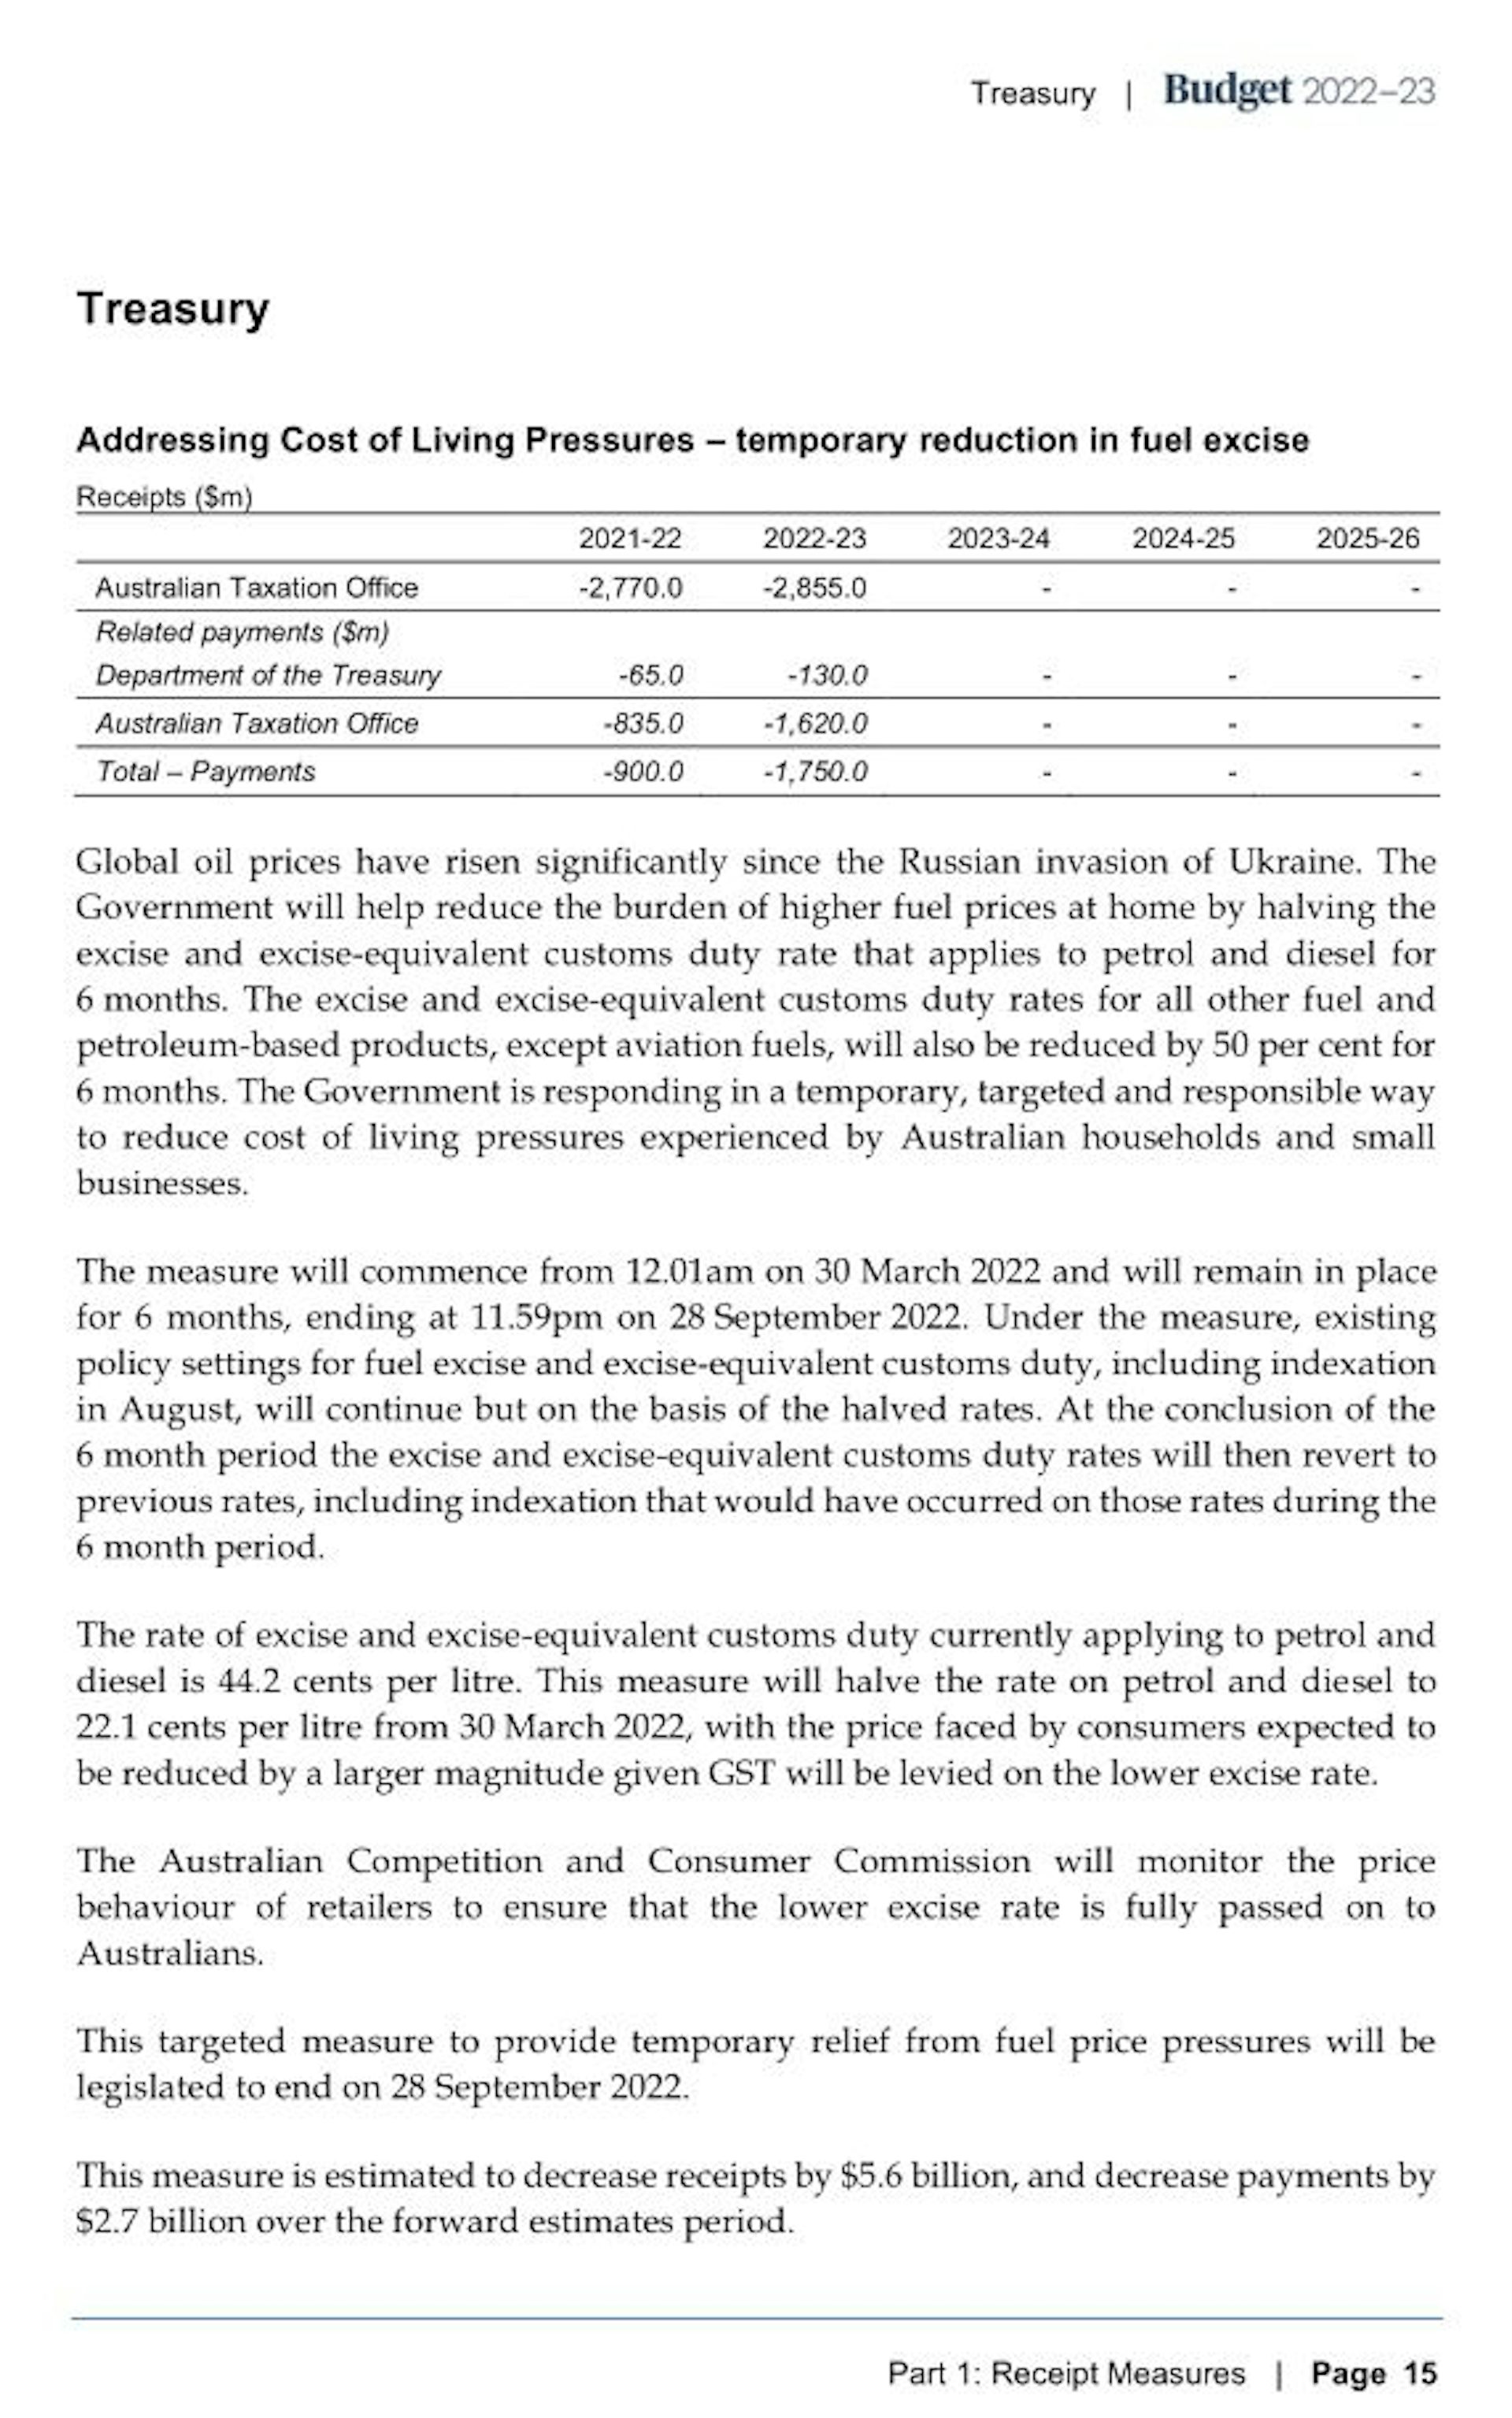
Other ideas that would directly restrain some prices included pushing for below-inflation wage rises in the Fair Work Commission and extending the six-month cut in fuel excise due to expire in September.

Former Reserve Bank board member Warwick McKibbin warned against pursuing low inflation for its own sake, saying when the economy was weak or in recession a high rate of inflation could be more easily justified than at other times.

He said the Reserve Bank should stop targeting inflation and instead target the rate of growth in national spending, an idea he will be putting to the independent review of its operations.


Detailed responses:

The Conversation

This article is republished from The Conversation under a Creative Commons license. Read the original article.

Read more >>

Tuesday, August 02, 2022

The RBA is hiking rates because it’s scared it can’t contain inflation

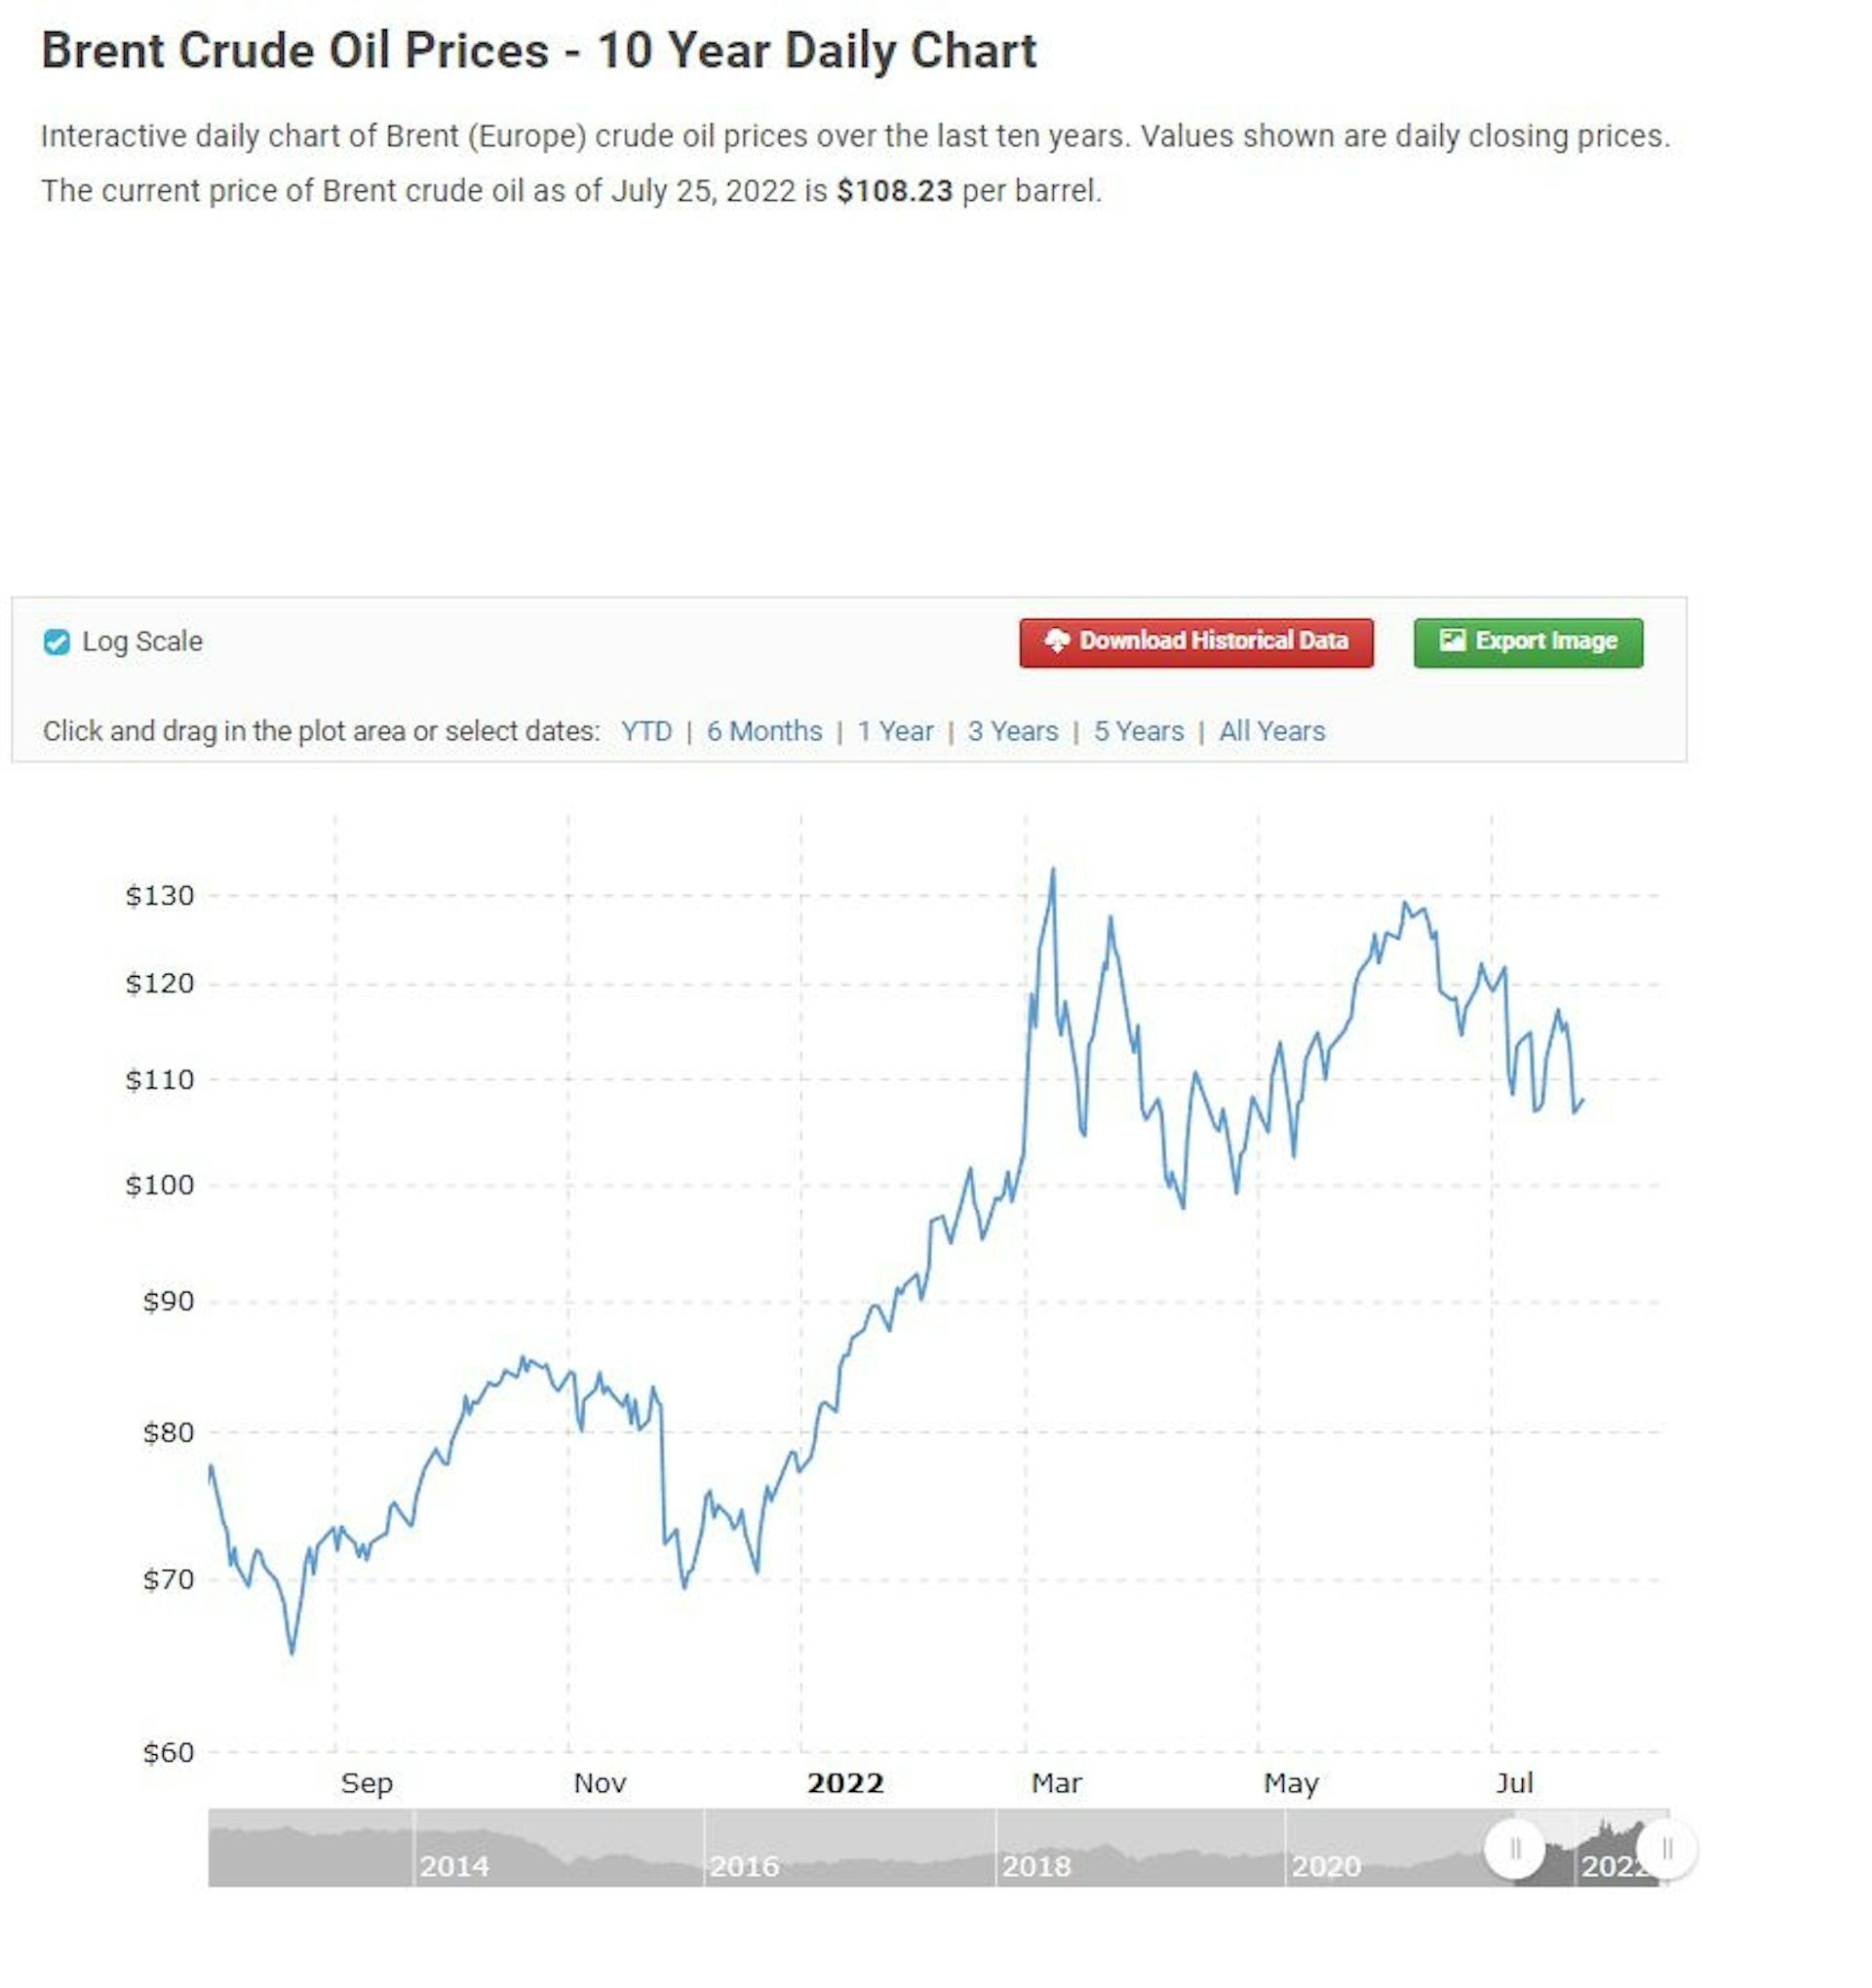
There are signs inflation pressures are easing. Oil prices are down almost 20% on their peak in March. They’ve been falling consistently for a month.

The average capital city unleaded price is down from A$2.11 per litre in early July to a more bearable $1.74.

The money market is pricing in much lower inflation than we presently have over the next one to four years, and consumers’ inflation expectations (although still high at 6.3%) eased off a bit between June and July.

So why did the Reserve Bank just hike its cash rate by an outsized 0.50 percentage points for the third consecutive month, taking it to 1.85%?

Partly because it knows what is to come.

Higher inflation in store

The 6.1% inflation figure released last week was for the year leading to the quarter that ended in June. Since then, in July, we’ve been hit by massive electricity price increases, some as high as 19%, and gas prices that have manufacturers screaming.

The monthly inflation gauge compiled by the Melbourne Institute (the Bureau of Statistics hasn’t yet gone monthly) kicked up 2.1% in July, the biggest monthly jump in two decades.

And there’s something else.

The Reserve Bank’s deepest fear might be that it can’t contain inflation, and that its apparent success over three decades has owed a lot to luck.

Reserve banks blessed by luck

Inflation fell to low levels throughout the world around the world at about the time it fell to low levels in Australia. From the mid 1990s, inflation fell to 2-3% in the US, the UK, Canada and just about every other Western nation, as China deluged the world with low-priced goods and companies began offshoring.

It got to the point where almost as many prices were falling as rising.

The US economic historian Adam Tooze says it’s reasonable to ask whether we had inflation at all from the mid 1990s onwards.

The Bank for International Settlements defines inflation as a “largely synchronous increase in the prices of goods and services” – a situation where prices broadly climb together.

Little real inflation for 30 years

It needs to be largely synchronous to qualify as inflation because otherwise the amount a dollar can buy isn’t clearly changing – any such effect is overwhelmed by changes in the mix of goods and services a dollar can buy.

It is only when prices start to move together, as they are now, that inflation gets normalised and becomes entrenched.

Twenty years ago, in June 2002, by my count 20 of the 87 types of items that made up the consumer price index fell in price. Ten years ago, 32 fell in price.

By economist Saul Eslake’s count, this June only 15 of what are now 90 expenditure classes fell in price – what appears to be the lowest number in decades.

Suddenly, price rises are synchronised

It means the Reserve Bank is having to deal with broad-based inflation of a kind it hasn’t faced since it began targeting inflation in the early 1990s.

Just about the only tool it has to do it – higher interest rates – makes people poorer.

Higher interest rates work in other ways as well.

  • they increase the reward for saving, diverting some money from spending

  • they make it harder to borrow, diverting more money from spending

  • and they push up the exchange rate, making imported goods cheaper – or they would have, were other central banks not also pushing up their rates, meaning the Australian dollar is no higher than it was when the bank began pushing up rates in May.

But their chief effect is impoverishing variable mortgage holders, to the tune of hundreds of dollars a month.

The more variable mortgage rates go up (Tuesday’s hike will push up the ANZ standard rate from 4.24% to 4.74%) the less mortgage holders have to spend on other things, and the less they will add to price pressure.

That’s the idea. And it is disingenuous to pretend otherwise.

Mortgage buffers are scant protection

In a speech last month Reserve Bank Deputy Governor Michele Bullock said households in aggregate were “well positioned”.

They had saved $260 billion since the start of the pandemic, much of which had gone into redraw facilities and offset and deposit accounts.

Around half were almost two years ahead on mortgage payments, or more. They had “large buffers”.

But, as University of Newcastle economist Bill Mitchell points out, by the bank’s own logic, this just means it will have to squeeze them harder.

It wants Australians to spend less and, if they use their buffers to keep spending as they have, it will have to either give up, or push rates higher until they do.

RBA Governor Philip Lowe says he is navigating a “narrow path” to curb inflation without too much pain. He can’t be certain he knows the way.The Conversation

This article is republished from The Conversation under a Creative Commons license. Read the original article.

Read more >>