A go-slow on spending sent the economy backwards 0.3% in the first three months of this year, only the fourth such decline since Australia was last in recession in the early 1990s.
Treasurer Josh Frydenberg says Treasury has told him the next three months, the June quarter that we are in at present, will see a “far more severe” contraction, one private sector forecasters believe could be as high as 10%.
Asked whether that meant Australia was already in recession, he said it did.
Quarterly GDP growth since 1990
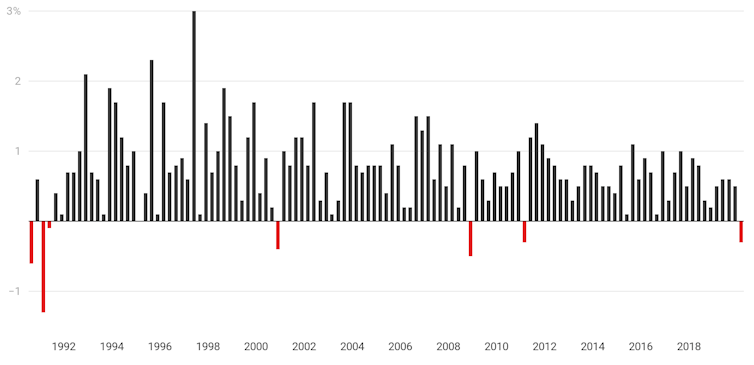
Most unusually for an economic downturn, incomes rose throughout the quarter, pushed higher by a 6.2% increase in government payments related to COVID-19 and the bushfires, and an 11.1% increase in insurance payouts as a result of bushfires and hailstorms.
Household incomes even rose in per capita terms, by 0.1% after abstracting for population growth.
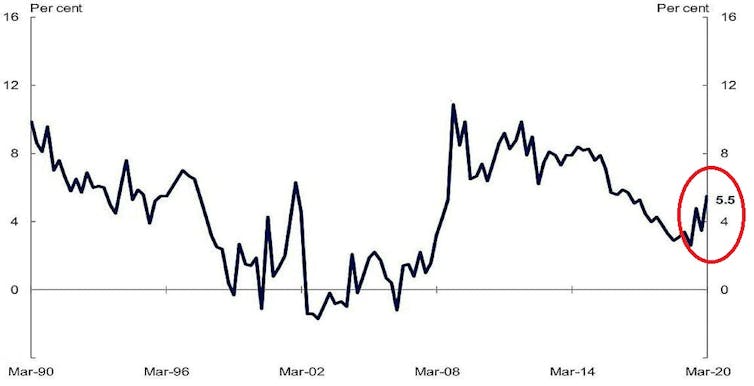
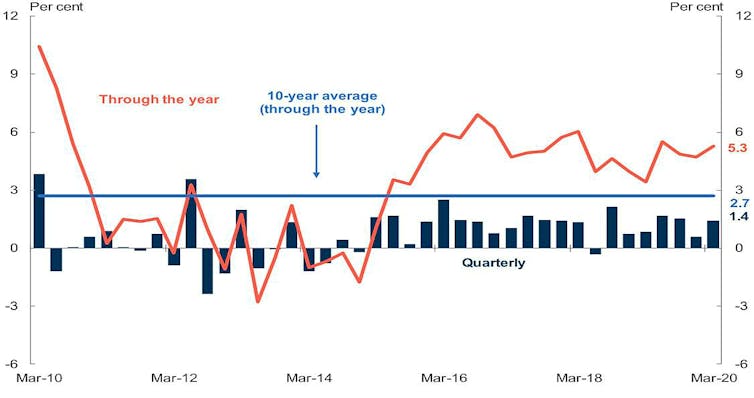
But rather than spend more, Australian households dramatically increased saving in the quarter, pushing the household saving ratio up from 3.5% to 5.5% and pushing down household spending 0.2%.
Household savings ratio
Spending on goods actually increased over the three months as Australians stocked up on essentials including toilet paper in March.
The production of “petroleum, coal, chemical and rubber products” surged 8.1% as consumers stocked up on cleaning and disinfectant products.
But spending on services plummeted, led down by dramatic falls in spending on transport and hotels, cafes and restaurants.
Household consumption, March quarter
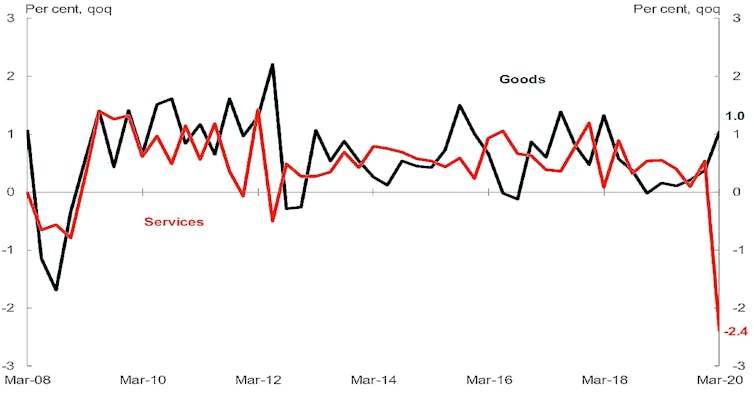
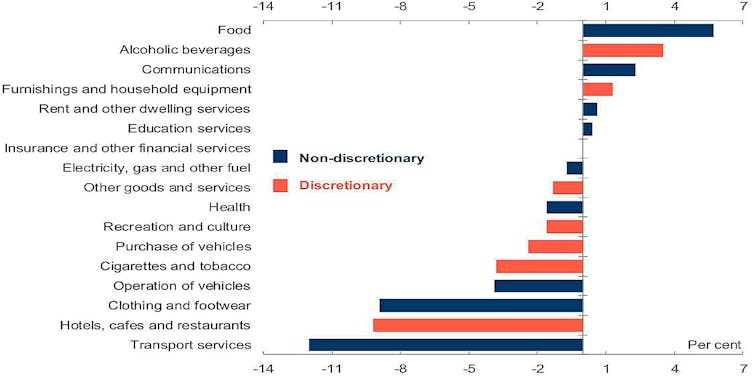
Spending on transport services (airlines and the like) fell 12.0%. Spending on hotels, cafes and restaurants fell 9.2%, each the biggest fall on record.
“Production” in these industries fell 4.9% and 7.5%. Profits fell 6.8% and 14.2%.
Spending fell on ten of the 17 consumption categories.
Household consumption by category, March quarter
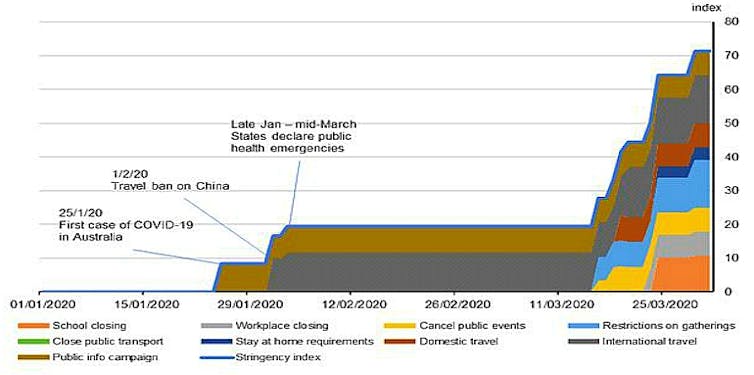
Most of the changes took place at the very end of the March quarter.
A new index of the “stringency” of COVID-19 containment measures released with the national accounts shows these ramped up only in the final two weeks.
Most have been in place for the entirety of the June quarter to date, suggesting the impacts on spending and production will be a “lot more substantial”, in the words the treasurer used in the national accounts press conference.
ABS stringency of containment measures index
Were it not for government spending, which has climbed 6.2% throughout the year, the plunge in March-quarter GDP would have been much more severe.
Calculations of the Bureau of Statistics suggest it would have been twice as severe, a March quarter decline of 0.6% rather than 0.3%.
General government expenditure
The treasurer described Australia as “on the edge of the cliff” in the March quarter, facing “an economist’s version of Armageddon”.
The treasury had been contemplating a fall in gross domestic product of 20% in the June quarter. Australia has avoided that fate by acting on health and the economy early.
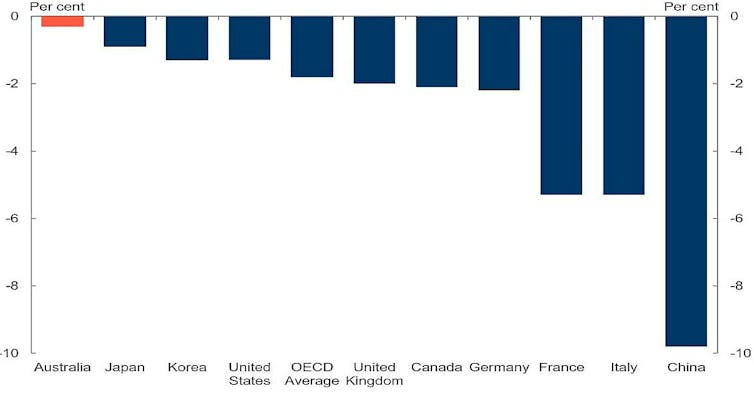
Its fall in GDP of 0.3% in the March quarter was one-third the OECD average.
International comparisons, real GDP growth, March quarter
The treasurer has scheduled an economic update for July 23 which will include the result of a review of the JobKeeper program.
Asked whether it could be referred to as a mini-budget, he said it could be.
Read more:
Our needlessly precise definition of a recession is causing us needless trouble
![]()
Peter Martin, Visiting Fellow, Crawford School of Public Policy, Australian National University
This article is republished from The Conversation under a Creative Commons license. Read the original article.