Last time, we were flying blind.
In what must have been one of the worst-timed decisions of an incoming government ever, in 2008 the newly-installed Rudd government slashed the budget of the Australian Bureau of Statistics ahead of the global financial crisis.
In its first budget it hacked A$28 million off ABS budget, and told it to work out what to cut.
The ABS lopped off its job vacancies survey, closing it down in May, just months before the collapse of Lehman Brothers in September.
Then in July it cut the size of its employment survey from 54,400 people to 41,100, making the results less accurate just as accuracy began to really matter.
Rudd and his staff had to navigate partially blindfolded.

It was, as the then head of the treasury’s macroeconomic group David Gruen said at the time, as if the Titanic was sailing into iceberg-infested waters while those with the requisite skills were hard at work “in a windowless cabin”.
Twelve years on — astoundingly — David Gruen has found himself on the other side of the cabin wall as head of the ABS.
He took up the job on December 11, 2019, just days after the first Wuhan resident fell sick with what turned out to be coronavirus.
By the end of February he had “this feeling I last had in the middle of 2008”.
Not much coronavirus had spread to Australia by that point, but as Gruen recounted to the Canberra branch of the Economic Society, it felt like “something big was coming”.
Something big was coming
Gruen called a brainstorming session and asked senior staff what data they could produce quickly — far more quickly than usual — that would tell people what was happening in near real-time.
The business conditions unit said it could run a survey of 1,200 businesses, but that it would cost money — $20,000. Gruen told them to spend it. The survey began on March 16, ran for three days and was published on March 26, a record-quick ten days after the first questions were asked.
That initial survey asked how COVID was hurting each business, what it expected. Then requests started coming in for further questions about cash on hand, revenue and employees. Month by month the survey evolved as the crisis evolved.
Read more: Australia's first service-sector recession unlike those that went before it
Then the household survey unit realised it could do one. It repurposed a panel it had assembled for a different survey and went back to the same households month after month for real-time insights into things such as the changing precautions they were taking, their changing comfort with social gatherings, their use of stimulus payments and the state of their finances.
Spending in shops was convulsing, literally down 17.7% one month (on lockdowns), then up 17% the next (on panic buying).
Delays unacceptable
Yet the retail figures had always been presented with a delay — four to five weeks after the month to which they referred — while the bureau waited for all of the retailers it was surveying to report, making the insights anything but current.
Gruen got the bureau to release “preliminary” numbers two or three weeks earlier than usual, as soon as 80% of the businesses surveyed had responded.
Information about deaths (rather useful in a health crisis) was even worse.
Not information about COVID deaths, which heath authorities were totting up daily, but deaths from all causes, which the bureau traditionally released once a year once all the reports from coroners had come in, every September, almost an entire year after the year in which the deaths took place. Some of the deaths were the best part of two years old.
Provisional now, final later
Gruen suggested that rather than wait until every coroner’s report was finalised, the bureau release “provisional mortality statistics” based on only doctor-certified deaths (80-85% of all deaths) monthly.
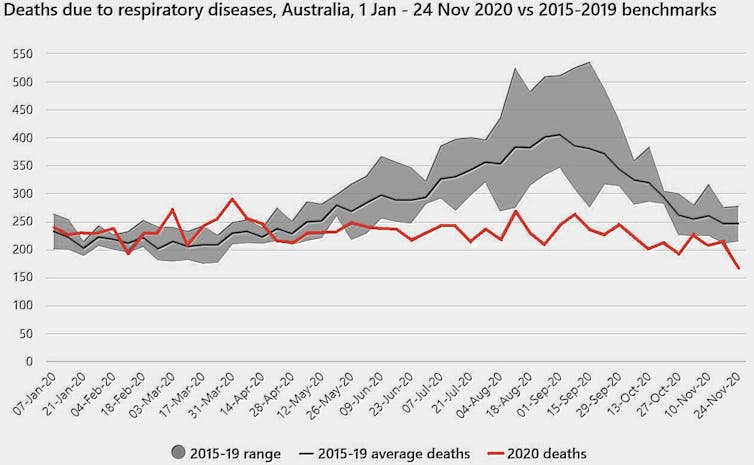
What it showed was startling. Rather than having more deaths than normal from non-COVID causes, as had much of the world, Australia had fewer.
Read more: Up to 204,691 extra deaths in the US so far in this pandemic year
The excess deaths in other countries might have been either COVID deaths not classified as COVID deaths, or deaths inadvertently caused by measures designed to fight COVID.
In net terms Australia has had neither. The bureau’s figures show we’ve been less likely than normal to die of heart disease and strokes, and far less likely to die from flu, probably because social distancing has made it harder to catch.

As incredibly useful as these innovations have been, none has been as valuable as the bureau’s inspired decision to obtain and publish near real-time payroll data.
What took months is now near-instant
The Tax Office is phasing in a requirement for businesses to report where they send their payroll instantly using a system it calls single-touch payroll. 99% of big and medium firms (20 or more employees) are doing it, and 75% of small firms.
It is data on 10 million jobs updated weekly, broken down by gender, age, industry and location — near-instant data of the kind Australia has never seen.
The treasury has been able to use it to fine tune (and change) its programs as the crisis was unfolding.
Detail like never before
And there’s more. The bureau is going to use single-touch payroll to come up with a near-instant monthly measure of earnings. It is going to use business activity statements provide an near-instant measure of business turnover.
And it has got the big four banks to hand over aggregated consumer spending data far more comprehensive than the subset that finds its way into the retail trade survey.
It is also experimenting with using anonymised electricity smart meter data to work out the extent to which people are staying at home, and using deidentified data from mobile devices to work out the extent to which we are moving about.
Read more: GDP is V-shaped, but not yet good. These three graphs tell the story
If the government has got most things right in the economic management of the crisis, it is largely because it has known more about the granular detail of what’s been happening than any government before it.
With one forecast suggesting hundred of thousands of Australians could lose their jobs when JobKeeper ends on March 28, and the impact of the extra measures the government will unveil this week uncertain, it’ll keep needing to know.
Peter Martin, Visiting Fellow, Crawford School of Public Policy, Australian National University
This article is republished from The Conversation under a Creative Commons license. Read the original article.

