There’s one graph that sums up both the good and not-yet-as-good detailed by Treasurer Josh Frydenberg at Wednesday’s national accounts press conference.
It’s a graph of the level of Australia’s gross domestic product – how much is produced and earned each three months in Australia – adjusted for inflation.
Australian quarterly gross domestic product
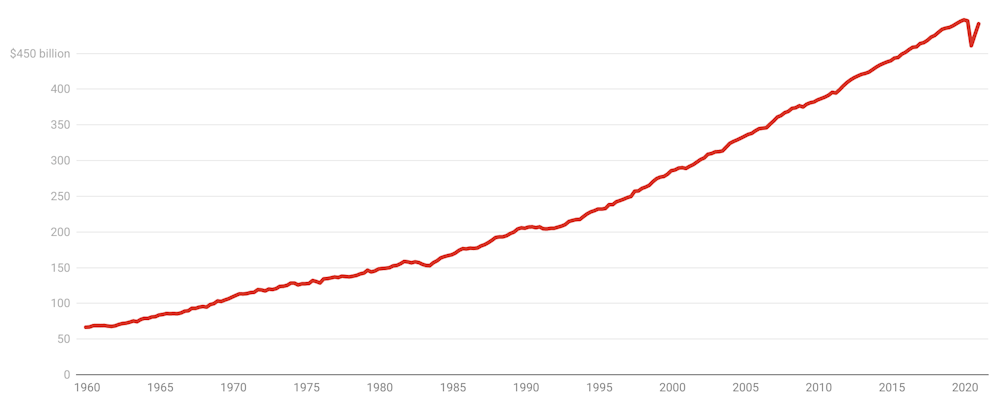
It shows Australia’s economy getting bigger and bigger over almost all the past 80 years with only two readily-apparent slowdowns; one in the early 1980s recession, and one in the early 1990s recession.
Until COVID. Last year’s recession wasn’t a slowdown like the other two – it was a collapse, so big you could see it on any scale, even one that went back to when modern records began.
And it was V-shaped.
As soon as the economy collapsed – by 7% in the three months to June, the most since the Great Depression - it bounced back 3.4% in the three months that followed and (we now know) a further 3.1% in the three months that followed that.
It’s actually more like the beginning of a V
But, as I suggested last time (and as the graph shows) the gain of 3.1% and the gain of 3.4% don’t anything like offset the dive of 7% because a percentage increase in a small number does less than a percentage dive in a bigger number.
It’s reasonable to think that population-fuelled GDP is irrelevant to our lives, that what matters is GDP per head - the amount earned per person.
It shows much the same pattern: a V so clear you can see it on the widest possible scale, which is the one I have presented:
Per capita quarterly GDP
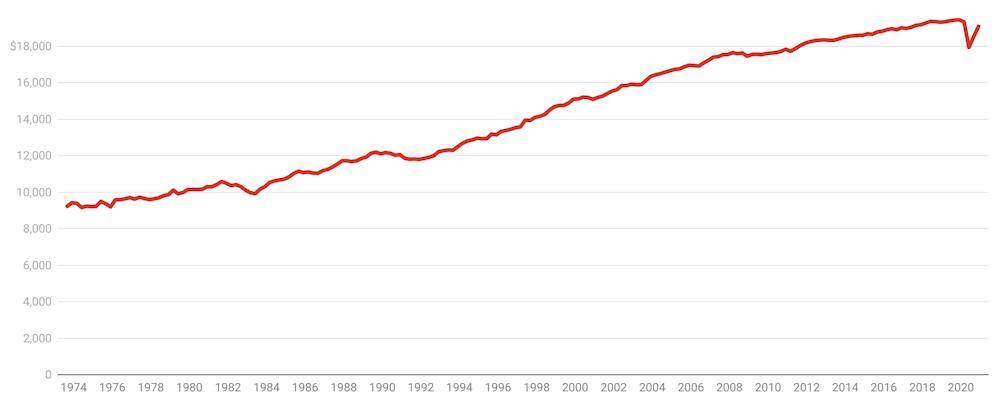
The economy is 1.1% smaller than it was at the start of last year and 3.3% smaller than it would have been had economic growth continued, an extraordinarily good outcome given what Frydenberg described as the “economic abyss” forecast just five months ago in the October 2020 budget.
Government support has turned into private spending
Driving the recovery has been a continuing rebound in consumer spending. It dived 12.3% in the June quarter, climbed 7.9% in the September quarter and in the three months to December when Victorians became freer to spend, a further 4.3%.
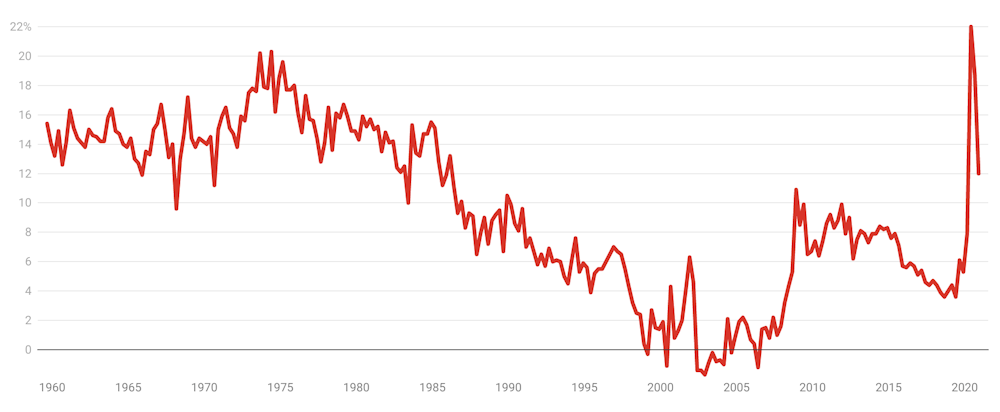
We’ve funded it in part by cutting what had been an extraordinarily high household saving ratio.
Household saving has slid from a record high 20% of net-of-tax income in the June quarter to a more welcome 12% in the December quarter.
Household saving ratio
Unable to spend much on travel, we are spending on the things we can. In the three months to December our spending on motor vehicles jumped a dizzying 31.8%, putting it up 22.2% over the year.
Our spending in hotels, cafes and restaurants rebounded 17.5% in the months to December, although with overseas and much interstate travel restricted, it was still down 29.8% over the year.
With the help of low interest rates and incentives, housing investment climbed 4.1% in the quarter (Homebuilder) and business investment in plant and equipment climbed 8.9% (instant asset write-off).
There are no guarantees
Farm production soared an astounding 26.8% in the quarter – the biggest jump since 2008 – on the back of the second-best winter crop on record.
If the economy continues to recover at this pace and the “V” turns into an upward tick we will make big inroads into unemployment and the coronavirus recession will look like a blip, an aberration.
But there are no guarantees. The JobKeeper employment subsidy ends on March 28 and the sharp upticks in business investment and farm production are unlikely to continue.
Read more: Josh Frydenberg has the opportunity to transform Australia, permanently lowering unemployment
Much will depend on the May budget, which comes out before the next update.
Among the budget decisions that will matter are how it will deal with the funding requirements of the aged care royal commission, whether and how it proceeds with the legislated increases in compulsory superannuation, and how quickly and to what extent it withdraws support from the economy.
There’s a case for keeping support high in order to extend the rebound in GDP and make big inroads into unemployment right up until the point we return to meaningful inflation. There’s a case for going for growth.
Peter Martin, Visiting Fellow, Crawford School of Public Policy, Australian National University
This article is republished from The Conversation under a Creative Commons license. Read the original article.